Use Snapdragon Profiler to Improve Your App’s Performance
How can you know your app is operating at peak performance? How can you be sure that all the work you’ve put into it results in an optimal user experience?
We’ve designed Snapdragon® Profiler so you can dive deep and identify problems that get in the way of your users being completely delighted with your app’s performance. With Snapdragon Profiler, you can explore the source of problems like lagging frame rate, temperature spikes, dropped frames, jagged edges and jittery game play. You can examine the calls responsible for them, modify your code and measure the improvement.
Snapdragon Profiler allows you to analyze CPU, GPU, DSP, memory, power, thermal, and network data, so you can find and fix performance bottlenecks. It’s an ideal tool for confirming your assumptions about what your app is doing and how it is behaving (and for finding out what it may be doing that you had not intended).
The installers for Windows, Linux and macOS include documentation. The Adreno GPU SDK includes the demo application Depth of Field, used for the case studies below.
You can profile apps running on a device set up for Android development and connected to your development machine through ADB (over Wi-Fi or USB).
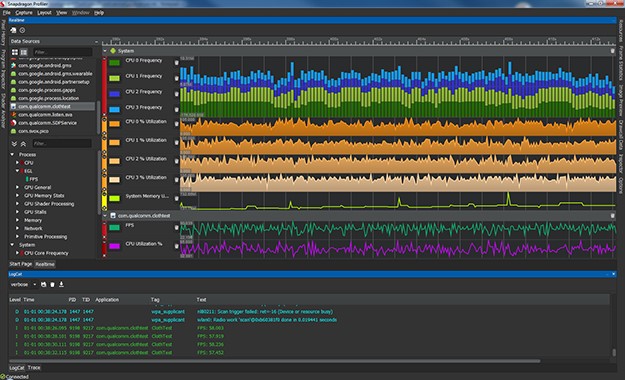
- Real-time view lets you select from more than 150 hardware performance counters and correlate system resource usage on a timeline, as shown here:
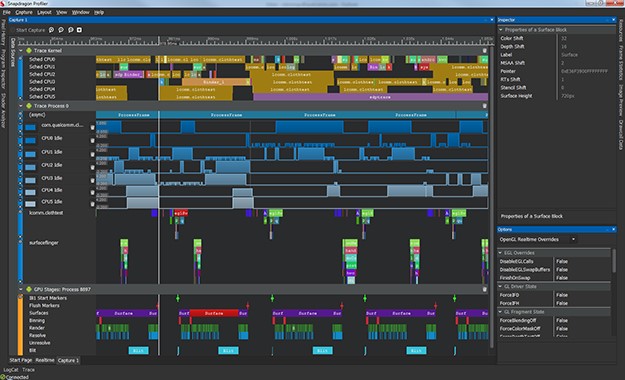
- With Trace Capture mode, you can follow kernel and system events on a timeline to analyze low-level system events across the CPU, GPU and DSP, as shown here:
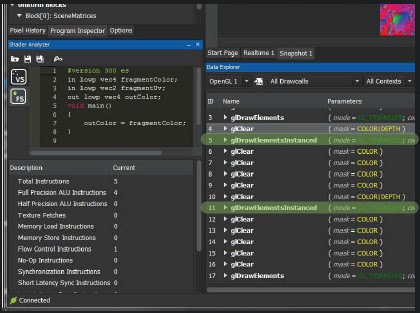
- Snapshot Capture mode captures all the graphics API calls and parameters made by an application for one frame. It is useful for detecting logic bugs that result in an incorrect render. In this mode you can capture and debug a rendered frame from OpenGL ES and Vulkan apps, and even step through and replay a rendered frame, draw call by draw call:
For details on additional features you can utilize within Snapdragon Profiler, we encourage you to review the information we have on the following pages: