
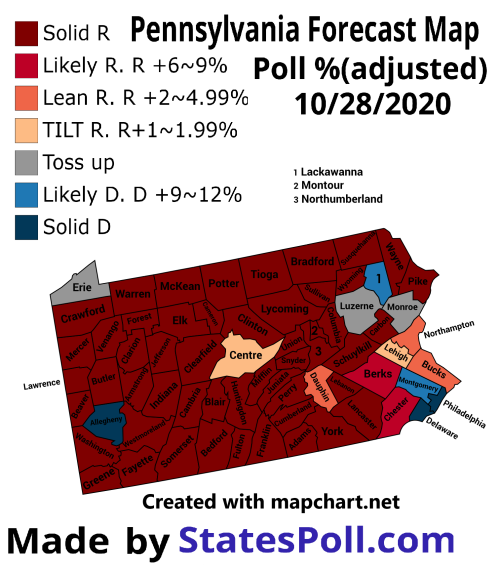
Pennsylvania Early Voting & Forecast Map. Analysis 10/28/2020
2018 PA Senate Fox Voter Analysis(with leaners):
REP 45% / DEM 44% / IND 11%
https://www.foxnews.com/midterms-2018/voter-analysis?filter=PA&type=S
NYT/Siena PA Poll. 9/30-10/2. 706 LV
Already voted 0%. 100%xElection day voters 63%=63%
https://int.nyt.com/data/documenttools/flpa-0930-crosstabs/16c21b7ab34ed4d1/full.pdf
Emerson, PA Poll, 10/4-10/5. 688 LV.
https://cdn.filestackcontent.com/D82NOBl8R5aRPRKKJAMx
Trump vs Biden, Election Day Voters: 391 LV
Push Undecided (Total 10 LV. 7 LV for Trump 2 LV for Biden)
Trump 261 LV(66.75%) / Biden 125LV(32%)
My Speculation
Trump R(63%)x96.5% + D(27%)x4% + IND(10%)x50% = 66.775%.
make sense
Early Voting TargetSmart Model
https://targetearly.targetsmart.com/
10/24) DEM 65.1% REP 27.6% IND 7.3%
10/26) DEM 65.1% REP 27.6% IND 7.3%
10/27) DEM 64.4% REP 28.1% IND 7.3%
10/28) DEM 63.8% REP 28.7% IND 7.5%
in the end
VBM(37%) REP 30% DEM 63% IND 7%
EDAY(63%) REP 63% DEM 27% IND 10%
REP 50.79% DEM 40.32% IND 8.89%
Considering MOE. REP 50% DEM 41% IND 9%
Civiqs PA Poll, 10/23-10/26. 1,145 LV.
https://statespoll.com/post/633134014505598976
REP: Trump 91% / Biden 7%
DEM: Biden 95% / Trump 4%. IND: Biden 48% / Trump 44%
VBM(37%) REP 28% DEM 64% IND 7%
EDAY(63%) REP 63% DEM 27% IND 10%
Model
Trump: R(50%)x91%+D(41%)x4%+ IND(9%)X44%=51.1%
Biden: R(50%)x7%+D(41%)x95%+ IND(9%)X48%=46.77%
So I guess approximately until
VBM: REP 27% DEM 65% IND 8% level REP takes a leads
with combine Election Day voter.
Now Early voting targetsmart Model 10/27
https://targetearly.targetsmart.com/
1. Erie county: DEM 69.6% REP 25.5% -> Toss up
2. Centre county: DEM 67.7% REP 27.7% -> Tilt REP
3, Lackawanna: DEM 76.8% REP 18.3% -> Likely DEM
(Perhaps ‘Scranton Joe’ effect?) I’m not sure is it solid D or Likely D
But considering Election day I guess D +9~12%
4. Luzerne: DEM 67% REP 26.3% -> Toss up
2016 it was Trump 57.9% Hillary 34.6%. another Scranton Joe effect?
5, Monroe: DEM 67.3% REP 25.1% -> Toss up
6. North Hampton: DEM 64.2% REP 29.4% -> Lean REP
7. Lehigh: DEM 67% REP 27.8% -> Tilt REP
8. Bucks: DEM 65.1% REP 29.8% -> Lean REP
9. Montgomery: DEM 72.4% REP 23.1% -> Likely DEM (I thought solid D.
meh) well 2012 President it was D 56.6% / R 42.3%
10. Allegheny: DEM 76.1% REP 19.5% -> Solid D.
11. Delaware: DEM 52.2 REP 20.4% -> Solid D
12. Dauphin: DEM 66.9% REP 29.1% -> Lean REP
13. Chester: DEM 62% REP 31.1% -> Likely REP
14. Berks: DEM 64.3% REP 30.7% -> Likely REP