A new map of extreme snowmelt events over the last 30 years clarifies the processes that drive rapid melting.
The work is important for understanding the world under the influence of climate change.
Snowmelt—the surface runoff from melting snow—is an essential water resource for communities and ecosystems. But extreme snow melt, which occurs when snow melts too rapidly over a short amount of time, can be destructive and deadly, causing floods, landslides, and dam failures.
“When we talk about snowmelt, people want to know the basic numbers, just like the weather, but no one has ever provided anything like that before. It’s like if nobody told you the maximum and minimum temperature or record temperature in your city,” says study coauthor Xubin Zeng, director of the University of Arizona Climate Dynamics and Hydrometeorology Center and a professor of atmospheric sciences.
“We are the first to create a map that characterizes snowmelt across the US. Now, people can talk about the record snowmelt events over each small area of 2.5 miles by 2.5 miles.”
Zeng and lead study author Josh Welty, who received his doctoral degree under Zeng’s advising, created a map that catalogs the top-10 extreme snowmelt events in terms of frequency, magnitude, temperature, and precipitation over every 2.5-mile square of the US between 1988 and 2017. They also used machine learning to understand how large-scale weather patterns affect extreme snow melt.
They found that in the western half of the country, winds transport water vapor from the Pacific Ocean eastward. However, in the eastern half of the country, weather patterns transport moisture primarily south to north from the Gulf of Mexico all the way to the Great Lakes and New England.
Their maps also reveal that in most cases, unusually warm temperatures cause extreme snowmelt. This conclusion is fairly intuitive, but a surprising finding revealed that in certain regions, particularly in the Pacific Northwest and the northeastern US, extreme snowmelt events are driven by rain—which is relatively warm—falling on snow. In these cases, extreme snowmelt events become immediately dangerous.
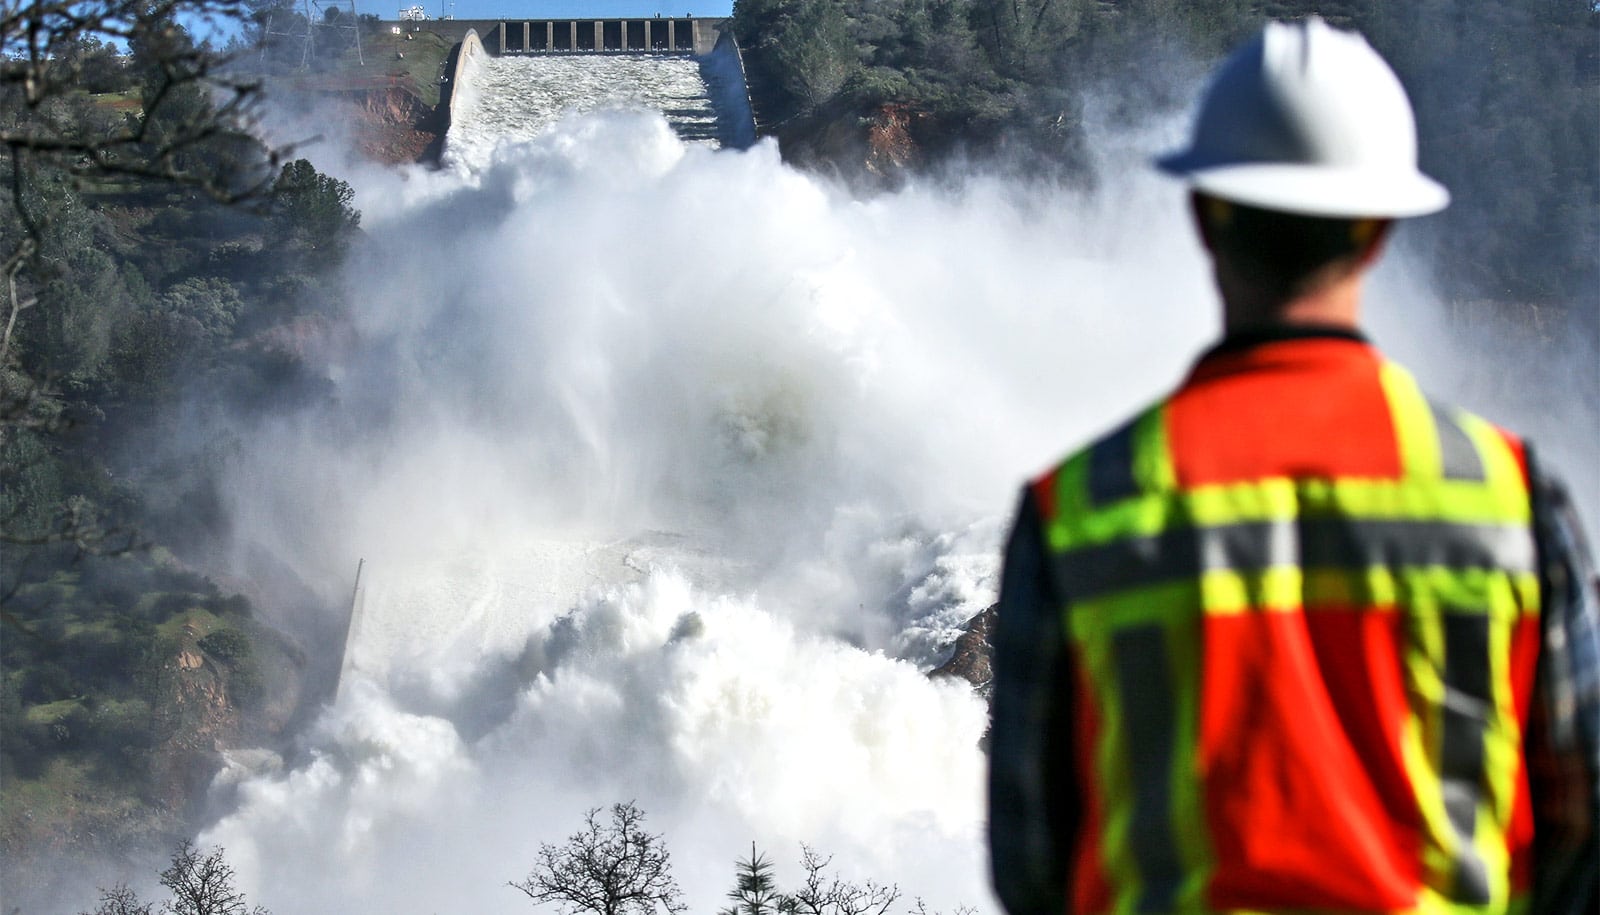
The paper outlines one such example in detail: The Oroville Dam in Butte County, California holds the second-largest reservoir in the state. In 2017, a series of storms dropped huge amounts of warm rain on the snowcapped Sierra Nevada Mountains, resulting in rapid snowmelt that filled the dam past its brim. Spillways, which provide controlled water runoff, failed, and over 180,000 people were evacuated.
Such events might happen more often in the future, according to Zeng and Welty’s findings. The researchers found only a slight increase in the frequency of such events over the 30-year period, and they didn’t see a trend in terms of the magnitude of extreme snowmelt events.
However, 30 years isn’t long enough to establish a trend, says Zeng. That means future research will be especially important.
“This paper serves as foundation and a reference point to see if and how things will be changing in different regions over the next 10 to 15 years,” Welty says.
The paper appears in the Bulletin of the American Meteorological Society.
Source: University of Arizona