![Average Gas Prices in the U.S. Through History [Updated]](https://res.cloudinary.com/tmxfoc/images/w_800,h_6025,c_scale/f_auto,q_auto/v1660049329/titlemax/gas-prices-over-time-2022-3_3623338665/gas-prices-over-time-2022-3_3623338665.png?_i=AA)
Gas Prices Through History [Updated]
We might deny it. We might diminish its importance. We might not like it. But the fact is that gas prices are intrinsically linked with the overall economy in the U.S. and have been for decades. Oil gluts and crises consistently correlate with economic prosperity and recessions, especially when
looking through the lens of inflation. Consumers in 2022 have seen a dramatic increase in gas prices due to several factors, including inflation, recovery from the COVID-19 pandemic, and Russia’s invasion of Ukraine. This invasion has led the United States and many allied countries to impose
sanctions against Russia, including the European Union implementing a ban on Russian oil. Gas prices in 2022 surged to the highest rate in about 40 years, which has significantly impacted the wallets of people around the world. The TitleMax team took a look at
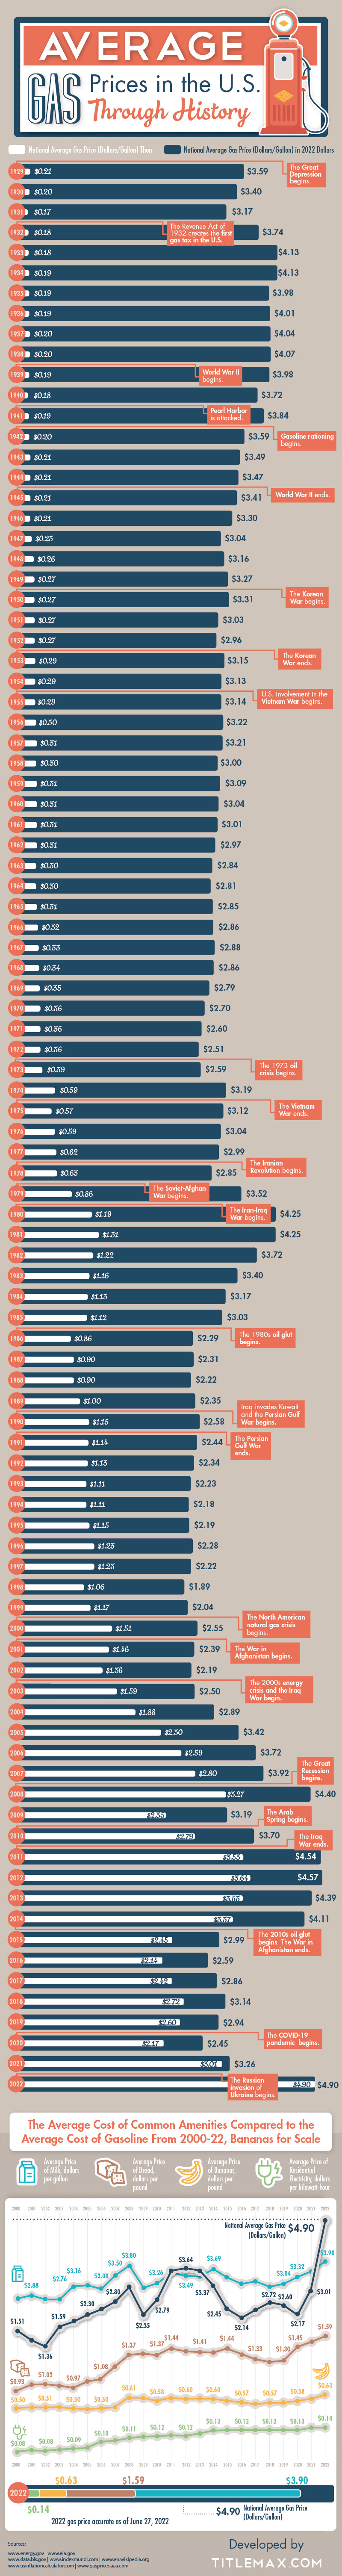
the gas price history of the United States to see how much a gallon of gas cost through the years as well as how much it would cost today accounting for inflation.
Bad Prices Arising
The most famous and impactful shock to the oil economy that’s often spoken about is the energy crisis of the 1970s. OAPEC (the Organization of Arab Petroleum-Exporting Countries) shattered policy-makers’ assumptions about their reliance on American trade, and prices shot up from
$3 to $12 per barrel. The average American driver went from paying $0.36 per gallon at the pump in 1970 (which is equal to about $2.70 per gallon in today’s dollars) to $1.19 per gallon in 1980 (which is equivalent to about $4.25 per gallon
today). In the late ’70s and early ’80s, there was a massive global recession. Unemployment spiked to 9% from 5.1% in 1975. In 1982, it reached its peak at 10.8%, the highest rate since the Great Depression. Banks and loan companies struggled to get a handle on the economy. “Reagan’s Recession” also affected other countries, like Japan, which suffered a great deal during that time and famously suffered a huge homelessness problem.
Bad Times Today
We are currently experiencing some of the highest gas prices in U.S. history, with the average gallon of gas costing $4.90. Inflation has caused a surge in pricing for many things, including gas, groceries, and travel. High gas prices have not only impacted the wallet of the average American driver
but also the truck drivers who deliver goods to towns around the country. High gas prices increase the prices of common goods that many Americans need due to transportation costs. While gas prices are currently rising, let’s not forget the very intense and rapid price increase before the 2009
recession. Even our most chaotic price jumps from past decades pale in comparison to the increases from 2002 to 2008, when gas prices climbed steadily and dramatically until the recession. While Lehman Brothers and the housing market crash were much to blame for the collapse, the spike in gas prices
didn’t help. Bread and milk experienced sharp increases in price, meaning that it was harder to feed families already in a desperate situation. In 2008, the unemployment rate jumped to 10%, almost as high as in the 1980s. The
Great Recession nearly caused the collapse of countries and almost spiraled into a massive global depression, which would’ve been much worse considering how closely world economies are now linked.
Earthquakes and Lightning
What’s important to remember is that every time there’s a sharp increase in oil prices, it also affects people’s lives. High oil prices have a negative impact on retailers, the auto industry, public transportation, grocers, employees’ raises, new jobs, unemployment, and the economy overall. High oil
prices cause chaos. But why didn’t the situation keep spiraling in 2012, when oil prices shot higher than literally ever before in the U.S.? It’s hard to say, but some things are different now. We still depend a great deal on
foreign oil every day, but now, our cars are more fuel-efficient. The current goal is to reach 40 mpg as a target fuel economy for vehicles
by 2026. Hopefully, all of this will make us less dependent on oil, so that price variations won’t cause major global collapses as in 1980 and 2008.
Trouble on the Way
Are we breaking the ties of oil prices on the U.S economy? We’re not out of the woods yet. Those two tumultuous decades should’ve reformed the car and energy industries. And they have, but not quickly enough, and not in the ways we’d like. As we neared an economic crisis in 2009, oil companies
wisely scrambled for new places to find cheap gas. Rather than finding new energy sources, we’ve been getting more oil locally (which is in limited supply). The focus turned to natural gas, another limited energy source. We bailed out the car companies that had been slow to adapt and create
alternative-fuel engines. Legislation tends to be rougher on newcomers like Tesla, and renewable energy companies have been having a hard time getting funding. In the eyes of some economists, there’s a bad moon on the rise.
Gas Prices in the U.S. Throughout History
| Year | National Average Gas Price (Dollars/Gallon) Then | National Average Gas Price (Dollars/Gallon) In 2022 Dollars | Notes |
|---|---|---|---|
| 1929 | $0.21 | $3.59 | The Great Depression begins. |
| 1930 | $0.20 | $3.40 | |
| 1931 | $0.17 | $3.17 | |
| 1932 | $0.18 | $3.74 | Revenue Act of 1932 creates the first gas tax in the U.S. |
| 1933 | $0.18 | $4.13 | |
| 1934 | $0.19 | $4.13 | |
| 1935 | $0.19 | $3.98 | |
| 1936 | $0.19 | $4.01 | |
| 1937 | $0.20 | $4.04 | |
| 1938 | $0.20 | $4.07 | |
| 1939 | $0.19 | $3.98 | World War II begins. |
| 1940 | $0.18 | $3.72 | |
| 1941 | $0.19 | $3.84 | Pearl Harbor is attacked. |
| 1942 | $0.20 | $3.59 | Gasoline rationing begins. |
| 1943 | $0.21 | $3.49 | |
| 1944 | $0.21 | $3.47 | |
| 1945 | $0.21 | $3.41 | World War II ends. |
| 1946 | $0.21 | $3.30 | |
| 1947 | $0.23 | $3.04 | |
| 1948 | $0.26 | $3.16 | |
| 1949 | $0.27 | $3.27 | |
| 1950 | $0.27 | $3.31 | The Korean War begins. |
| 1951 | $0.27 | $3.03 | |
| 1952 | $0.27 | $2.96 | |
| 1953 | $0.29 | $3.15 | The Korean War ends. |
| 1954 | $0.29 | $3.13 | |
| 1955 | $0.29 | $3.14 | U.S. involvement in the Vietnam War begins. |
| 1956 | $0.30 | $3.22 | |
| 1957 | $0.31 | $3.21 | |
| 1958 | $0.30 | $3.00 | |
| 1959 | $0.31 | $3.09 | |
| 1960 | $0.31 | $3.04 | |
| 1961 | $0.31 | $3.01 | |
| 1962 | $0.31 | $2.97 | |
| 1963 | $0.30 | $2.84 | |
| 1964 | $0.30 | $2.81 | |
| 1965 | $0.31 | $2.85 | |
| 1966 | $0.32 | $2.86 | |
| 1967 | $0.33 | $2.88 | |
| 1968 | $0.34 | $2.86 | |
| 1969 | $0.35 | $2.79 | |
| 1970 | $0.36 | $2.70 | |
| 1971 | $0.36 | $2.60 | |
| 1972 | $0.36 | $2.51 | |
| 1973 | $0.39 | $2.59 | The 1973 oil crisis begins. |
| 1974 | $0.53 | $3.19 | |
| 1975 | $0.57 | $3.12 | The Vietnam War ends. |
| 1976 | $0.59 | $3.04 | |
| 1977 | $0.62 | $2.99 | |
| 1978 | $0.63 | $2.85 | The Iranian Revolution begins. |
| 1979 | $0.86 | $3.52 | The Soviet-Afghan War begins. |
| 1980 | $1.19 | $4.25 | The Iran-Iraq War begins. |
| 1981 | $1.31 | $4.25 | |
| 1982 | $1.22 | $3.72 | |
| 1983 | $1.16 | $3.40 | |
| 1984 | $1.13 | $3.17 | |
| 1985 | $1.12 | $3.03 | |
| 1986 | $0.86 | $2.29 | The 1980s oil glut begins. |
| 1987 | $0.90 | $2.31 | |
| 1988 | $0.90 | $2.22 | |
| 1989 | $1.00 | $2.35 | |
| 1990 | $1.15 | $2.58 | Iraq invades Kuwait and the Persian Gulf War begins. |
| 1991 | $1.14 | $2.44 | The Persian Gulf War ends. |
| 1992 | $1.13 | $2.34 | |
| 1993 | $1.11 | $2.23 | |
| 1994 | $1.11 | $2.18 | |
| 1995 | $1.15 | $2.19 | |
| 1996 | $1.23 | $2.28 | |
| 1997 | $1.23 | $2.22 | |
| 1998 | $1.06 | $1.89 | |
| 1999 | $1.17 | $2.04 | |
| 2000 | $1.51 | $2.55 | The North American natural gas crisis begins. |
| 2001 | $1.46 | $2.39 | The War in Afghanistan begins. |
| 2002 | $1.36 | $2.19 | |
| 2003 | $1.59 | $2.50 | The 2000s energy crisis and the Iraq War begin. |
| 2004 | $1.88 | $2.89 | |
| 2005 | $2.30 | $3.42 | |
| 2006 | $2.59 | $3.72 | |
| 2007 | $2.80 | $3.92 | |
| 2008 | $3.27 | $4.40 | The Great Recession begins. |
| 2009 | $2.35 | $3.19 | |
| 2010 | $2.79 | $3.70 | The Arab Spring begins. |
| 2011 | $3.53 | $4.54 | The Iraq War ends. |
| 2012 | $3.64 | $4.57 | |
| 2013 | $3.53 | $4.39 | |
| 2014 | $3.37 | $4.11 | The 2010s oil glut begins. The War in Afghanistan ends. |
| 2015 | $2.45 | $2.99 | |
| 2016 | $2.14 | $2.59 | |
| 2017 | $2.42 | $2.86 | |
| 2018 | $2.72 | $3.14 | |
| 2019 | $2.60 | $2.94 | |
| 2020 | $2.17 | $2.45 | The COVID-19 pandemic begins. |
| 2021 | $3.01 | $3.26 | |
| 2022 | $4.90 | $4.90 | The Russian invasion of Ukraine begins. |
Consumer Goods Price Comparisons
Price of Bread
| Year | Average Price of Bread per Pound |
| 2000 | $0.93 |
| 2001 | $1.00 |
| 2002 | $1.02 |
| 2003 | $1.00 |
| 2004 | $0.97 |
| 2005 | $1.04 |
| 2006 | $1.08 |
| 2007 | $1.21 |
| 2008 | $1.37 |
| 2009 | $1.39 |
| 2010 | $1.37 |
| 2011 | $1.44 |
| 2012 | $1.42 |
| 2013 | $1.41 |
| 2014 | $1.40 |
| 2015 | $1.44 |
| 2016 | $1.37 |
| 2017 | $1.33 |
| 2018 | $1.29 |
| 2019 | $1.30 |
| 2020 | $1.45 |
| 2021 | $1.52 |
| 2022 | $1.59 |
Price of Milk
| Year | Average Price of Milk per Gallon |
|---|---|
| 2000 | $2.78 |
| 2001 | $2.88 |
| 2002 | $2.76 |
| 2003 | $2.76 |
| 2004 | $3.16 |
| 2005 | $3.19 |
| 2006 | $3.08 |
| 2007 | $3.50 |
| 2008 | $3.80 |
| 2009 | $3.11 |
| 2010 | $3.26 |
| 2011 | $3.57 |
| 2012 | $3.49 |
| 2013 | $3.46 |
| 2014 | $3.69 |
| 2015 | $3.42 |
| 2016 | $3.20 |
| 2017 | $3.23 |
| 2018 | $2.90 |
| 2019 | $3.04 |
| 2020 | $3.32 |
| 2021 | $3.54 |
| 2022 | $3.90 |
Price of Bananas
| Year | Average Price of Bananas per Pound |
|---|---|
| 2000 | $0.50 |
| 2001 | $0.51 |
| 2002 | $0.51 |
| 2003 | $0.51 |
| 2004 | $0.50 |
| 2005 | $0.49 |
| 2006 | $0.50 |
| 2007 | $0.51 |
| 2008 | $0.61 |
| 2009 | $0.61 |
| 2010 | $0.58 |
| 2011 | $0.61 |
| 2012 | $0.60 |
| 2013 | $0.60 |
| 2014 | $0.60 |
| 2015 | $0.58 |
| 2016 | $0.57 |
| 2017 | $0.56 |
| 2018 | $0.57 |
| 2019 | $0.57 |
| 2020 | $0.58 |
| 2021 | $0.60 |
| 2022 | $0.63 |
Price of Electricity
| Year | Average Price of Residential Electricity per Kilowatt-Hour |
|---|---|
| 2000 | $0.08 |
| 2001 | $0.09 |
| 2002 | $0.08 |
| 2003 | $0.09 |
| 2004 | $0.09 |
| 2005 | $0.09 |
| 2006 | $0.10 |
| 2007 | $0.11 |
| 2008 | $0.11 |
| 2009 | $0.12 |
| 2010 | $0.12 |
| 2011 | $0.12 |
| 2012 | $0.12 |
| 2013 | $0.12 |
| 2014 | $0.13 |
| 2015 | $0.13 |
| 2016 | $0.13 |
| 2017 | $0.13 |
| 2018 | $0.13 |
| 2019 | $0.13 |
| 2020 | $0.13 |
| 2021 | $0.14 |
| 2022 | $0.14 |
If inflation has hurt your wallet and an emergency expense crops up, TitleMax offers car title loans to help ease the burden.