
Exploring the wall in marathon running
Abstract
The wall is an iconic feature of the marathon. If runners hit the wall, usually around the 30km (20mi) mark, their pace slows dramatically, leaving them to struggle to the finish-line. While the physiology of the wall is reasonably well understood – a critical combination of fatigue and a lack of available fuel as the body’s glycogen stores become depleted – its actual impact is less well studied. In this paper we present a large-scale data-driven study of how and when recreational marathon runners hit the wall. We do this by analysing the pacing patterns of almost 60,000 runners across more than 250 races. The main contributions are: (1) an operational definition of the wall by identifying its key pacing features; and (2) and analysis of hitting the wall for runners, based on their age, gender and ability, using this definition.
1Introduction
The marathon is a unique sporting event. It is enjoyed by millions around the world every year, participants and spectators alike, and remains one of the few mass-sporting events which sees recreational participants lining up alongside world-class athletes. Most large cities include a marathon as a regular calendar event and, in 2016 alone, over 500,000 US runners competed over the distance1 . Indeed, it is the distance, 26.2 miles or 42.195 kms, that singles out the marathon in the public consciousness as an especially challenging event, with the unique distinction that it still remains within the grasp of the general public. Of course, going the distance on race-day is just one part of what it means to complete a marathon, and the true measure of the task must include the months of conditioning, training and preparation required for someone to safely line up at the start-line.
Aside from the distance component perhaps the most iconic feature of the marathon is the phenomenon of ’hitting the wall’. This is a familiar experience for many runners during their marathon history, and it refers to a sudden and dramatic slowing of pace in the latter stages of the race, typically from the 30km/20mi mark. The cause of this slowdown is not simply a matter of fatigue, although this surely plays a role, and the conventional wisdom is that the phenomenon is generally associated with a depletion of the body’s glycogen stores, resulting in the runner exhausting their fuel supply. Runners usually hit the wall because of a combination of factors, from weather conditions on the day to poor pacing decisions to an inadequate fuelling strategy. The net effect is the same, however, as even the swiftest runners can slow to a shuffling gait if they hit the wall hard enough. Despite the iconic nature of the wall the precise contours of the phenomenon remain somewhat ill-defined. According to some research, over 40% of marathon runners experience hitting the wall in any given race (Latta 2003) but there is no agreed operational definition of the wall per se, rather it remains a “you will know it when you see it” type of phenomenon.
The core objective of this work is to develop a data-driven definition of the wall for recreational marathon runners based on their pacing profiles. This definition will be based on identifying significant changes in pace (slow-downs) during the second-half of the marathon. To do this we will use machine learning techniques to detect the pacing patterns that exist in a large-scale dataset of approximately 60,000 race profiles, to determine key features of the wall, such as the relative slow-down experienced, the duration of this slow-down, its onset-point, etc. This definition will allow us to more reliably identify runners who hit the wall and how ‘hard’ they hit it as the basis for a more detailed analysis of the rate at which runners hit the wall in a number of big-city marathon races.
The remainder of this paper is organised as follows. We first present some background literature on the phenomenon of hitting the wall in Section 2. In Section 3 we introduce our dataset and present the methods used to identify runners that exhibit a significant slowdown, alongside our definition of the wall based on these methods(3.3.3). We will then use this definition in Section 4 to analyse the wall with respect to age(4.2), gender(4.3), ability(4.4) and course topology(4.5).
2Background
While not every runner experiences hitting the wall, it is a risk that most runners have to contend with at some point in their marathon history. Intuitively we can understand that when a runner hits the wall their pace will deteriorate suddenly and significantly, usually in the later stages of the race, and they may or may not recover by race-end. However, a precise definition of the wall remains elusive despite a good understanding of the physiological causes of the wall, see Rapoport (2010).
One early study surveyed 363 middle-aged, recreational, first-time marathon runners to assess their reasons for attempting the marathon, their perceived outcomes from the event, and their experiences during the race (Summers et al. 1982). 56% of respondents reported hitting the wall with most (73%) experiencing it after the 30km mark. Other work has focused on the relationship between a recreational runner’s cognitive orientation and hitting the wall (Stevinson and Biddle 1998) in a study of 66 participants (56 men and 10 women) at the 1996 London marathon, including 35 marathon first-timers. This time 53% - more men than women - reported hitting the wall and adopted a cognitive orientation of "inward distraction" and a sense of internal disassociation as they attempted to distract themselves from it. While neither Summers et al. (1982), nor Stevinson and Biddle (1998) explored the nature of the wall further, both studies provide a useful baseline rate for the frequency with which runners may hit the wall during the marathon, although such high rates may suggest that at least some runners conflate normal fatigue with hitting the wall.
Recent research by Buman et al. (2008a) presents a more in-depth study of the phenomenological characteristics of the wall, by surveying 315 runners to assess whether they believed they had hit the wall and, if so, their perception of 24 different characteristics linked to the experience. 43% of participants reported hitting the wall – again more men than women – and the study concluded that four characteristics (generalised fatigue, unintentionally slowing pace, desire to walk, and shifting focus to survival) were particularly salient features of the wall. Somewhat surprisingly, only 70% of those who reported hitting the wall also reported an unintentional slow-down in pace. This supports the idea that self-reported evaluations may exaggerate the true rates at which runners hit the wall as at least some runners naturally conflate feelings of fatigue and discomfort in the later stages of the race with hitting the wall.
Gender and experience are also important factors when it comes to hitting the wall. Female runners experience the wall less frequently (Latta 2003; Buman et al. 2008a), and research has found that male runners are 1.82 times more likely to experience hitting the wall. Some research suggests that women are physiologically better suited to distance running (Deaner et al. 2015; Vickers and Vertosick 2016; Beneke et al. 2005) while other research suggests that men may adopt a more ‘bullish’ approach to marathons even in the face of a training deficit (Hubble and Zhao 2016).
Recreational runners appear to be more likely to hit the wall than elites (Morgan 1978), which is consistent with the role that experience plays in hitting the wall; experienced runners are less likely to hit the wall according to Buman et al. (2008a). This is also consistent with research that reports an inverse relationship between training characteristics (volume and frequency) and the tendency to hit the wall (Buman et al. 2008a; Buman et al. 2009). For example, the absence of long-runs (>20km) during training is a strong indicator that a runner will hit the wall (Grant et al. 1984).
Buman et al. (2009) found that runners who expected to hit the wall were more likely to do so during the race. The result is somewhat counter intuitive as such runners are expected to pace themselves and take on fuel more carefully during the race. These actions should make them less likely to hit the wall. On the other hand, it is possible that declaring an expectation to hit the wall ahead of a race may simply be evidence that the runners are aware of their own lack of preparedness or a tendency for sub-optimal pacing.
Strong correlations between hitting the wall and marathon performance have been found in numerous studies (Hubble and Zhao 2016; Santos-Lozano et al. 2014; March et al. 2011). More recent research has investigated whether fast starts and hitting the wall were the cause of poor finish times. In one large scale study of over 1.7 million recreational marathon finishers Smyth (2018) shows that fast starts having a negative impact on finish times across different ability bands. This demonstrates that the correlation between hitting the wall and slower finish times is not purely due to the lack of preparedness of recreational runners compared to their better-trained counterparts. The same study also investigated the effect of hitting the wall on personal best finish times, with less than 10% of runners capable of posting a personal best when hitting the wall. The author argues that these two findings support a causal relationship between poor pacing and marathon performance. While the exact cost of hitting the wall, compared to a slower starting pace sustained throughout the race, on a runner’s finish time is yet to be quantified, it seems clear that hitting the wall is sub-optimal for marathon performance and should therefore be avoided by runners aiming to post a fast time.
When hitting the wall, runners reduce their oxygen intake from 70-85% of V02max (their maximum possible oxygen intake) to between 40-60% of V02max (Coyle 2007). This signals a significant reduction in exertion, which in turn leads to the slowdown that accompanies hitting the wall. However, the precise nature of the slowdown is less clear, particularly when attempting to separate those runners who truly hit the wall from those who are simply fatigued. Typically, in pacing studies, any pace variation within 10% of the mean race pace is considered to be ‘maintaining’ pace. A greater slowdown than this may signal that a runner is experiencing a significant degree of discomfort and fatigue. Therefore, we might expect that when runners hit the wall their pace should slow by more than 10%.
3Towards a data-driven definition of the wall
The main aim of this work is to develop a useful operational definition of what it means to hit the wall. Our goal is to use only the runner’s pacing profile during the race to determine whether they hit the wall. This definition will primarily look for runners who exhibit a sudden and sustained slow-down late in the marathon. The precise parameters of this slow-down are not well understood. There is a general acceptance that those runners who hit the wall slowdown significantly, but by how much compared to their earlier pace? And for how long? As per the related work, we understand that runners tend to hit the wall late in the race, somewhere around the 30km mark, but there is considerable variance in this across runners. Is there a specific point in the race after which slowdowns are likely to be the result of hitting the wall, whereas before this point they are likely due to other factors (injury, under-training, etc.)?
Our approach to developing this definition is two-fold. First, we apply clustering techniques to the pacing profiles of runners in order to separate them into two primary clusters, which we subsequently validate as roughly corresponding to a cluster of runners who hit the wall (W) and a cluster of runners who run a more regularly paced race (R). Then, using a number of population-based and race-based features, which are commonly associated with the wall (the expected percentage of runners hitting the wall, the degree slowdown, start of slowdown etc.), we produce a refined definition of the wall by optimising the separation of these clusters using these features. In the end this provides a core set of features to distinguish between the runners in W and R and so serve as an operational definition of the wall.
3.1Dataset
The dataset used in this study comprises over 60,000 public marathon race records covering 274 different marathon races in the period 2014 to 2017, utilising only the results of runners who have both recorded pacing data from their race and who have made this data publicly available. The GPS trace associated with each race record is processed to provide timing information at 1km intervals, and these split-times (kms/min) are converted into pacing values (mins/km) as the pacing profile for a particular runner.
The resulting records are further filtered to eliminate non-runners, that is, runners whose pace suggests the runner walked or run-walked the marathon. Such records provide little insight into the wall. The remaining 59,279 records are truncated to exactly 42km (see Equation 1), to eliminate post-race GPS over-runs and to ensure all intervals of the pacing profiles are consistent in length.
(1)
Table 1
Mean statistics of the marathon database extracted from public sources
| Number of Marathons | 274 |
| Date Range | 2014-2017 |
| Number of Finishers | 59279 |
| Finish Time (mins) | 226±38 |
| Pacing Variation | 8.1±4.8 |
| Age | 39.4±8.1 |
| Gender Split (male) | 86% |
(2)
(3)
3.2Clustering pacing profiles to identify the wall
A basic assumption for this work is that clustering runners based on their relative pacing profiles will reveal at least two distinct clusters, which can be used as a starting point for understanding the nature of the wall as it relates to the pacing of runners. In preparation for clustering we need a way to compare the pacing profiles of two runners so that we can generate a distance/similarity score between pairs of profiles for use during clustering. To do this we treat a relative pacing profile as a time-series of length 42 and apply Dynamic Time Warping (DTW) (M?ller 2007) over the entire pacing profile to compute the similarity between pairs of profiles to generate a pairwise distance/similarity matrix.
DTW is used to measure similarity between temporal sequences, which may vary in speed, and is a technique often used in speech recognition (Sakoe and Chiba 1978). It is used to find an optimal alignment between two time-series without assuming the underlying process happened at the same speed or for the same amount of time. This is useful for our approach as similar phenomena in a runner’s pacing profile may happen earlier or later in a race, or may vary in their duration. DTW allows us to capture these phenomena by looking at the pacing profiles independently of variations in the time domain, essentially allowing us to compare the similarity of the shapes of two pacing profiles and capturing patterns present in each (Berndt and Clifford 1994). This feature of DTW makes it preferable to other distance metrics, such as Euclidean distance, which will would consider two similar pacing profiles to be different if the same phenomena where to happen out of phase.
During this research we evaluated a number of different clustering techniques, including K-Means clustering (MacQueen 1967), Spectral Clustering (Ng et al. 2002), DBScan (Ester et al. 1996), Hierarchical Clustering (Ward Jr 1963), and Affinity Propagation (Frey and Dueck 2007) in terms of their ability to segment runners into W and R clusters; those who hit the wall and regular runners. In each case, while the resulting clusters tended to differ in their details, it was possible to clearly identify groups of runners who appeared to be hitting the wall (significant slowdown late in the race) and groups of runners who appears to avoid the wall (more consistent pacing throughout the race). Due to the strongest coherence with previous research into the wall, we now focus on the clusters produced by K-Means clustering (K = 2).
Figure 1 shows the relative pacing profile of the cluster centres for the W and R clusters found by K-means (K = 2), as further evidence that the clustering process is able to separate runners, based on late-stage pacing changes, which are indicative of hitting the wall. For example, we can see how the starting pace for the W centroid is 5% -10% faster than the mean race pace, compared to the centroid of the R cluster, which is only about 3% faster than MRP. Even though both clusters show a gradual slowing of pace as the race unfolds, it is clear that the W cluster exhibits a much more dramatic slowdown in the second half of the race, which runners complete about 20% slower than their MRP, compared to the R cluster, where runners complete the second half only about 5% slower.
Fig. 1
Cluster Centers of K-means clustering (K=2) on the race pacing profiles.
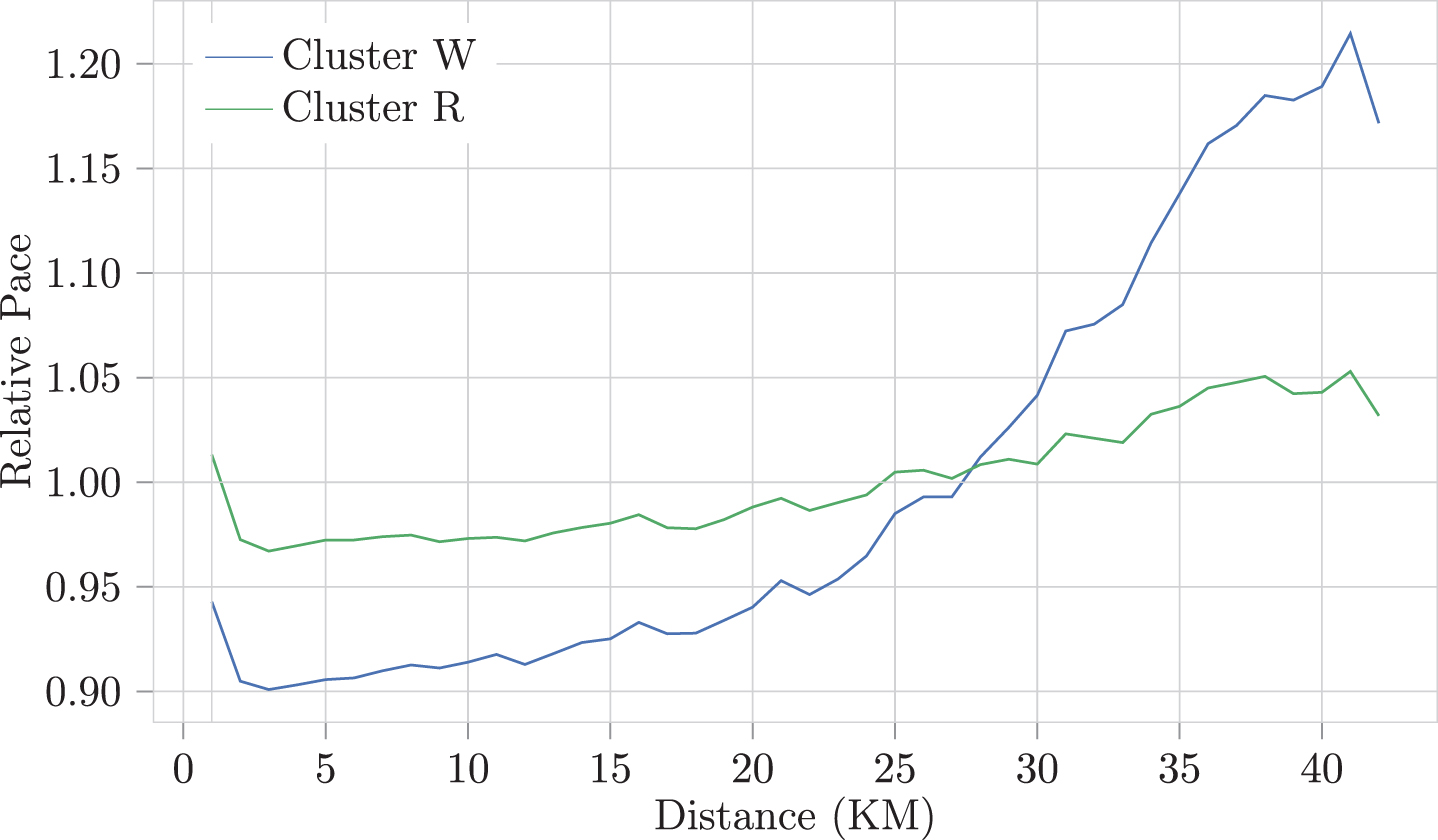
The K-Means W cluster contains 36% of runners, somewhat less than the 43% -54% of runners that some studies have reported to have hit the wall. This is not so surprising given some of the concerns about self-reporting mentioned in the previous section, which suggest the incidence of hitting the wall may be over-reported. In other respects, the properties of the runners in W are in broad agreement those reported by past research, including:
• The average point at which a significant and sustained slowdown tends to occur for runners in W is 33km which corresponds closely to the traditional view of when runners tend to hit the wall (Buman et al. 2008a).
• In W there are a greater proportion of recreational runners, compared to elites (40% vs 17% respectively), which is in agreement with past research (Buman et al. 2008b). Moreover, recreational runners tend to slow by more (27% on average) than elites (20%) when they hit the wall.
• There are also proportionally more male runners in W compared with female runners, which is supported by Buman et al. (2008a).
• Of the runners in W, 47% have their first 5km as their fastest race segment, again agreeing with past research which found a strong correlation between fast-starters and those who hit the wall (Smyth 2018).
3.3Defining the wall
In the previous section we clustered runners into two groups based on their relative pacing profiles, and we proposed that these clusters roughly correspond to those runners who hit the wall (W) and those runners who do not (R). The shape of the pacing profiles for these clusters and a number of observations based on the relevant literature of the wall support this notion. This in itself does not provide an operational definition of the wall that we can use to classify unseen runners using pacing features such as the degree of slowdown or the duration of the slowdown. However, we can use these clusters to develop such a definition.
There are two steps to this. First, we will identify a set of basic wall features, that is, pacing properties that can be used to determine whether a runner hit the wall or not. Second, we will identify threshold values for these features which optimally separate runners in W from runners in R. Collectively, these threshold values will be used to determine whether an unseen runner belongs to W or R, and therefore whether they hit the wall or not.
3.3.1A model of the wall
Figure 2 illustrates our proposed model of the wall in terms of a set of core features based on the pacing profile of a runner. These features have been chosen because they are common in the literature and because they align well with intuitions about the wall. Importantly, none of these features on their own is sufficient to determine whether a runner has hit the wall, but we will show that collectively, they provide an effective definition that can be used to identify those runners who hit the wall with a high degree of accuracy.
Fig. 2
Our model of the wall is based on a number of basic features: the onset, the pace collapse, the peak, and the duration.
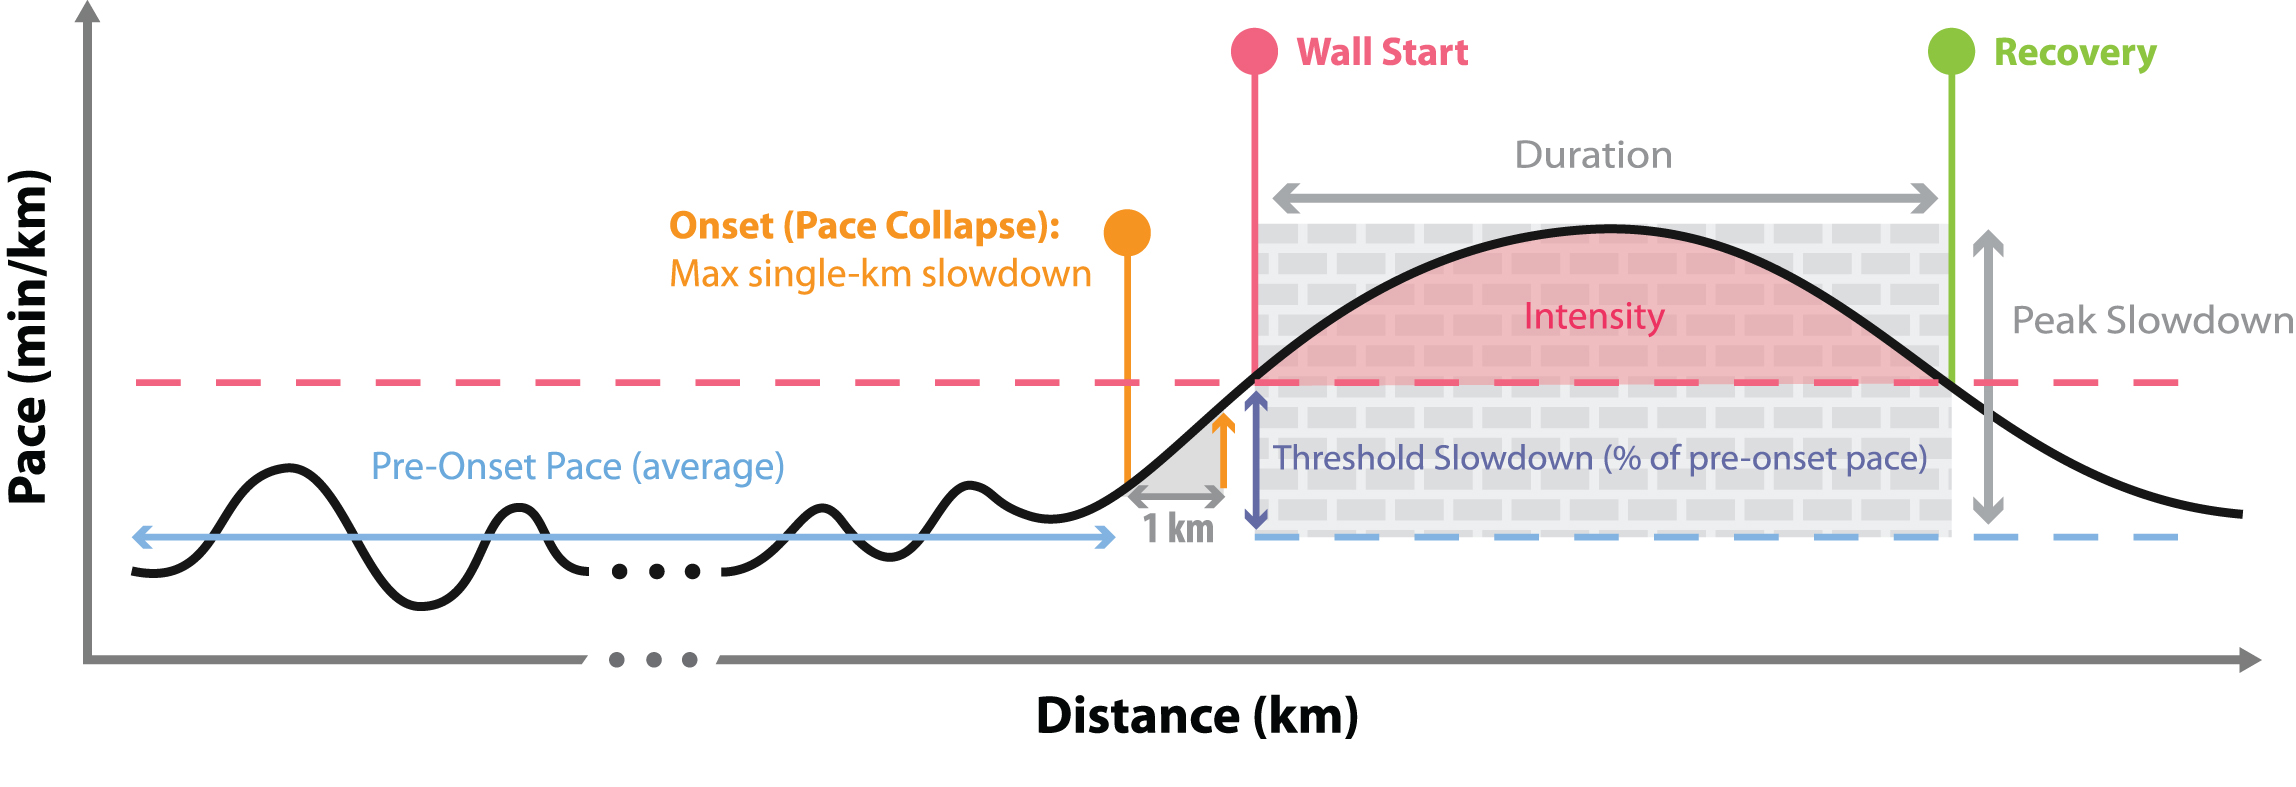
Given a runner’s pacing profile, we define the pace collapse to be the single largest 1km slowdown between successive 1km segments across the 42kms of the profile. The intuition is that the start of the wall is marked by a significant slowdown that is unusual relative to their overall pacing profile. The point in the race at which this slowdown occurs is the onset of the wall; it marks the beginning of the wall. For example, in Figure 2 the onset is marked and the pace collapse is the slope of the pacing profile at this point; there is no other point in the profile with a steeper pacing curve.
The onset is also important because it establishes the end-point of the runner’s regular pacing. Up until the onset point, while the runner’s pace will vary, it tends to be more stable when compared to their post-onset pace, if they hit the wall. Thus, the earlier pre-onset pace provides a useful baseline pace against which to judge the runners post-onset pace. Another important feature of the wall is that post-onset the runner pace should exceed some slowdown threshold relative to the pre-onset pace. Finally, to hit the wall the runner also needs to experience this degree of slowdown for some minimum distance. This is referred to as the duration of the wall.
The point at which a runner exceeds the slowdown threshold (after the onset) is designated the start of the wall and the wall duration is measured from this point. A runner may later recover from hitting the wall, at least somewhat, if their pace improves sufficiently so that it no longer exceeds the slowdown threshold. If this happens then we say the runner has recovered and the duration of the wall is the distance between the start of the wall and the recovery point; if they do not recover then the duration of the wall continues to the end of the race.
(4)
(5)
(6)
(7)
(8)
3.3.2Feature distributions
The features above represent the major landmarks in the pacing profile of a runner who hits the wall. Figure 3 shows the distributions of their values among the runners in the W and R clusters. In each distribution there is at least some overlap between the W and R clusters, signalling that this is no single feature that is sufficient to separate the runners in these clusters.
For example, in Figure 3 we can see how the pace collapse for W shows a modal pace collapse of about 0.175 (a maximum inter-km slowdown of 17.5%) versus approximately 0.075 for R runners; in other words, the sudden slow-down experienced by most W runners is much greater than that experienced by most in R. At the same time there are some W runners with lower pace collapse values, which overlap with some R runners who have higher pace collapse values.
The overlap between W and R runners is even greater when we look at the onset of the wall in Figure 3. However, we can see how, for W runners, the onset is skewed towards the later stages of the race, after the 30km mark. Despite this overlap we still consider onset an important discriminatory feature as the wall is known to occur late in the race and an early onset in W may be indicative of non-wall phenomenon in the marathon, such as injury.
Fig. 3
Distributions in Onset, Peak, Pace Collapse and Distance of the wall for runners in the wall and regular clusters.
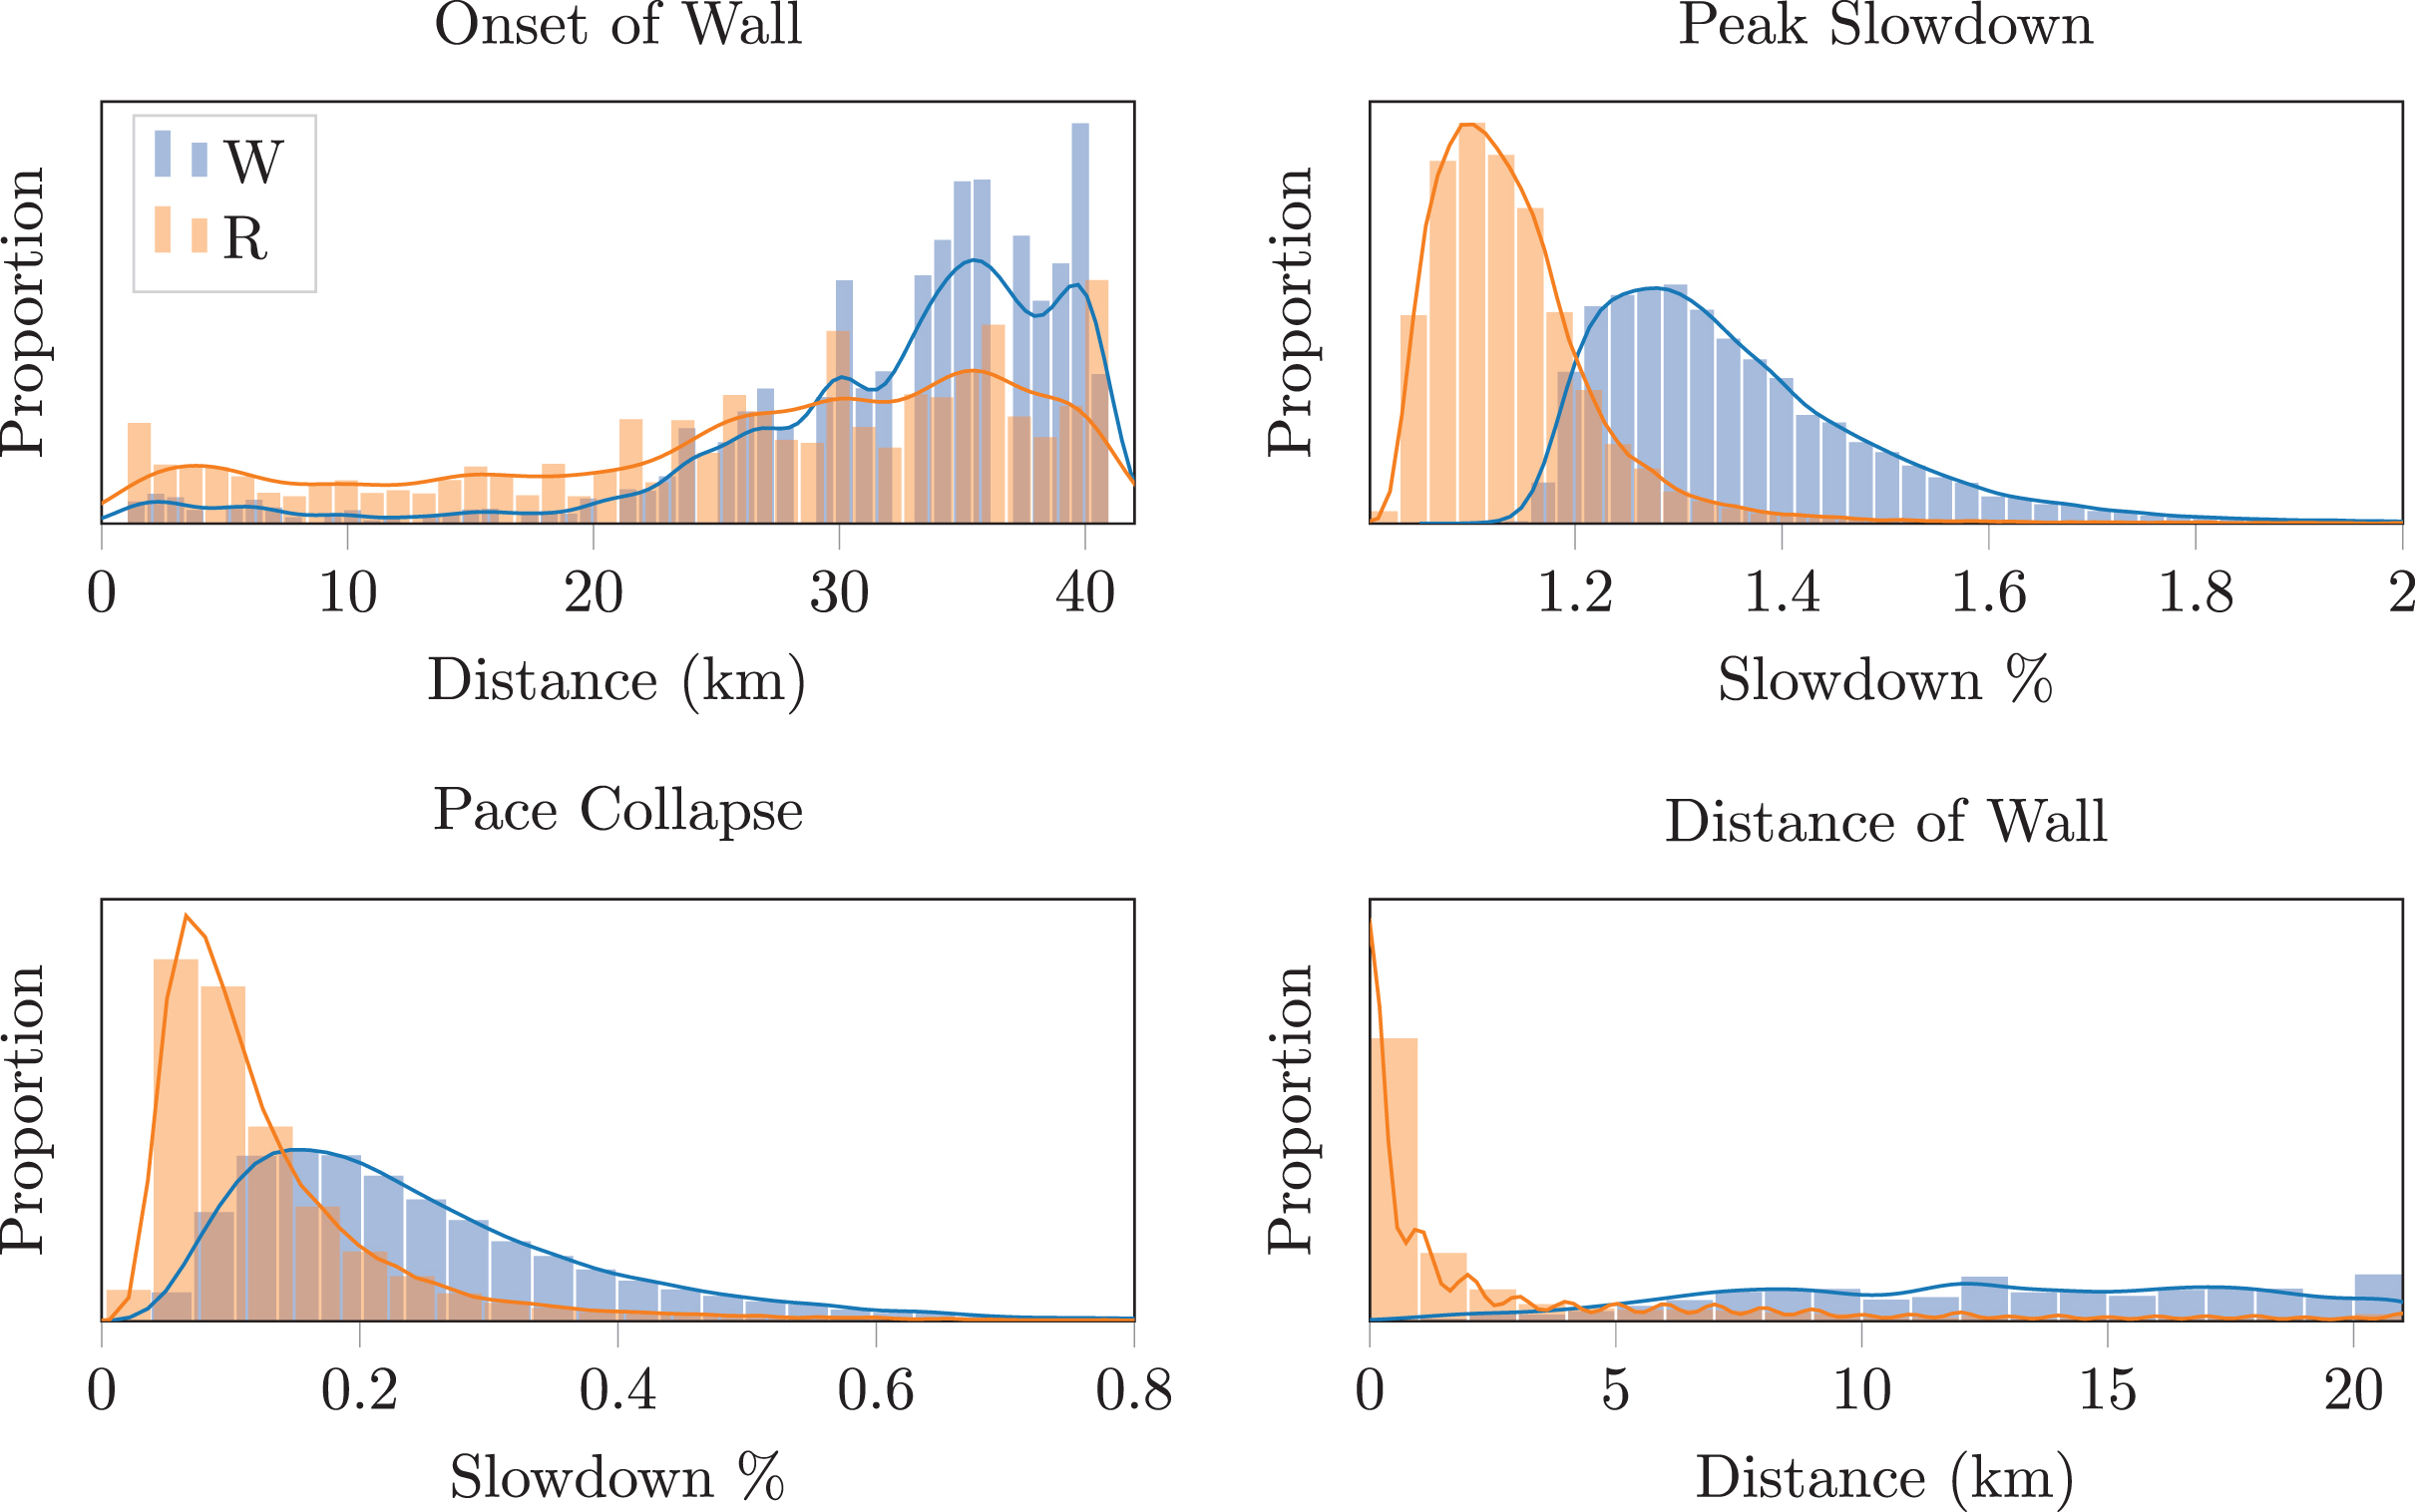
The peak slowdown, the maximum slowdown exhibited relative to pre-onset pace, serves as an approximation of the slowdown threshold in these distributions. For R runners, the most frequent peak slow down is 10%, while it is closer to 30% for runners in W. While this feature demonstrates strong discriminatory power between R and W some overlap remains. An even more discriminating feature is the distance of the wall, with R exceeding a slowdown threshold for very short periods (<3km) compared to longer slowdowns for W.
This ability of individual features to separately discriminate between W and R clusters amounts to an estimate of how important the feature is when it comes to defining these clusters. By building a decision tree model to classify a pacing profile as either in R or W we are able to extract the feature importance values of each of the above features. Table 2 shows these feature importance values and we can see how features such as the duration and peak slowdown are more important than onset or pace collapse, but we also see that all have some ability to distinguish between R and W.
Table 2
Relative importance of each of the features in the definition for identifying the wall.
| Feature | Feature Importance |
| Onset | 0.07 |
| Peak | 0.47 |
| Pace Collapse | 0.17 |
| Distance | 0.29 |
3.3.3Refining the wall
Of course determining a set of wall-defining features is not sufficient in and of itself when it comes to completing an operational definition of the wall. The question remains as to what combination of features and values can be used to define when a runner truly hits the wall. Given this information we can define a decision function which, given a runner’s pacing profile, will determine whether they have hit the wall or not.
Determining the precise form of this function is non-trivial because of the lack of an actual ground-truth for the wall; we only have the pacing profiles of the runners. However, given that our W and R clusters appear to provide a reasonable proxy for runners that do and do not hit the wall we can use them as a ground-truth and treat the search for a set of wall-defining features as an optimisation problem. In other words, we will try to find a set of values for each of the above features which maximises the fitness defined in Equation 9.
(9)
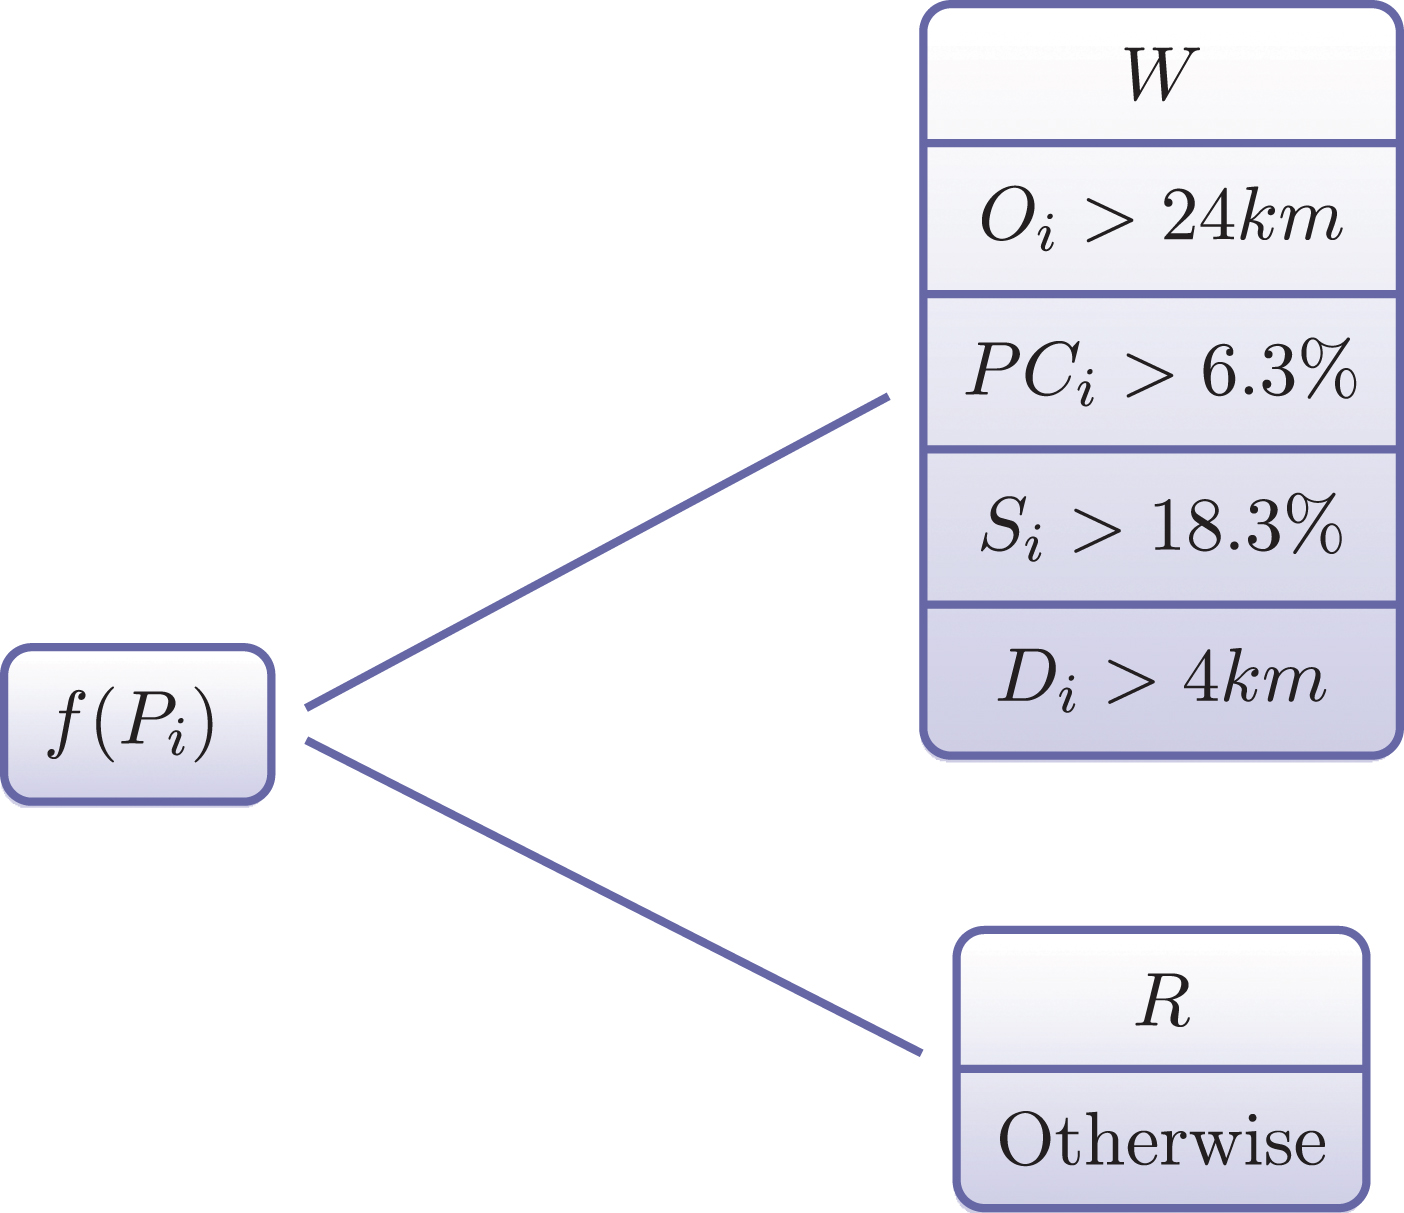
After performing the grid search of the feature space we have determined the decision function to be as shown in Fig 4.
Fig. 4
A scenario tree representing when to classify a pacing profile as hitting the wall (W) or not hitting the wall (R) based on our representative features: Onset, Pace Collapse, Slowdown, and Distance.
3.3.4Discussion
It is useful to summarise our approach so far. The objective has been to construct a feature-based definition of hitting the wall, which can be applied to the pacing profiles of marathon runners. In the absence of a ground-truth we applied K-Means clustering to the pacing profiles of runners to identify two major clusters. We confirmed that the clusters separate runners based on those who suffered from a wall-like slowdown late in the race from those who did not. Next, we proposed a model of the wall based on a set of landmark pacing features and using a grid-search of the feature space and the clusters as proxies for a ground-truth, we were able to identify a set of feature thresholds that could be used to maximally reproduce the cluster separation.
The two approaches, clustering and classification differ slightly in their results. Some runners in Cluster W are classified as a regular runners by our feature-based definition. This is due to the fact that time series (and therefore our race profiles) cannot be described fully using discrete features. This is a common issue in feature engineering of time series. However, we consider the feature-based classification adequate to our needs and preferable to using the clustering models because (a) the feature-based model has a high level of accuracy in identifying runners from Cluster W (86.4%) and identifying runners from Cluster R (90.4%) suggesting the feature-based definition is performing well against the proxy for a ground-truth that the clusters represent, (b) using a feature-based definition is more intuitively understood by runners than comparing similarity between their run with the two cluster centroids, and (c) the use of a feature based definition eases implementation and understanding in future work rather than needing to provide cluster centres for comparison. We do not consider these misclassifications to be an issue. The clustering method used considers similarity over the entire race profile. It is therefore likely that some of the classification errors from our feature-based definition are caused by similarities between profiles before or after the occurrence of the wall as the feature-based definition considers only features associated with hitting the wall. In conclusion, while the feature-based definition may not give a complete description of the differences between the W and R clusters, it adequately describes the differences at the point of the wall with high accuracy, and the features used allow us to explain the phenomena of the wall in more comprehensible terms.
4Discovering the wall
Using the feature-based definition of the wall developed above, we now look at how the wall is experienced by runners in the marathon. In this section we will also investigate the effect of age, gender, ability and course topology on both runner’s chances of hitting the wall and the effect these have on their experience of the wall.
4.1Average experiences
On average 31.6% of marathons result in hitting the wall. While lower than the 43% reported in the literature (Buman et al. 2008a), this difference can be explained by the aforementioned confirmation bias. These runners experience the wall at a point strongly clustered around 32.8km into the race, and the wall is experienced for an average of 11.8km. The peak slowdown is an average of 44.8%. This combined with a mean pace collapse of 26% shows how sudden the onset of the wall is during a race, and how devastating to a race finish time it can be. However, 32% of all runners that hit the wall manage to bring their slowdown back below the 18.3% slowdown threshold of hitting the wall. This high rate of recovery suggests that the wall does not equate to complete physical exhaustion. There appears to also be a psychological aspect with runners able to find the motivation to recover from the wall when the finish line is in sight. This sudden increase in pace at the end of the race can be clearly seen in Figure 1 and confirms research which suggests that runners change pace based on how they are feeling at a certain moment and how much of the race is left (Buman et al. 2009). This reinforces the observation that wall is likely not caused purely by physical exhaustion, but also by a belief in the athlete that they are feeling tired and should slow down to survive the race.
4.2With age comes wisdom
We now investigate the effect of age on hitting the wall in the marathon. In order to do this we look at the rate of incidence at different ages alongside the distance of the wall and the percentage of runners at each age that recover. We also introduce the notion of the intensity of the wall. The intensity is essentially a measure of how difficult or limiting the wall was in the marathon. Rather than looking at the peak slow down of a runner we recognise that a large slowdown over a short distance has a similar effect on marathon time to a lesser slowdown maintained over a greater distance. Intensity therefore becomes a way of comparing the magnitude of different runners’ wall experiences by looking at the supra-wall-threshold pace exhibited for the duration of the wall. The intensity of the wall is defined according to Equation 10.
(10)
Age and experience seem to bring about greater insight into the body’s performance limits. Older runners tend to hit the wall less frequently and for a shorter distance than younger runners. They also tend to recover from the wall more frequently. Similarly, the intensity of the wall reduces as runners get older. These reductions can be seen in Figure 5. The reasons behind this reduction are two fold; older runners are likely more experienced and thus better able to pace their race without running out of energy. It is also likely they are better capable of understanding the physiological effects on their bodies mid-race without falling into the psychological trap of thinking they need to slow down.
Fig. 5
Plots of hitting the wall frequency, intensity, distance and recoveries against age and gender (Blue representing male, green female). The points represent the average values of binned ages, whilst the shaded area shows the confidence interval of a regression through the plot.
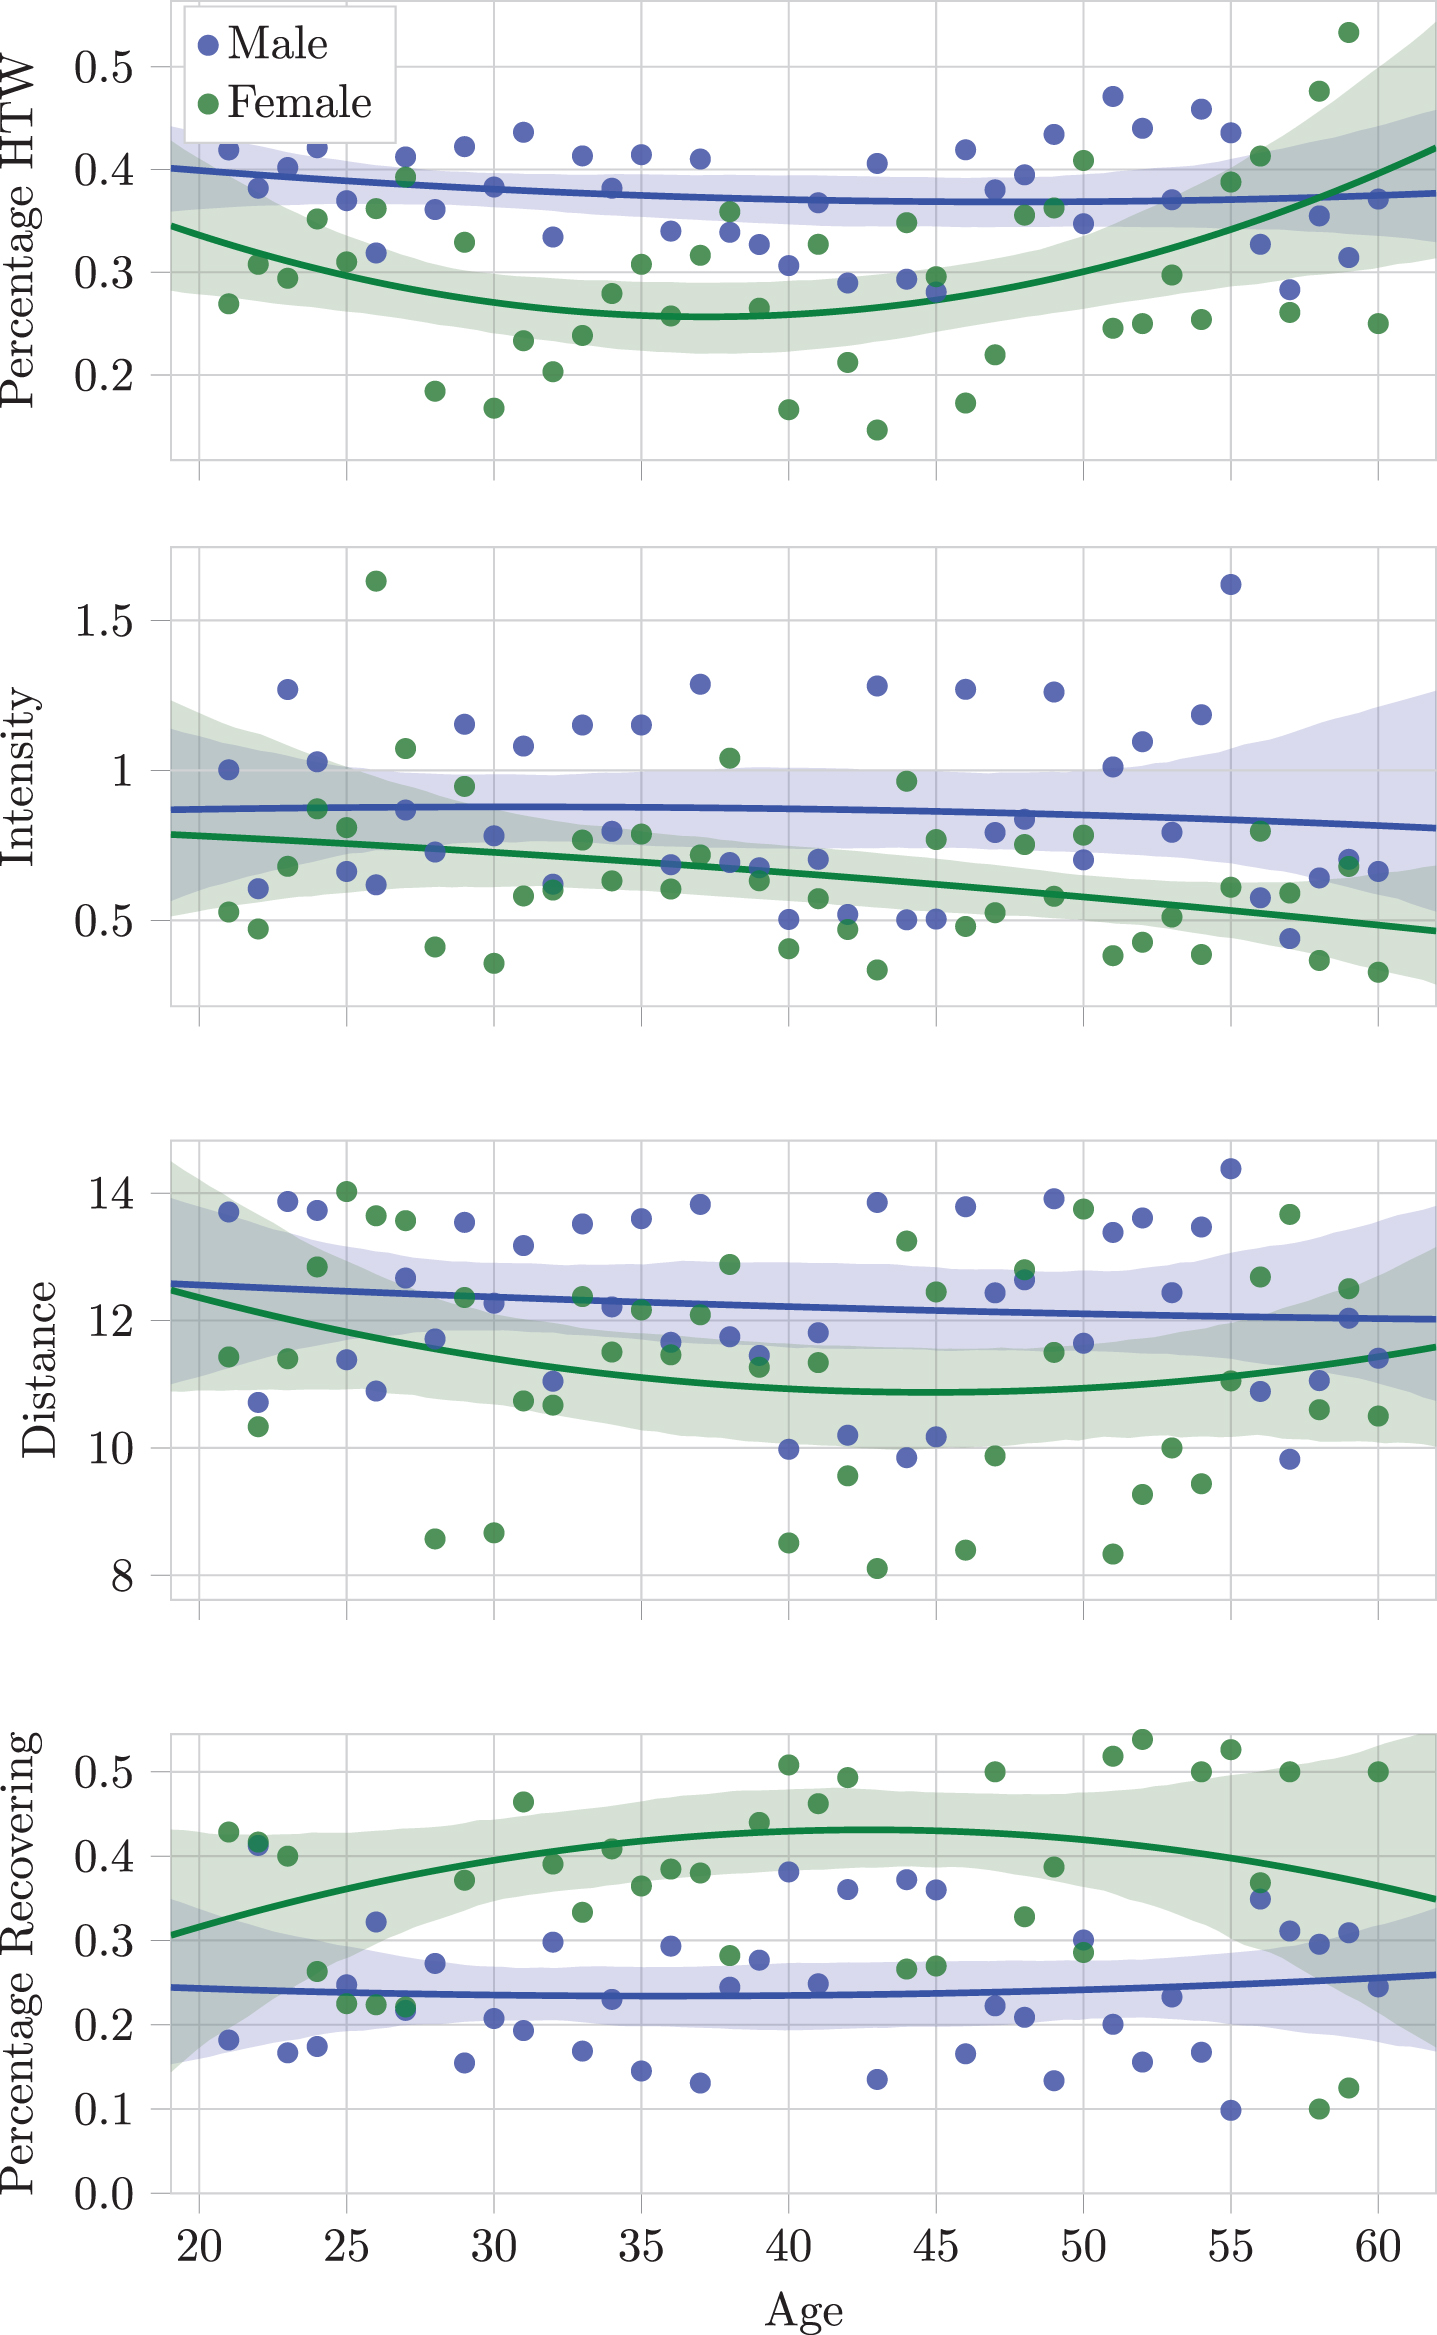
Figure 5 also shows that from a certain age the frequency, distance and intensity of the wall begins to increase again. This is likely due to the age related decline in peak performance. As runners age they are no longer capable of maintaining the same speeds as at a younger age. Therefore it is likely that a runner is targeting a time they have previously achieved but are no longer capable of and are therefore running out of energy and hitting the wall.
4.3The effect of gender
As Figure 5 demonstrates females hit the wall less often and with less intensity than their male counterparts. Females who hit the wall are also more likely to recover, compared to males.
There are physical and psychological reasons for this. Research has demonstrated that women may be more suited to various aspects of distance running (Beneke et al. 2005) because they are able to run aerobically at a higher percentage of maximum oxygen uptake (Ilhan et al. 2004), the have a greater utilisation of stored glycogen (Ilhan et al. 2004), and the demonstrate better pain management (Riddell et al. 2003) than their male counterparts. These features go some way to explaining why females exhibit a greater penchant for pacing their races and are less likely to hit the wall.
The distribution of gender also suggests a reason for this lack of incidence amongst females. Only around 15% of the marathons in our dataset were run by females. The females that do enter the marathon may therefore skew towards those that take the marathon very seriously and thus enter the race with the sufficient training and preparation required to avoid hitting the wall. Men, on the other hand, may be more likely to run the race out of an abundance of bravado (Hubble and Zhao 2016). A lack of preparation is likely to lead to a lack of physical stamina and a lack of experience with distance running. This may lead to some male runners running times that are not physically achievable or experiencing certain phenomena associated with distance running for the first time during a race, rather than having gained experience of it during training. This perhaps leads to a form of panic, meaning male runners may feel the need to slow down due to unfamiliarity rather than through any physical necessity. If females are better prepared they may head into the race with a better understanding of what their body is capable of and a greater familiarity of the challenges associated with distance running. They may therefore be capable of choosing a maintainable pace for their abilities and are therefore less likely to hit the wall than a less prepared athlete.
4.4Finish-Time Correlation
The graphs pictured in Figure 6 show the relationship between the wall and finish times. The rate of incidence demonstrates a correlation with finish time, however it would be disingenuous to suggest this relates to some form of relationship between hitting the wall and a runner’s ability. This is because faster runners who hit the wall will experience slower finish times and the wall will lead to greater slowdowns for some runners than for others, and thus, it is difficult to determine the ability of a runner who has hit the wall based on finish time alone. However, an observation that can be made is that the rate of hitting the wall seems to stabilise at approximately 50% for runners with finish times greater than 230 minutes, suggesting half of runners from this point have a sub optimal finish time.
Fig. 6
Average frequency, distance, intensity and chance of recovering plotted against the finish time of runners. The points represent the average values of binned finish times whilst the shaded area depicts the confidence interval of a regression through the points.
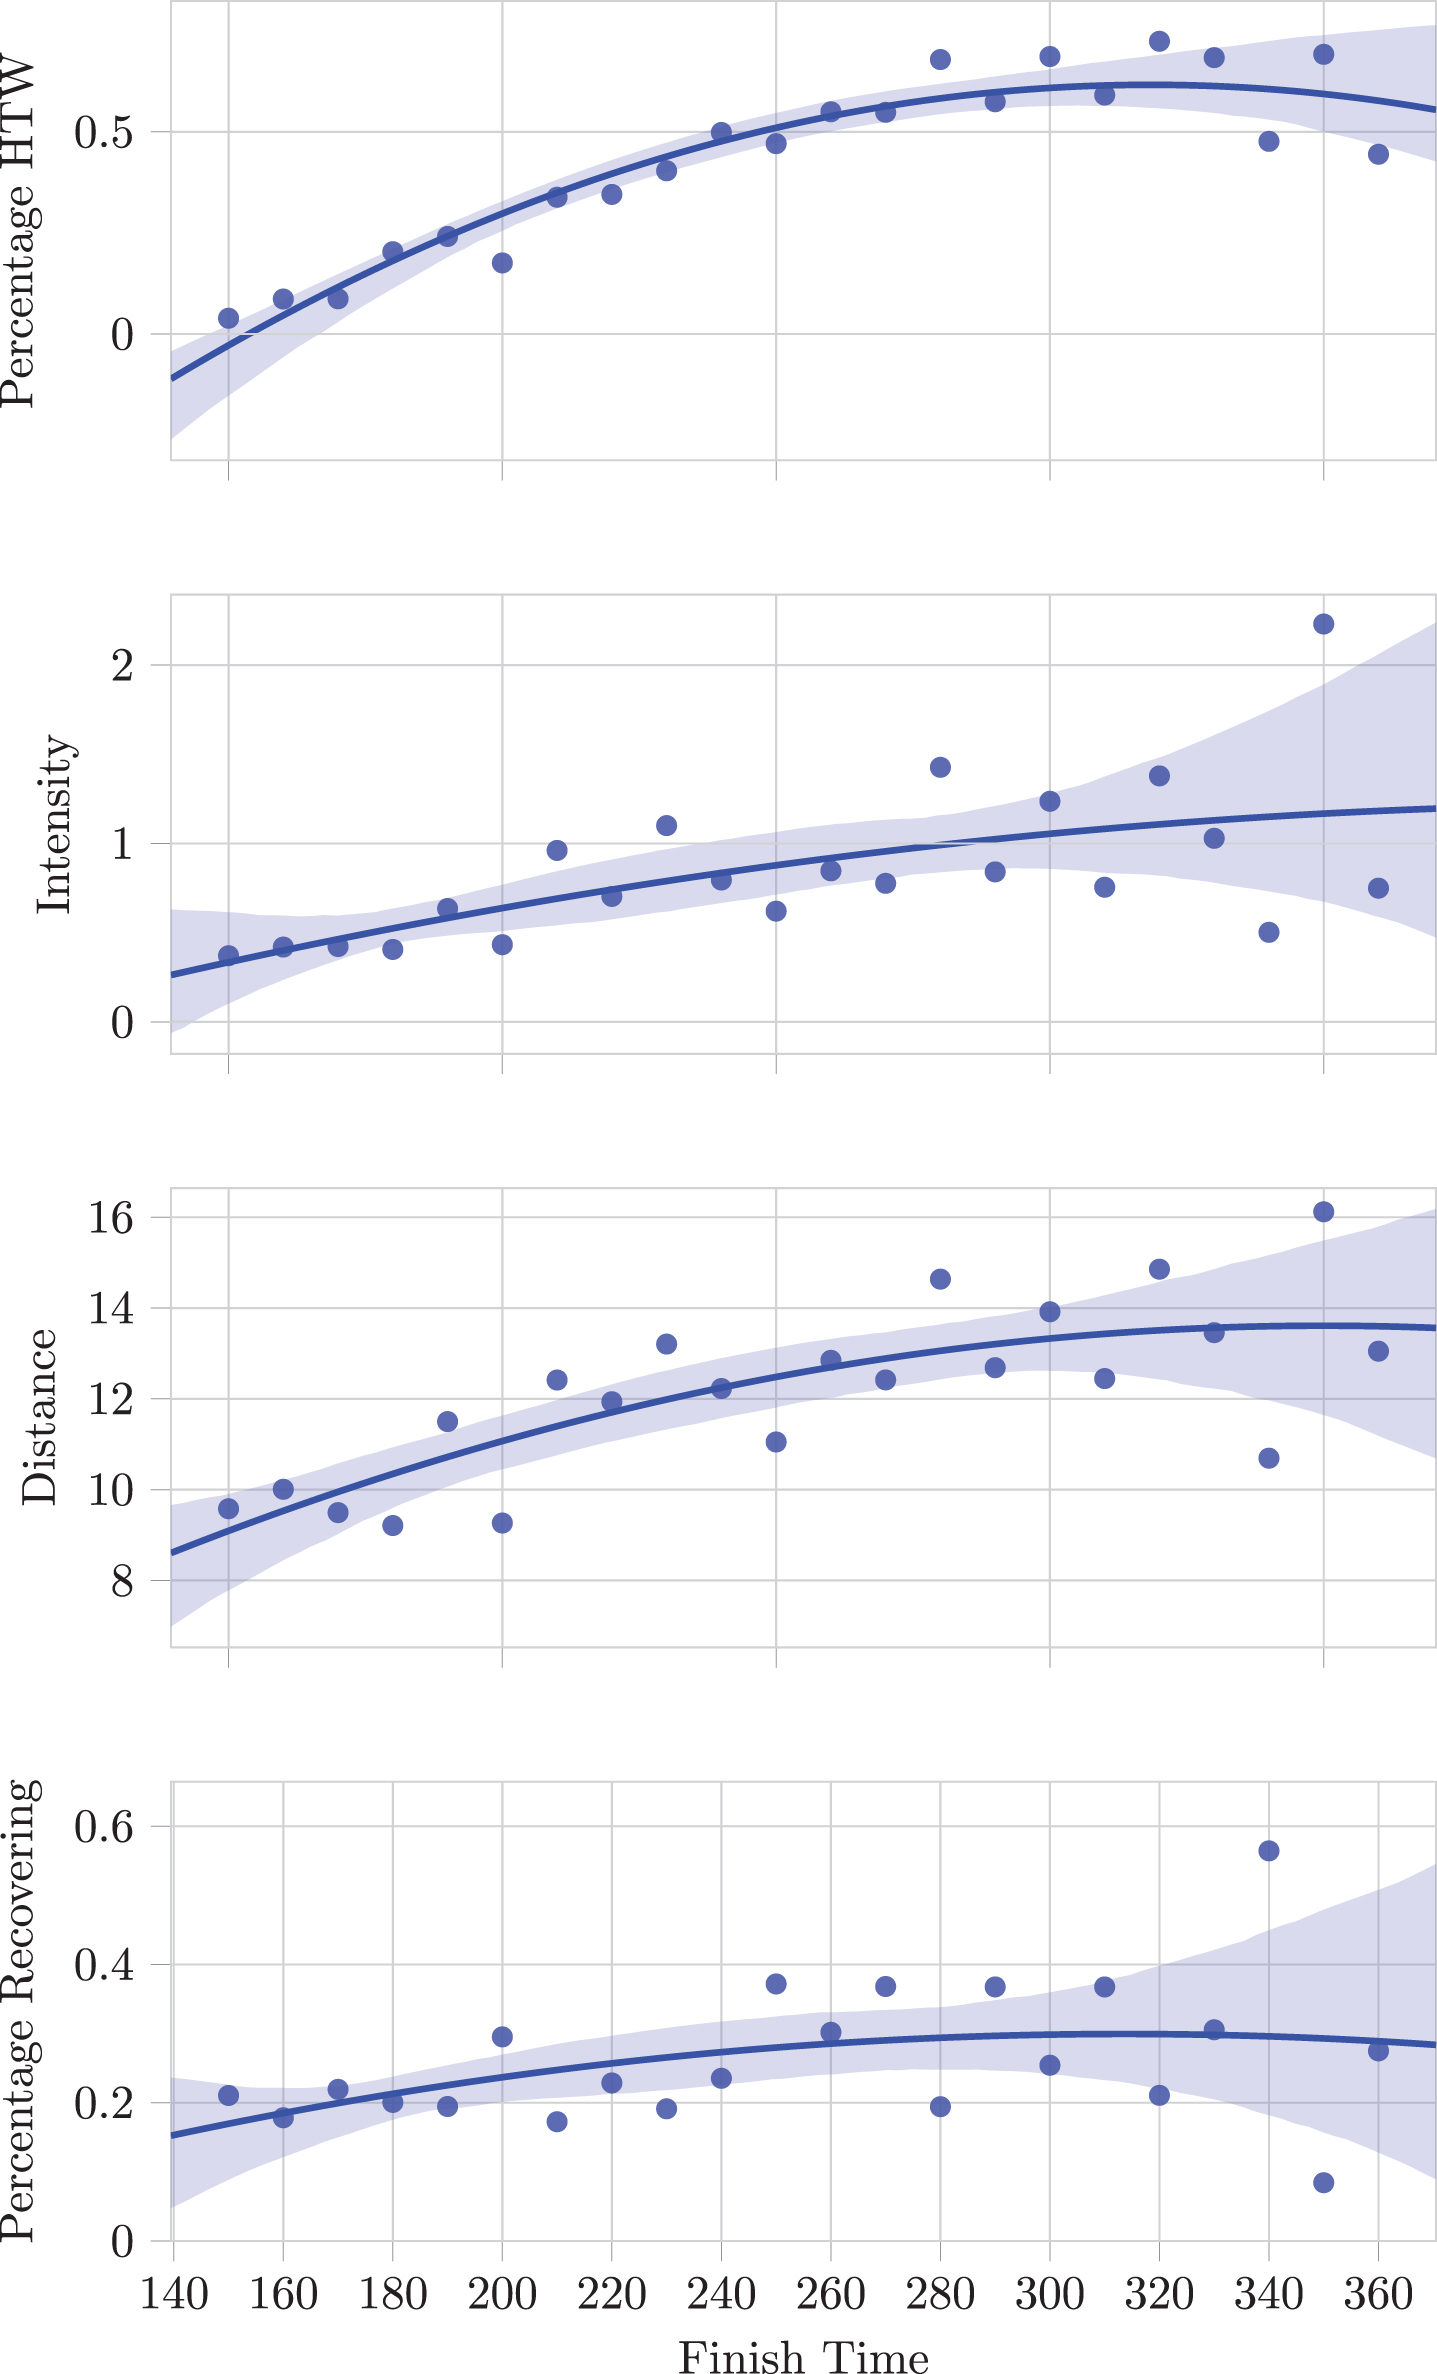
At this point we can note the increasing intensity and distances for runners with slower finishing times. While, again, no link can be made to the ability of the runner we can suggest that runners that have finished the race in a slower time will tend to have suffered a greater effect of the wall. This means that runners with slower finishing times are more likely to have mismanaged their race, and this greater mismanagement has led to a larger influence of the wall on their finish times. This brings to light a further important, sometimes neglected aspect of marathon preparation; the pace planning. The greater the mismanagement of race day pacing the more a runner will suffer and the worse their finish time will be. This demonstrates that mental preparation with respect to how to run the race is a key step in avoiding the wall, and that knowing what the body and mind are capable of is crucial to successful completion of the marathon distance.
A further interesting observation is that the average rate of recovery from the wall does not seem to change depending on the finish time of the runner. This is despite the intensity and distance of the wall generally increase for runners who take longer to finish. This suggests that regardless of the impact of the wall on their performance, the runner is capable of recovery, and this could be because there were psychological reasons for hitting the wall or perhaps because they managed to refuel successfully during the race.
4.5The effect of elevation and gradient
We compare the marathons of Paris, London, Berlin, and New York to gain further insights into the wall. These specific races were chosen due to both their prestige and because they were amongst the races for which we have the most corresponding race records. A brief summary of the composition of these races can be viewed in Table 3
Table 3
Demographic data of city marathons
| Paris | London | Berlin | New York | |
| Finishers | 7810 | 4607 | 4390 | 2887 |
| Finish Time (mins) | 230±38 | 228±45 | 221±38 | 235±40 |
| Age | 38±8 | 38±8 | 39±8 | 41±8 |
| Gender Split (Male) | 87% | 79% | 87% | 83% |
The statistics shown in Figure 7 affirm our intuitions about hitting the wall. Hitting the wall is most likely on more difficult courses. With 657 meters of elevation gain, Paris is among races with the most elevation gain and this is reflected by it having the highest frequency of runners that hit the wall. Runners that hit the wall in Paris also seem to hit the wall harder than elsewhere, with the highest values for both intensity and distance while having the lowest rate of recovery.
Fig. 7
A comparison of the average frequency, distance, intensity and chance of recovering plotted for the Paris, London, Berlin marathons.
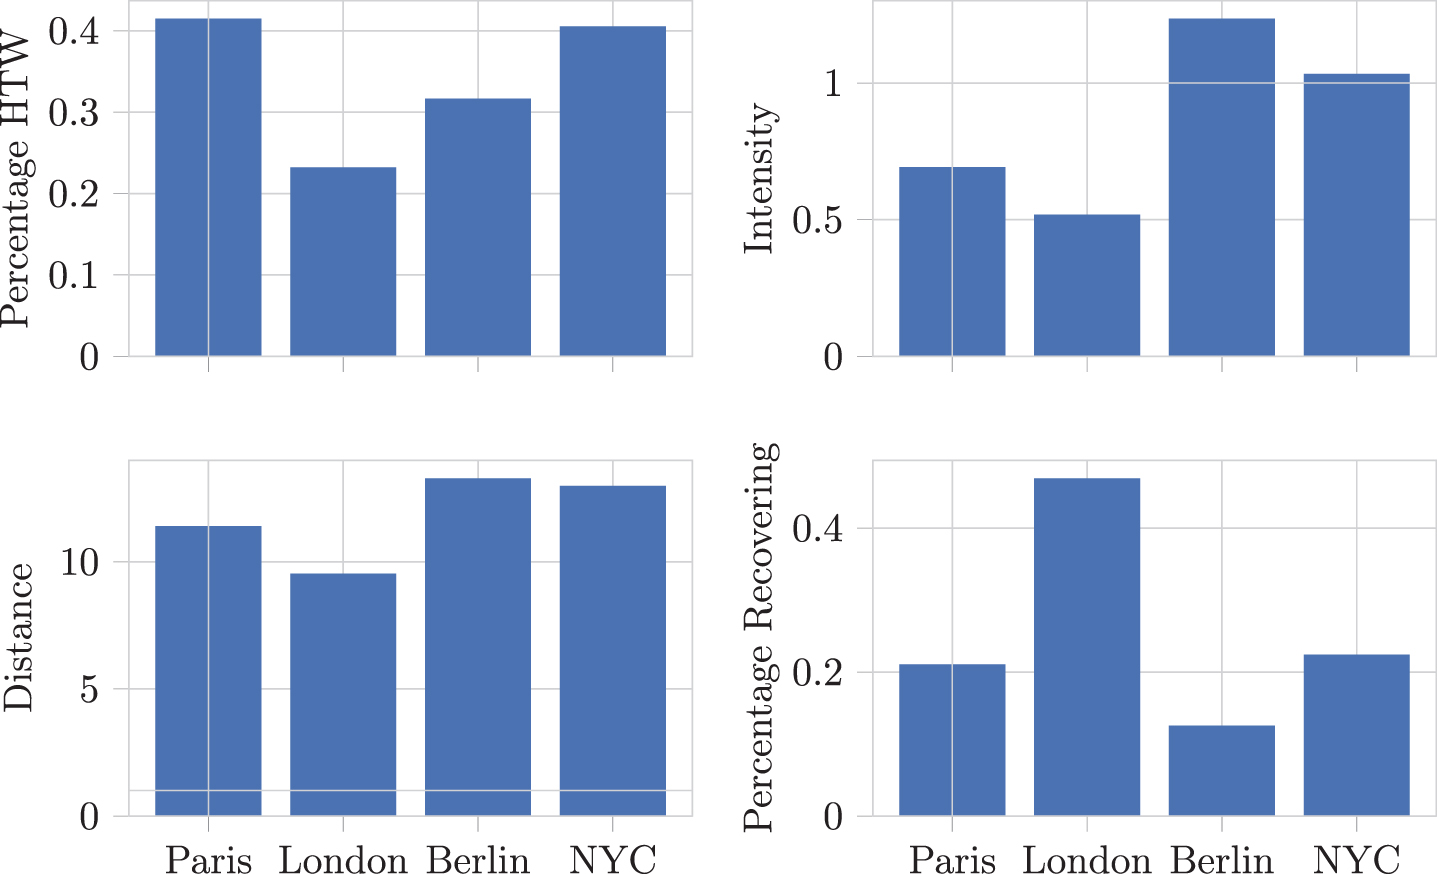
Analysing the different cities that host the marathon further helps us understand the combination of both physical and mental aspects that go into an athlete experiencing the wall. With just 291 meters elevation gain New York could conceivably be considered the least difficult marathon of the four. However, looking at the frequency and intensity of hitting the wall it actually ranks as the second most challenging marathon for those that hit the wall. We can explain this by considering the profile of the course. The onset of the wall in the New York marathon tends to occur at the 24km mark - the point at which runners cross the Queensboro bridge - and also the 37km mark where the runners run up the hill in Central Park. These phenomena can be seen in Figure 8 which shows the elevation profile of the race and the distribution of wall onsets for that particular marathon. In New York, the Queensboro bridge, with its sharp rise, presents both a physical and mental challenge to contestants, which as a combination causes them to slow down and experience the wall. Later in the race the profile levels out and roughly 30% of these athletes recover. Contrast this to Berlin, which is considered a relatively fast and flat marathon that is often targeted for world record attempts. While having an additional 110 meters of elevation gain compared to New York, Berlin has a gentler gradient and lacks the sort of mid-race challenge the Queensboro bridge poses. This takes a much lower mental toll on the runners and thus we only see half the proportion of runners hitting the wall, with those that do experiencing the wall at a lower intensity. However, the lack of psychological barrier mid race means that those hitting the wall are more likely to have depleted their energy reserves, rather than feeling in a hazardous situation due to running in a challenging segment of the race. This energy depletion is more difficult to recover from and thus we see considerably fewer runners recovering in the Berlin marathon.
Fig. 8
Elevation profiles of the city marathons with the distribution of onsets associated with that marathon.
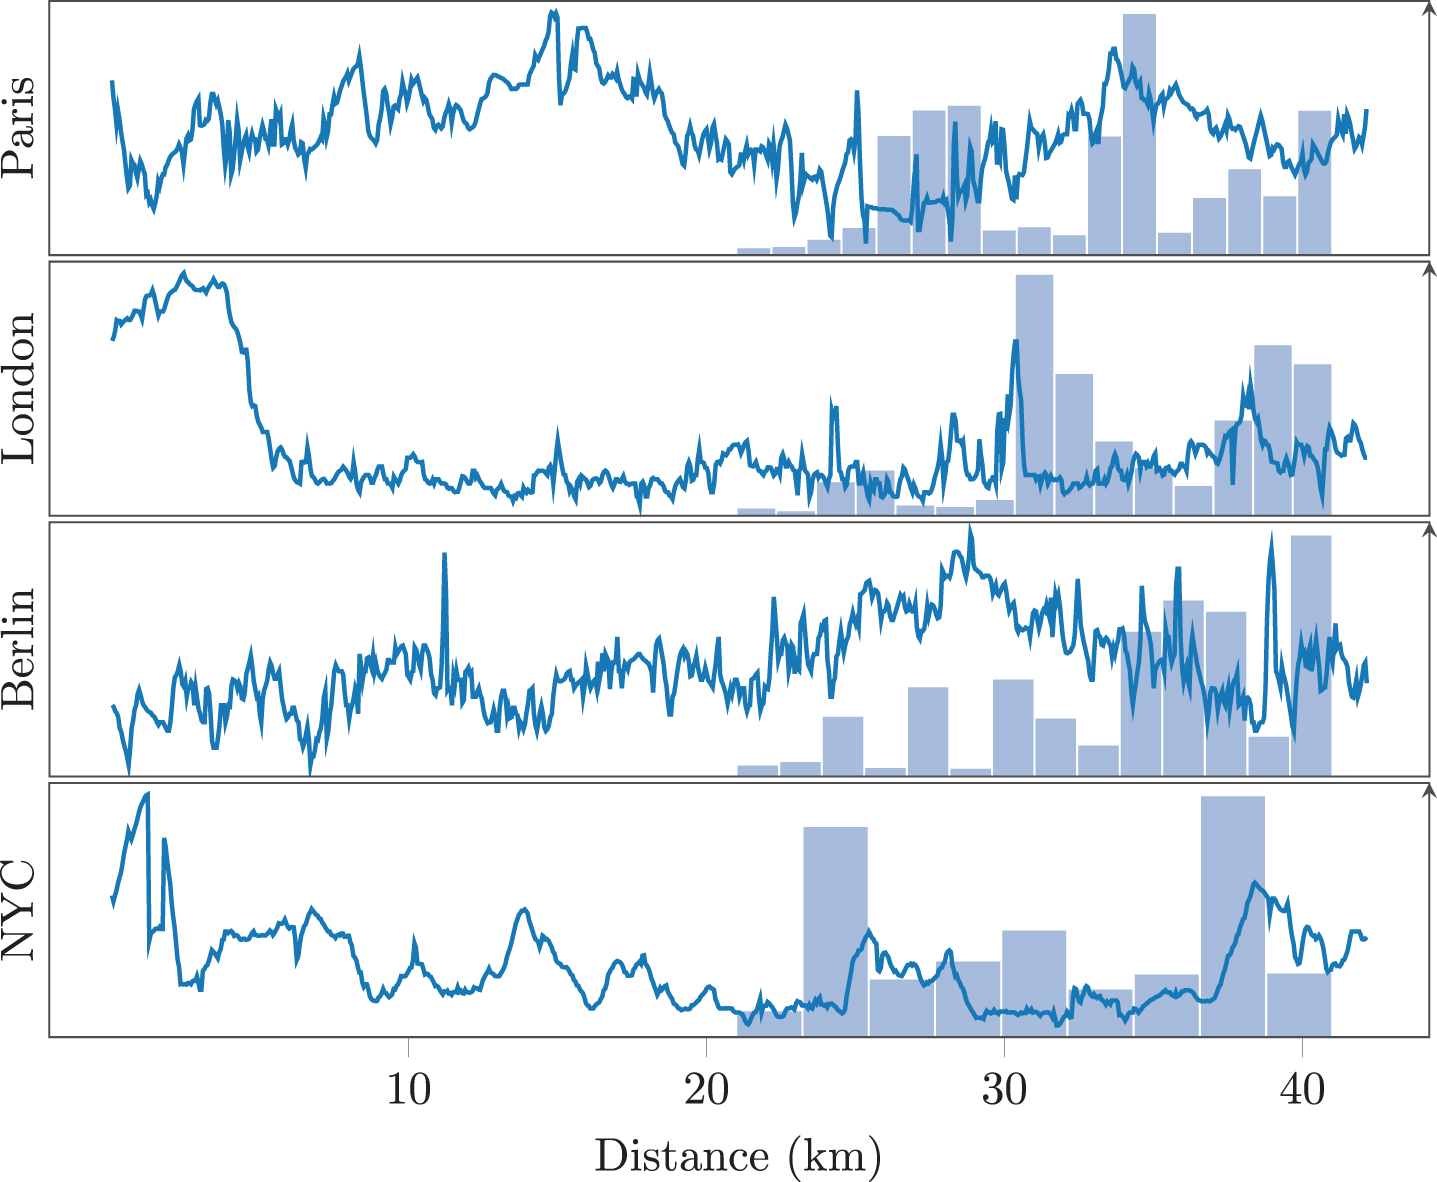
A similar phenomenon to New York is seen in the London Marathon. The difficult section surrounding Canary Wharf at approximately 32km leads to runners feeling challenged and thus slowing their pace significantly due to tiredness at that moment, leading to a similar intensity of hitting the wall to the New York Marathon. However, as this section is short runners realise this is only momentary tiredness and that they are able to continue running the race at or near their original pace, and thus we see a considerably larger number of runners recovering from hitting the wall when compared to the other three marathons in our comparison.
It would, however, be false to suggest that it is the elevation alone that causes this slowdown. Work conducted on the effects of gradient on running pace allow us to adjust the pace of runners for the elevation of the course using a method known as grade adjusted pacing (Minetti et al. 2002). Using grade adjusted pacing we calculate the expected slowdown of runners as they run both over the Queensboro Bridge and through Canary Wharf, assuming they are running with the same energy expenditure throughout the marathon. The expected slowdowns of these two sections are 7% and 15% respectively. The pace collapse of those runners that hit the wall at these points are 23% in New York and 24% in London, while all runners that hit the wall at these points have a pace collapse greater than we would expect from our gradient adjustment. This suggests that while elevation change may affect the slowdown of runners, and may in part determine the stage at which they hit the wall, it does not explain the slowdown to the extent to which we are seeing in our analyses. Similarly, the two sections are shorter than the minimum distance required to fall under our definition of hitting the wall, meaning if it was elevation alone determining the slowdown, runners would have recovered in pace before ever being considered as having hit the wall. Instead it appears that it is the elevation, combined with tiredness and the mental hurdle these passages present, that leads to runners slowing down for a long duration despite their energy reserves not being depleted. Both the Queensboro bridge and Canary Wharf are also the points of the race with the fewest spectators, suggesting this may also play some role in reducing motivation. Recoveries tend to occur at highly populated points of the course in terms of spectators, which adds further weight to the idea that external motivation can become a factor in hitting and recovering from the wall.
5Conclusion & future work
While some research has been conducted into the hitting the wall in the marathon, there has been little previous research into its precise manifestation during the race. Previous research has relied on the self-reporting of runners’ hitting the wall experiences after the race. This meant that there was no way of confirming whether a runner had hit the wall without their explicit confirmation. Our definition of the wall allows us to explore the phenomenon of the wall in a way that was previously impossible, by using pacing data.
This is, to our knowledge, also the largest dataset that has ever been used in the examination of hitting the wall in marathon running and the first attempt at using machine learning approaches to discover key features of the wall. Research into marathon running has often focused on elite runners, yet the scale of the data we are using means that our research can also be meaningful for recreational marathon runners.
The fact that the analysis using our definition of the wall matches many of the previous findings is promising. It not only shows that we have found a reasonable definition of the wall, but also that findings in previous research extend beyond the limited numbers of athletes these studies were based on. Our conclusion that the wall has both a physiological and psychological origin has implications for an athlete’s preparation ahead of race day. They need not only be physically fit in order to have the stamina required for the race, but they must also be mentally prepared to face difficult race sections and unexpected challenges. The latter is an element of marathon running that may have been neglected by many runners in the past, leading to sub-optimal performance.
While the analysis presented in this paper already gives some insight into the causes and manifestation of the wall, it is still limited. A further analysis will consider the external factors that lead to runners hitting the wall. Running uphill is well established to inhibit running pace, and thus we have used it as an approximation of course difficulty, but features such as temperature are also known to effect human performance (Ely et al. 2007). Confirming that such features do influence hitting the wall would allow runners to calibrate their expectations when approaching a race with particularly difficult external conditions.
The viability of recommender systems in the field of running has previously been established (Berndsen et al. 2017; Berndsen et al. 2019). We wish to further utilise our definition of the wall to find the predictors of the wall in runner’s training data. Once the exact indicators of the wall in training have been established recommendations can be made in order to generate a training plan that minimises the chances of hitting the wall. By using more in depth data, such as heart rate and cadence, it may be possible to determine early on in a race whether a runner is likely to hit the wall. In such circumstances precise interventions can be taken in order to mitigate this risk and adjust a runner’s pace in order to finish the race safely and in the quickest possible time. The aim of this research is not simply to investigate the wall in marathon running, but also to bring about tangible benefit to the recreational marathon runner that may not currently have easy access to information that will help them maximise their performance.
Acknowledgment
This work is supported by the Insight Centre for Data Analytics under Grant Number SFI/12/RC/2289_P2
References
1 | Beneke, R. , Leithauser, R. and Doppelmayr, M. (2005) , Women will do it in the long run. In: British Journal of Sports Medicine 39: (7), pp. 410. |
2 | Berndsen, J. , Lawlor, A. and Smyth, B. (2017) , Running with Recommendation. In: Proceedings of Second International Workshop on Health Recommender Systems colocated with ACM RecSys 2017. Como, Italy, pp. 18–22. |
3 | Berndsen, J. , Smyth, B. and Lawlor, A. (2019) , Pacemy race: recommendations formarathon running. In: Proceedings of the 13th ACM Conference on Recommender Systems. ACM. Copenhagen, Denmark, pp. 246–250. |
4 | Berndt, D. J. and Clifford, J. (1994) , Using Dynamic Time Warping to Find Patterns in Time Series, In: Proceedings of the 3rd International Conference on Knowledge Discovery and Data Mining. Seattle, WA: AAAI Press, pp. 359–370. |
5 | Buman, M. P. , Brewer, B. W. and Cornelius, A. E. (2009) , A discrete-time hazardmodel of hitting thewall in recreational marathon runners. In: Psychology of Sport and Exercise 10: (6), pp. 662–666. |
6 | Buman, M. P. , Brewer, B. W. , Cornelius, A. E. , Van Raalte, J. L. , Petitpas, A. J. , (2008) a, Hitting the wall in the marathon: Phenomenological characteristics and associations with expectancy, gender, and running history. In: Psychology of Sport and Exercise 9: (2), pp. 177–190. |
7 | Buman, M. P. , Omli, J. W. , Giacobbi, P. R. Jr, , Brewer, B. W. , Petitpas, A. J. , (2008) b, Experiences and coping responses of “hitting the wall” for recreational marathon runners. In: Journal of Applied Sport Psychology 20: (3), pp. 282–300. |
8 | Coyle, E. F. (2007) , Physiological regulation of marathon performance. In: Sports Medicine 37: (4-5), pp. 306–311. |
9 | Deaner, R. O. , Carter, R. E. , Joyner, M. J. and Hunter, S. K. (2015) , Men are more likely than women to slow in the marathon. In: Medicine and Science in Sports and Exercise 47: (3), pp. 607–616. |
10 | Ely, M. R. , Cheuvront, S. N. , Roberts, W. O. and Montain, S. J. (2007) , Impact of weather on marathon-running performance. In: Medicine and Science in Sports and Exercise 39: (3), pp. 487–493. |
11 | Ester, M. , Kriegel, H.-P. , Sander, J. and Xu, X. (1996) , A density-based algorithm for discovering clusters in large spatial databases with noise. In: Kdd 96: (34), pp. 226–231. |
12 | Frey, B. J. and Dueck, D. (2007) , Clustering by passing messages between data points. In: science 315: (5814), pp. 972–976. |
13 | Grant, S. , Sharp, R. and Aitchison, T. (1984) , First time marathoners and distance training. In: British Journal of Sports Medicine 18: (4), pp. 241–243. |
14 | Hubble, C. and Zhao, J. (2016) , Gender differences in marathon pacing and performance prediction. In: Journal of Sports Analytics 2: (1), pp. 19–36. |
15 | Ilhan, N. , Kamanli, A. , Ozmerdivenli, R. and Ilhan, N. (2004) , Variable effects of exercise intensity on reduced glutathione, thiobarbituric acid reactive substance levels, and glucose concentration. In: Archives of Medical Research 35: (4), pp. 294–300. |
16 | Latta, S. (2003) , Hitting the wall-if you understand the scientific reasons behind the wall, you should be able to avoid it. In: Marathon & Beyond 7: (5), pp. 61–72. |
17 | MacQueen, J. (1967) , Some methods for classification and analysis of multivariate observations. In: Proceedings of the Fifth Berkeley Symposium on Mathematical Statistics and Probability Vol. 1. 14. Oakland, CA, USA, pp. 281–297. |
18 | March, D. S. , Vanderburgh, P. M. , Titlebaum, P. J. and Hoops, M. L. (2011) , Age, sex, and finish time as determinants of pacing in the marathon. In: The Journal of Strength & Conditioning Research 25: (2), pp. 386–391. |
19 | Minetti, A. E. , Moia, C. , Roi, G. S. , Susta, D. and Ferretti, G. (2002) , Energy cost of walking and running at extreme uphill and downhill slopes. In: Journal of Applied Physiology 93: (3), pp. 1039–1046. |
20 | Morgan, W. P. (1978) , The Mind of the Marathoner. In: Psychology Today 11: , pp. 38–49. |
21 | Müller, M. (2007) , Dynamic timewarping. In: Information Retrieval for Music and Motion, pp. 69–84. |
22 | Ng, A. Y. , Jordan, M. I. and Weiss, Y. (2002) ), On spectral clustering: Analysis and an algorithm. In: Advances in Neural Information Processing Systems. MIT Press, pp. 849–856. |
23 | Rapoport, B. I. (2010) , Metabolic factors limiting performance in marathon runners”. In: PLoS computational biology 6: (10). |
24 | Riddell, M. C. , Partington, S. L. , Stupka, N. , Armstrong, D. , Rennie, C. and Tarnopolsky, M. A. (2003) , Substrate utilization during exercise performed with and without glucose ingestion in female and male endurance-trained athletes. In: International Journal of Sport Nutrition and Exercise Metabolism 13: (4), pp. 407–421. |
25 | Sakoe, H. and Chiba, S. (1978) , Dynamic programming algorithm optimization for spoken word recognition. In: IEEE transactions on Acoustics, Speech, and Signal Processing 26: (1), pp. 43–49. |
26 | Santos-Lozano, A. , Collado, P. , Foster, C. , Lucia, A. and Garatachea, N. (2014) , Influence of sex and level on marathon pacing strategy. Insights from the City race. In: International Journal of Sports Medicine 35: (11), pp. 933–938. |
27 | Smyth, B. (2018) , Fast starters and slow finishers: a large-scale data analysis of pacing at the beginning and end of the marathon for recreational runners. In: Journal of Sports Analytics 4: (3), pp. 229–242. |
28 | Stevinson, C. D. and Biddle, S. J. (1998) , Cognitive orientations in marathon running and “hitting the wall”. In: British Journal of Sports Medicine 32: (3), pp. 229–234. |
29 | Summers, J. J. , Sargent, G. I. , Levey, A. J. and Murray, K. D. (1982) , Middle-aged, non-elite marathon runners: A profile. In: Perceptual and Motor Skills 54: (3), pp. 963–969. |
30 | Vickers, A. J. and Vertosick, E. A. (2016) , An empirical study of race times in recreational endurance runners. In: BMC Sports Science, Medicine and Rehabilitation 8: (1), pp. 26. |
31 | Ward J. H. Jr, (1963) , Hierarchical grouping to optimize an objective function. In: Journal of the American Statistical Association 58: (301), pp. 236–244. |

