Integrating a City’s Existing Infrastructure Vulnerabilities and Carbon Footprint for Achieving City-Wide Sustainability and Resilience Goals


1
WISRD, LLC, Arvada, CO 80001, USA
2
LEIF, LLC, Arvada, CO 80001, USA
*
Author to whom correspondence should be addressed.
Urban Sci. 2018, 2(3), 53; https://doi.org/10.3390/urbansci2030053
Submission received: 31 May 2018
/
Revised: 15 June 2018
/
Accepted: 24 June 2018
/
Published: 25 June 2018
(This article belongs to the Special Issue Urban Disaster and Recovery)
Abstract
:Cities are setting both sustainability and resilience goals that recognize the significant pressures that cities will face over the coming decades due to increasing global populations, aging infrastructure, and hazards posed by climate change. To further help cities reach and meet this broad range of goals, the World Bank recently released the Urban Sustainability Framework in early 2018 as a framework for achieving an intelligent growth scenario, with a key recommendation of calls for the more efficient use of existing infrastructure. Albeit a prudent course, the first step in adding more stress to existing infrastructure requires a baseline cross-sector examination as to the existing daily reliability, age of assets, and other vulnerabilities regarding climate change. This examination of the inherent reliability of a city’s infrastructure systems then becomes the foundation for prioritizing projects in the capital investment planning process. However, to better integrate cross-silo priorities, new key performance indicators are required to better connect existing infrastructure vulnerabilities to a city’s carbon footprint and move towards synchronizing climate action and capital investment planning priorities to better represent intelligent growth and resource use.
1. Introduction
To an increasing extent, cities are setting both sustainability and resilience goals as part of engaging in the multitude of coalitions and frameworks that recognize the significant pressures that cities will face over the coming decades due to increasing global populations, aging infrastructure, and hazards posed by climate change. The Global Covenant of Mayors for Climate and Energy, for example, the largest coalition of cities committed to acting on climate change, require that member cities understand both their contributions to climate-changing greenhouse gas (GHG) emissions and the localized vulnerabilities because of climate change, providing the basis to set targets to reduce emissions and build resilience. The Rockefeller Foundation’s City Resilience Framework (CRF) similarly encourages cities to consider a multitude of interconnected systems in their quest towards resilience [1]. To further help cities reach and meet their resilience and sustainability goals, the World Bank recently released the Urban Sustainability Framework (USF) in early 2018 [2], in order to “… enable cities to leverage financing to advance their sustainability and resilience agendas, and in particular to work toward the United Nations Sustainable Development Goal (SDG) 11—making cities inclusive, safe, resilient, and sustainable”. One of the key recommendations in the USF is for rapidly urbanizing cities to promote an intelligent growth scenario that calls for the more efficient use of existing infrastructure. This recommendation is echoed by many; however, before considering financing strategies and placing more strain on existing infrastructure, an examination is required as to the existing daily reliability, age of assets, and other vulnerabilities of a city’s infrastructure systems to climate change. Most cities rely on the capital investment planning (CIP) process for allocating resources toward the maintenance and repair of existing municipal infrastructures and investing in new or expanded infrastructures, such as roads, energy distribution, and wastewater treatment. Since the financial resources available to a city for capital projects are limited, a process should be established to evaluate the competing needs of various municipal services to maximize the use of the financial resources in the areas of highest priority to the city [3]. However, new key performance indicators (KPIs) are required to better connect existing infrastructure system vulnerabilities to a city’s carbon footprint and move towards synchronizing climate action and CIP priorities to better represent intelligent growth and resource use. The carbon footprint of a city must be viewed in relation to the infrastructure system that conveys the carbon to have a common set of KPIs. These examinations fit nicely into the first stage of the USF—the Diagnosis—that asks the question “Where are we now?” Or, in other words, what are the baseline conditions of a city’s main infrastructure sectors and what integrated information should be part of a city’s CIP process to establish a comprehensive plan to achieve the intent of SDG 11.
For purposes of this paper, “infrastructure” refers primarily to horizontal infrastructure, e.g. roads, pipes, and lines, differing from vertical infrastructure, e.g., buildings. The reliability and vulnerabilities of a city’s existing infrastructure systems lay the foundation for which further urban development is built upon and an evaluation of baseline conditions should be a crucial first step in the USF’s Diagnosis. As a system is only as reliable as its weakest component, the reliability of a city’s existing infrastructure systems need to be considered before expanding these systems to serve a growing urban population. It is projected that 75 percent of infrastructure required [4] to support and provide the basic needs to the two-thirds of the world’s 9.8 billion people that will live in urban areas by 2050, has not yet been built [5]. Also, new infrastructure investments into existing systems will have long lasting effects on systemic GHG contributions and the ability for cities to adapt to the effects of climate change. This suggests significant urgency to incorporate these factors into local investment decisions. However, many projects are financed using project specific KPIs or even project specific certifications (e.g., Envision from the Institute of Sustainable Infrastructure [6]) without an overall system analysis. A systems analysis provides greater opportunity to better understand and prioritize projects. A city’s carbon footprint is based on such system analyses, as derived by protocol [7], that focuses on the sources of carbon emissions (e.g., buildings and vehicles) and delivers metrics in tons of CO2e (carbon dioxide equivalents) by sector and scope, per capita, and for the city. In general, more than 80 percent of U.S. greenhouse gas (GHG) emissions can be attributed directly to our infrastructure systems [8]. There is a clear need for the priorities of climate action to be integrated into the CIP for all cities.
The price tag of the total global infrastructure investment requirements by 2030 of $71 trillion USD [9] will be borne primarily by cities, and hence the individual taxpayers. This total investment assumes that maintenance of existing systems can be accomplished efficiently, and new assets will be added to allow for the increasing urban populations. In addition, even though numerous studies have concluded that society saves $6 USD for every $1 spent on infrastructure projects that reduce natural hazard and disaster risk [10], the elected officials of a city are reluctant to move ahead on these projects, claiming that it is not the ‘right political climate’ to raise taxes or pass a bond. As a result, cities have stalemated, preferring deferred maintenance to new projects, and have accepted a paradigm that allows the city’s assets to progressively age. For example, water utilities in the United States install water mains with a material and service lifespan (design-life) of 75–100 years, yet the average pipe break occurs at 47 years and the system replacement rate is just 0.5% per year (i.e., an estimated 200-year replacement cycle—more than double the useful life of the pipes) [11]. The complexity for maintaining reliable infrastructure grows exponentially as multiple infrastructure sectors (i.e., energy, sanitation, and communications), all with aging assets, are collocated together under congested roads, where any repairs or replacements would disrupt commuting and businesses.
The complexity of collating priorities from all infrastructure sectors and recommendations for adaptive/regenerative strategies recommended by climate action and urban planners are not only a challenge to city decision-makers but have also widened the gap in public knowledge as to the extent and true cost of maintaining reliable city services. As a result, elected officials are avoiding taking action, i.e., NIMTOF—not in my term of office—in developed and developing nations. To overcome NIMTOF, a vision for intelligent growth and resource efficiency, i.e., the city we want, must be presented. This requires a communications platform that utilizes visualization and simplified information that engages the public. Even the most sophisticated public stakeholder groups will find it difficult to integrate the numerous sources of capital improvement priorities in a city. The process for creating the correct ‘political climate’ and a proactive CIP is the intent of the USF’s Stage 2—Vision and Priorities for Action—that asks the questions “Where do we want to go?” and “How do we get there?” This requires a clear articulation of a vision and a plan to achieve a resilient city.
Albeit complex, the integration of various priorities into the USF Diagnosis (Stage 1) begins by having a framework for the CIP process that provides guidance to the question—where do we start? To support this, new KPIs are needed that provide quantifiable means of assessing (1) reliability of infrastructure (in developing and developed nation contexts); (2) threats due to infrastructure collocation and natural hazards; and (3) the outcomes of a city’s GHG emissions inventory for integration into the CIP process. Finally, the process for effective CIP communication and engaging the public begins when common KPIs can unite goals across different city departments and a platform enables all stakeholders to visualize these connections. A communications tool such as this, that provides integrated information to the CIP, i.e., an IICIP [12] is needed to provide the USF’s Vision and Priorities for Action (Stage 2) to the public.
This paper first focuses on a process for prioritizing projects in the CIP and developing new KPIs that better integrate infrastructure reliability and provide common denominators with a city’s GHG inventory (Stage 1—Diagnosis). As such, the Greenhouse Gas-Infrastructure Vulnerability (GHG-IV) Framework is introduced in this paper as a complimentary protocol to the internationally accepted Global Protocol for Community-Scale GHG Emission Inventories (GPC). Then, a visualization tool is discussed that integrates the results of the Diagnosis in such a way to provide an inspiration for the public, and hence the elected officials, to rally around (Stage 2—Vision and Priorities for Action).
2. The Diagnosis for Resilient Cities: A Framework for the CIP Prioritization
In most resiliency frameworks, cities are asked to answer the question—where are we now? Yet, a city is “…a massive system of systems…” [13] and often the most realistic question for cities is—where do we start? A city’s systems extend well-beyond just infrastructure, but include; education, health, emergency, governance and a host of other social systems—all vital for a resilient city. The USF sets the stage for what should be prioritized by citing that:
“There are two types of investments that a city can make to improve sustainability: capacity building investments (soft infrastructure), and investments in physical assets (hard infrastructure).”
However, what are the synergies between an investment in hard infrastructure to soft infrastructure and how do you prioritize between the two? A city needs to answer this question by providing a clear roadmap towards achieving a resilient city to engage public participation and garner the support for ultimately funding any city investments. This question was also the focus of a partnership between the Rockefeller Foundation and Arup. The resulting holistic approach to resilience is presented in their CRF and City Resilience Index (CRI) [14]. These resources help cities track and evaluate resilience according to four major dimensions: Health and Wellbeing, Economy and Society, Infrastructure and Environment, and Leadership and Strategy. In addition, while this framework and index provides an extensive overview of the immense number and variety of systems that are required to simultaneously function to maintain a resilient city, a methodology for assessing a city’s infrastructure systems is not provided. Identifying the physical dependency of all a city’s systems can provide that starting point and inform how a city can mitigate the potential of cascading infrastructure failures. This was recognized by former Rockefeller Foundation President, Judith Rodin.
“Because everything is interconnected—a massive system of systems—a single disruption often triggers another, which exacerbates the effects of the first, so that the original shock becomes a cascade of crises.”[13]
To further define a ‘starting place’ and reduce the chances of that “single disruption” from occurring in the first place, a dependency model—the Foundational Infrastructure Framework (FIF)—can be a useful lens to understand the interconnectedness of systems [15]. The FIF shows a physical dependence of systems, analogous to building a house where there is an inherent order—i.e., beginning with the foundation before adding the walls and roof. The ‘foundational’ portion of the model are the seven main infrastructure systems that support Essential Services (such as Food Supply and Emergency Services) as well as other important Societal Services, as shown on Figure 1. For example, in Dependent Essential Services, Food Supply and Distribution are physically dependent on Buildings (warehouses), Energy (fuel), Transportation (all forms), and Water to provide for the Health of a city. Similarly, in Societal Services, the Housing sector requires connections to Energy, Water, Sanitation, Transportation, and Communications. Please note that ‘critical infrastructure’ can exist at any of the three levels in Figure 1, and all systems are equally important for maintaining a viable city. However, being of equal importance; however, does not mean that some systems are not dependent on others to function effectively. Therefore, the FIF represents a hierarchical interdependent systems framework that make up our cities [15].
Figure 1 highlights the connection between soft and hard infrastructure priorities, as well as the dependence that all cities have on natural systems. As stated in the USF, “A sustainable city preserves its environmental and physical assets for future generations while enhancing its competitiveness”. After all, nearly all water, fuel, food, and construction materials that support a city, do not originate from within the city boundaries but instead are derived from natural systems from around the world. However, while vital to the support of a city, infrastructure assets outside of the city boundaries are typically outside of a city’s CIP purview. Rather, a city CIP focuses primarily on distribution-based assets (treatment plants, pipes and wires). Further refinement of the dependency of the seven foundational infrastructure systems in the FIF, including how buildings are sorted either into the vertical built environment or as part of a horizontal system, e.g., a water treatment plant, are defined through ‘filters’ [15] that examine the dependency relationships between key components within the larger infrastructure system and whether an asset is a significant threat to the physical functioning of other infrastructure sectors.
3. The Diagnosis for Resilient Cities: New KPIs for Infrastructure Reliability
The reliability of a city’s infrastructure systems requires new KPIs to better quantify and identify key potential infrastructure vulnerabilities prior to failure—not after the fact—both in the developed and developing world context. In the United States, the American Society of Civil Engineers (ASCE) publishes quadrennial reports on the status of infrastructure in the United States, referred to as The Infrastructure Report Card [16]. The current overall grade of a D+ for the infrastructure in the United States did not change since the Report Card was last published in 2013. In fact, the ASCE has now issued six report cards since 1998, with the intention of influencing the planning, operation, and maintenance of major urban infrastructure, and the grade has never exceeded a D+. In addition, given the stagnation of this trend, it is increasingly clear that aging infrastructure is a communications issue—not an engineering issue.
Consistent with these low ratings from the ASCE, throughout the country there are over 240,000 water main breaks every year and over 56,000 bridges that are over 50 years old and considered structurally deficient [16]. The Report Card claims that $4.59 trillion is required to bring U.S. systems to a B, or an adequate grade, by 2025. Despite the obvious need for investment in the nation’s infrastructure, the onus of this expense rests at the municipalities which are struggling financially and need a more efficient CIP process that provides a vision of the city we want. The following subsections discuss four key KPIs for cities to integrate into the CIP process to better understand and move toward the city we want.
3.1. Design-Life vs. Remaining Useful Life
The current paradigm used by municipal governments across the United States is to install new municipal infrastructure with an intended design-life (the period for which a component, device, or system is expected to function at its designated capacity without major repairs) of 75 to 100-years. However, the cities or utility departments only provide a maintenance plan that replaces the infrastructure on a 200- to 400-year cycle (based on available funds). The ratio between an asset design-life and the replacement cycle of the asset has been referred to as the infrastructure ‘decay rate’ [12]. The explanation as to why there is such a disparity between design-life and replacement rate is due to modern asset management systems that provides the KPI of ‘remaining useful life’ (the estimated time that a depreciable fixed asset can be expected to contribute to utility operations). That is, rather than replacing assets at the end of the intended design-life, assets are examined for remaining useful life before replacement. This practice is utilized in all sectors of infrastructure and is intended to stretch the value from each asset. For example, the American Water Works Association (AWWA) reports that water mains have a material and service lifespan (design-life) of 75–100 years [17]. Yet, as previously mentioned, water utilities in the United States are averaging a pipe replacement rate of 0.5% per year (i.e., a 200-year replacement cycle). Even progressive water utilities, such as Denver Water, have a 0.38% replacement rate (i.e., a 263-year replacement cycle—3.1 times longer than the design life) [18]. While there is an economic argument to use remaining useful life rather than design-life for making decisions about replacement, it is also known that responding to emergency breaks are much costlier when compared to a planned replacement. For example, large-diameter pipes cost approximately $250 per linear foot in a planned replacement, while the total costs resulting from emergency breaks ranged from $6000 to $8.5 million, with an average cost of $1.7 million. The largest portion of these costs (52%) was associated with claims paid directly by the utility and/or the utility’s insurance company for property damage [19]. The AWWA has been reporting on this fact for many years.
“…aging water mains are subject to more frequent breaks and other failures that can threaten public health and safety (such as compromising tap water quality and fire-fighting flows). Buried infrastructure failures also may impose significant damages (for example, through flooding and sinkholes), are costly to repair, disrupt businesses and residential communities, and waste precious water resources. These maladies weaken our economy and undermine our quality of life. As large as the cost of reinvestment may be, not undertaking it will be worse in the long run by almost any standard.”[17]
As all infrastructure systems are only as strong as the weakest asset that it contains, each asset in a system may be the cause of unreliability. For providing an overall grade to an infrastructure system, on the national and state level, the ASCE uses eight criteria [20]. However, for purposes of better assessing day-to-day reliability of infrastructure at the city-level, poor grades in some criteria should not be averaged with good grades in other criteria, e.g., does an ‘F’ in the ‘Condition’ criteria and an ‘A’ in the ‘Capacity’ criteria equal a ‘C’? Similarly, the “leading comprehensive framework and certification program for evaluating local sustainability” in the United States is the Sustainability Tools for Assessing and Rating (STARTM) Communities [21] Out of the total of 750 points, across 8 major goal areas, only one indicator offers up to 3.5 points if it can be demonstrated that “at least 90% of existing public infrastructure is in good or better condition” as defined by ASCE. However, having 90% of a system in ‘good’ condition could mean that 10% is ‘bad’, which is literally the definition of decimated, and relates directly to the ‘weakest link’ concept that this paper is communicating. An infrastructure sector should not be evaluated by the percent of a system that is ‘good’, but rather, by the percent of a system that is near or beyond the intended design-life of each asset. Therefore, a KPI for evaluating the existing conditions of an infrastructure system can be defined as the percentage of the system that are older than the intended design-life.
3.2. Infrastructure Collocation, Natural Hazards, and Most Vulnerable Cells
With the existing condition of an infrastructure system in mind, a path toward infrastructure resilience needs to also consider vulnerabilities of collocated assets within a city. For example, what are the implications of placing a new water main over a deteriorating bridge? Or, placing new pavement over extremely aging infrastructure that will either break, or are scheduled to be replaced in the near-future. New KPIs can be used to identify which infrastructure assets threaten collocated assets, i.e., assets that are (1) ‘active’ (natural gas, potable water, forced mains, and bridges) would physically damage other collocated assets should they fail; and (2) where these active assets are older than the intended design-life, they would be identified as ‘threatening’. Collocation analysis that identifies threatening assets and the threatened collocated assets could have significant impacts on how the vulnerability of each infrastructure system is viewed. For example, a new natural gas main that is collocated with a threatening water main would itself be threatened. The collocation analysis requires spatial data on the age and material of infrastructure assets. Therefore, enabling a city to utilize geographic information systems (GIS) for the CIP planning is necessary, and allows for geospatial analyses to be communicated in a platform that helps facilitate the Visioning and Priority Actions in Stage 2 of the USF.
Building on the collocation analysis, expected natural disaster events relevant to the city could then be overlaid for evaluating how each disaster may impact underlying infrastructure. This is a critical step as aging infrastructure is often not considered a hazard in planning frameworks, as is the case in the United States. The US Federal Emergency Management Agency’s (FEMA’s) guidance for Hazard Mitigation Plans (HMP), requires a community to address natural hazards, ‘manmade’ hazards (refers to vulnerabilities of systems to terrorism [22]), and technological hazards (refers to nuclear power plant incidents and U.S. Army chemical stockpiles [23]), but does not require an overview of aging infrastructure in hazard analyses.
By geospatially viewing the results of existing conditions, collocation analyses, and potential natural hazards imported from the HMP, a fine-scale grid can be spatially applied over the city in the GIS platform to create ‘cells’ across the city that assigns a value to the number of assets threatened. The cells with the highest values, which are the most impacted assets, are identified as ‘Most Vulnerable Cells’ (MVC). The resulting heatmap of infrastructure vulnerabilities allows city decision-makers in the CIP process to have an overall and simplified view of the current conditions of the city’s physical infrastructure assets according to three potential modes of failure: (1) the existing conditions of each sector (examined individually); (2) the collocation of assets (i.e., when two or more assets are located within close proximity to each other); and (3) importing the results of the City’s Hazard Mitigation Planning (HMP)—or predicted natural hazards.
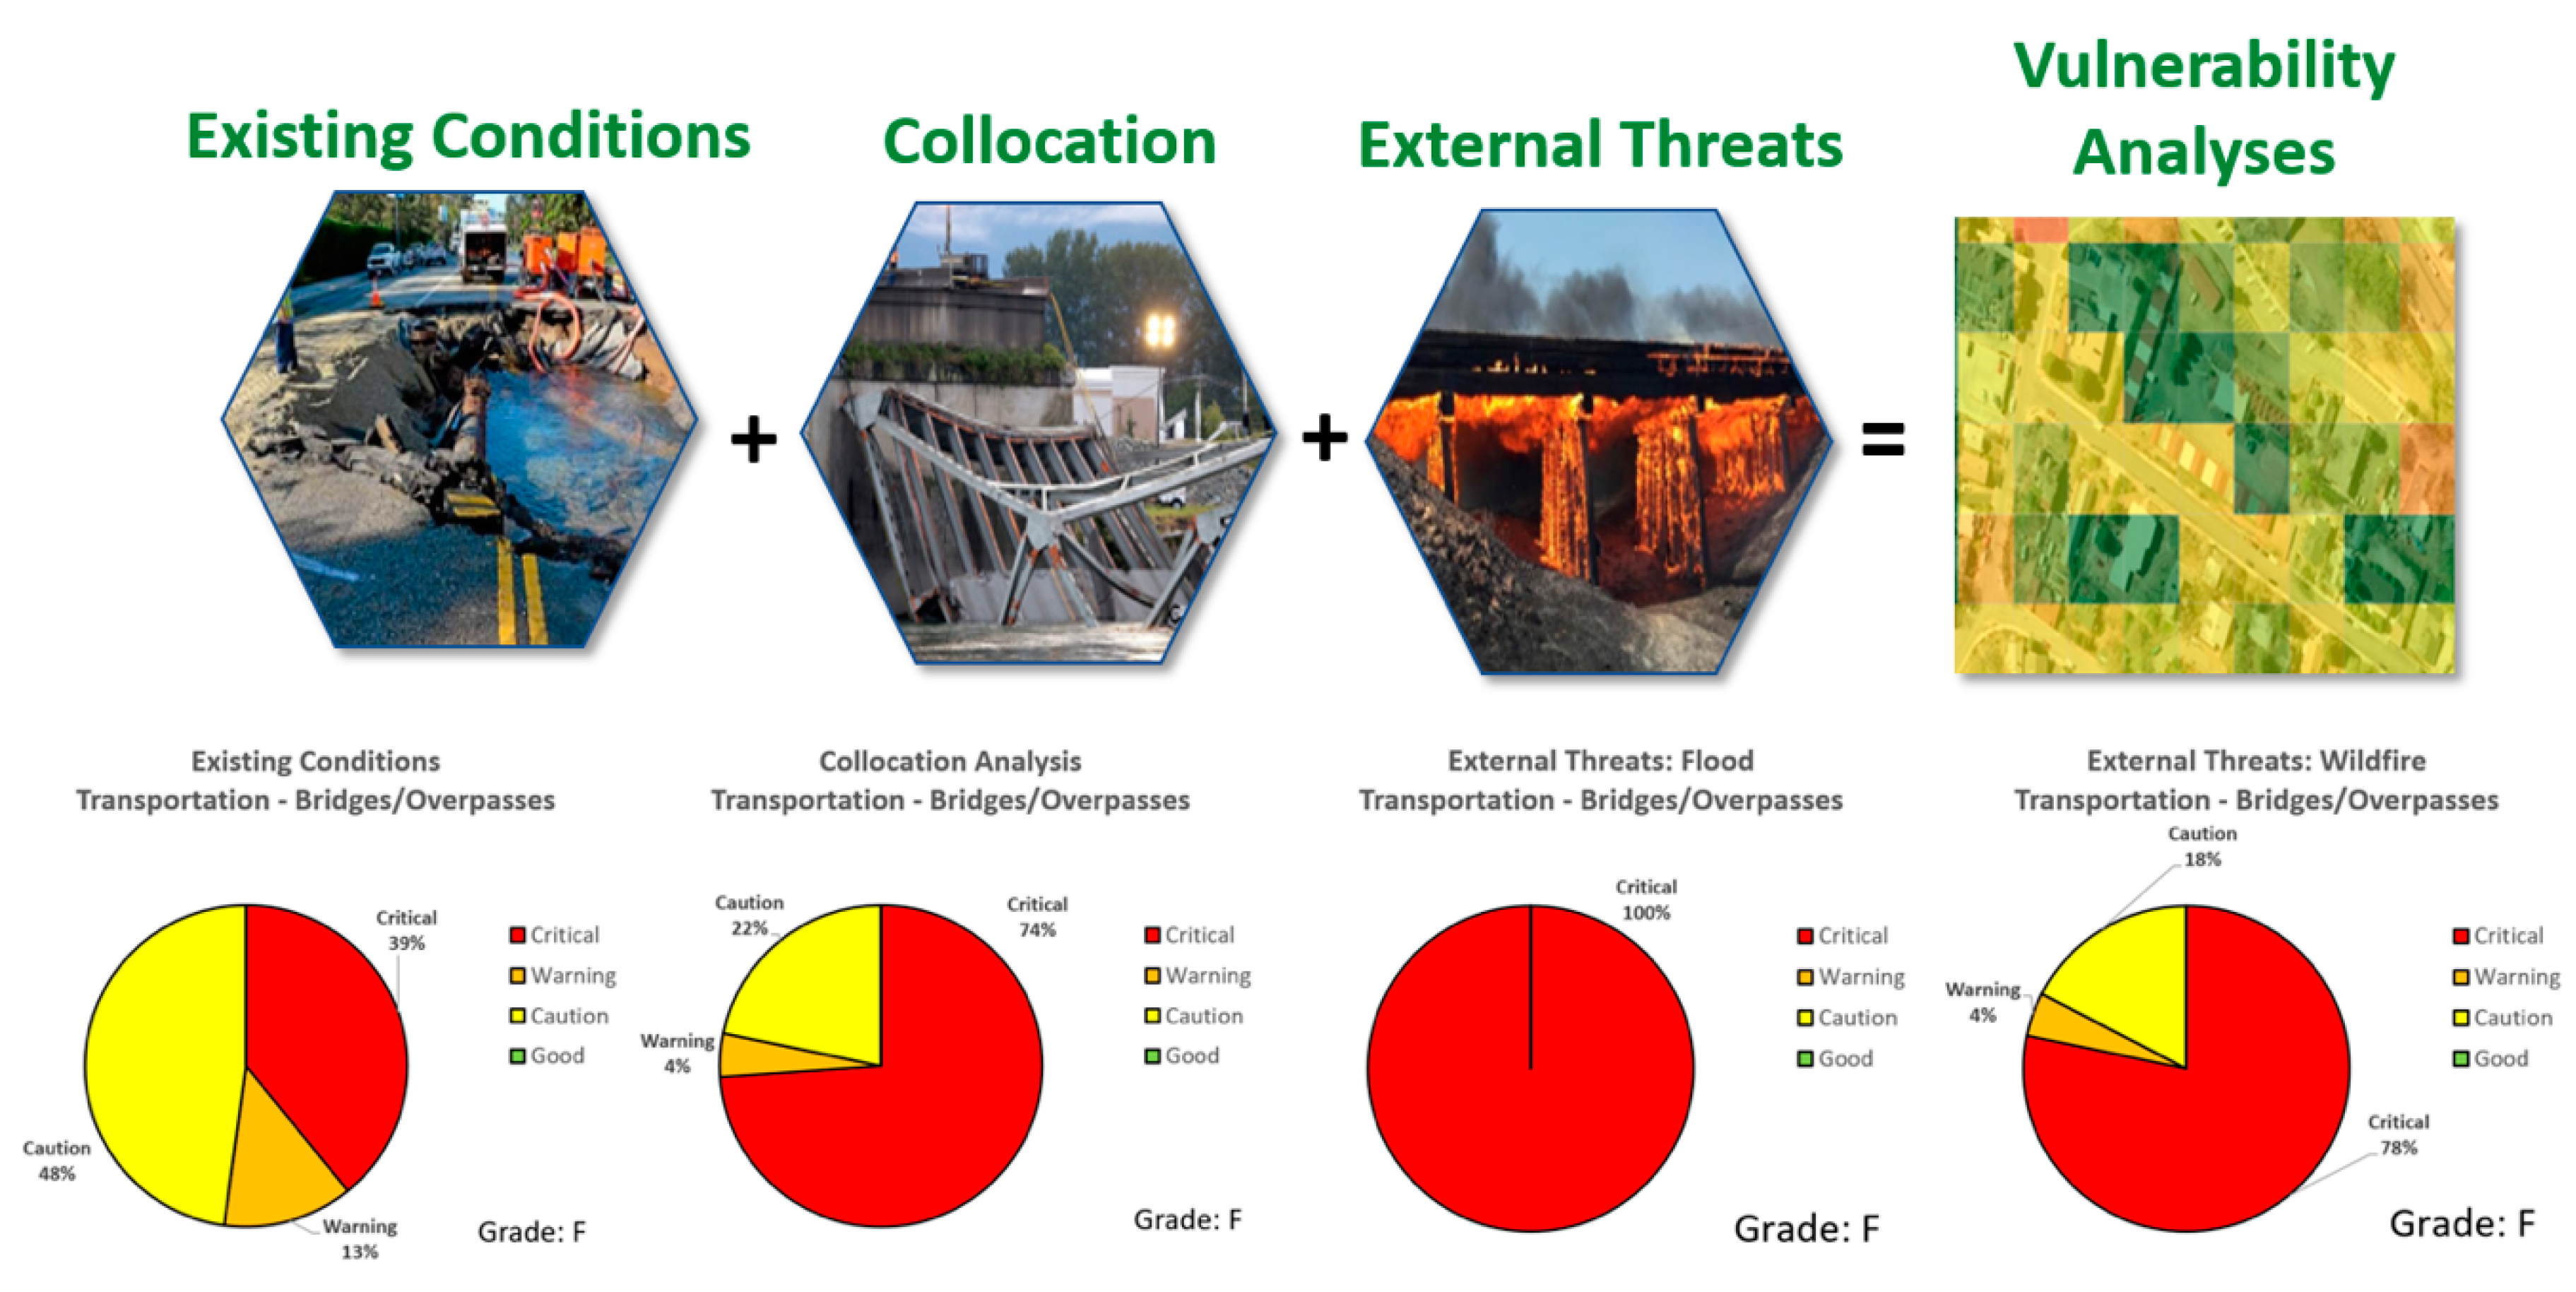
This heatmap concept provides a Cross-Sector-Infrastructure Vulnerability Assessment Model (CSI-VAM) to spatially analyze the potential areas of physical failure and can provide a clear picture as to the extent of existing vulnerabilities and a prioritization of projects that lead along a ‘critical path’ to infrastructure resilience. These analyses, and the MVC concept are shown in Figure 2. The pie charts in Figure 2 provide an example of how the vulnerability assessment of one foundational infrastructure sector or subsector, e.g., Natural Gas Laterals, could change under these different analyses. For example, viewed from left to right, the subsector vulnerability changes due to collocation or various natural hazards.
Figure 2 provides a roadmap that expands from the typical single sector infrastructure analysis to a systemic cross-sector assessment. By considering how these assets are actually placed in a city, the collocation analyses can show a new level of actual vulnerabilities. By then integrating anticipated impacts from natural disasters, a city can generate a new KPI—MVCs that need to be considered in the CIP. In addition to these infrastructure resilience related indicators, KPI’s related to climate action planning also need to be considered for tying into the CIP to understand the connections between a city’s carbon footprint and its infrastructure vulnerabilities. A baseline tool, such as the IICIP, would provide a baseline infrastructure vulnerabilities tool for modeling scenarios for efficient project prioritization, but also for a longer-term discussion as infrastructure sectors change or go obsolete over time. The next subsection introduces the connection between a city’s carbon footprint and its infrastructure vulnerabilities.
3.3. Connecting a City’s GHG Inventory with Infrastructure Vulnerabilities: GHG-IV
Although climate action planning often involves capital investment projects, the process for integrating priorities across multiple city utility departments remains complicated, or even neglected. This typically results in climate action being mitigative and reactive to the existing built environment, rather than proactive. However, a proactive approach is required for city climate resilience plans, such as PlaNYC, to meet their stated goals of ensuring that “… neighborhoods, the economy, and public services are prepared to withstand and emerge stronger from the impacts of climate change” [24]. Heat waves and drought, flooding and storm surges, wind, heavy snowfalls, and other extreme weather events exact increasingly heavy tolls on the world’s cities, with 70% of cities already dealing with the effects of climate change [25]. These extreme events are expected to increase in both severity and frequency, particularly as the global average surface temperature is projected to increase around 2–4 degrees C by the end of the 21st century [26], leading aging and weakened infrastructures to collapse under the added environmental pressures and creating additional negative feedbacks that threaten health and economy [27]. Cities are particularly vulnerable to disruptions in essential infrastructure services due to the substantial interdependency among these systems. In the USA, 2017 was a historic year for weather and climate related disasters costing an unprecedented $306.2 billion in damages and substantially disrupting essential infrastructure services, ranging from multiple billion-dollar wildfires, three tropical cyclones, eight severe storms, two inland floods, and drought. The frequency of these billion-dollar extreme events has increased from 5.8 in 1980–2016 to 11.6 from 2013–2017, suggesting an urgency and imperative for cities to plan for increasing the resilience of infrastructure in the face of climate change [28].
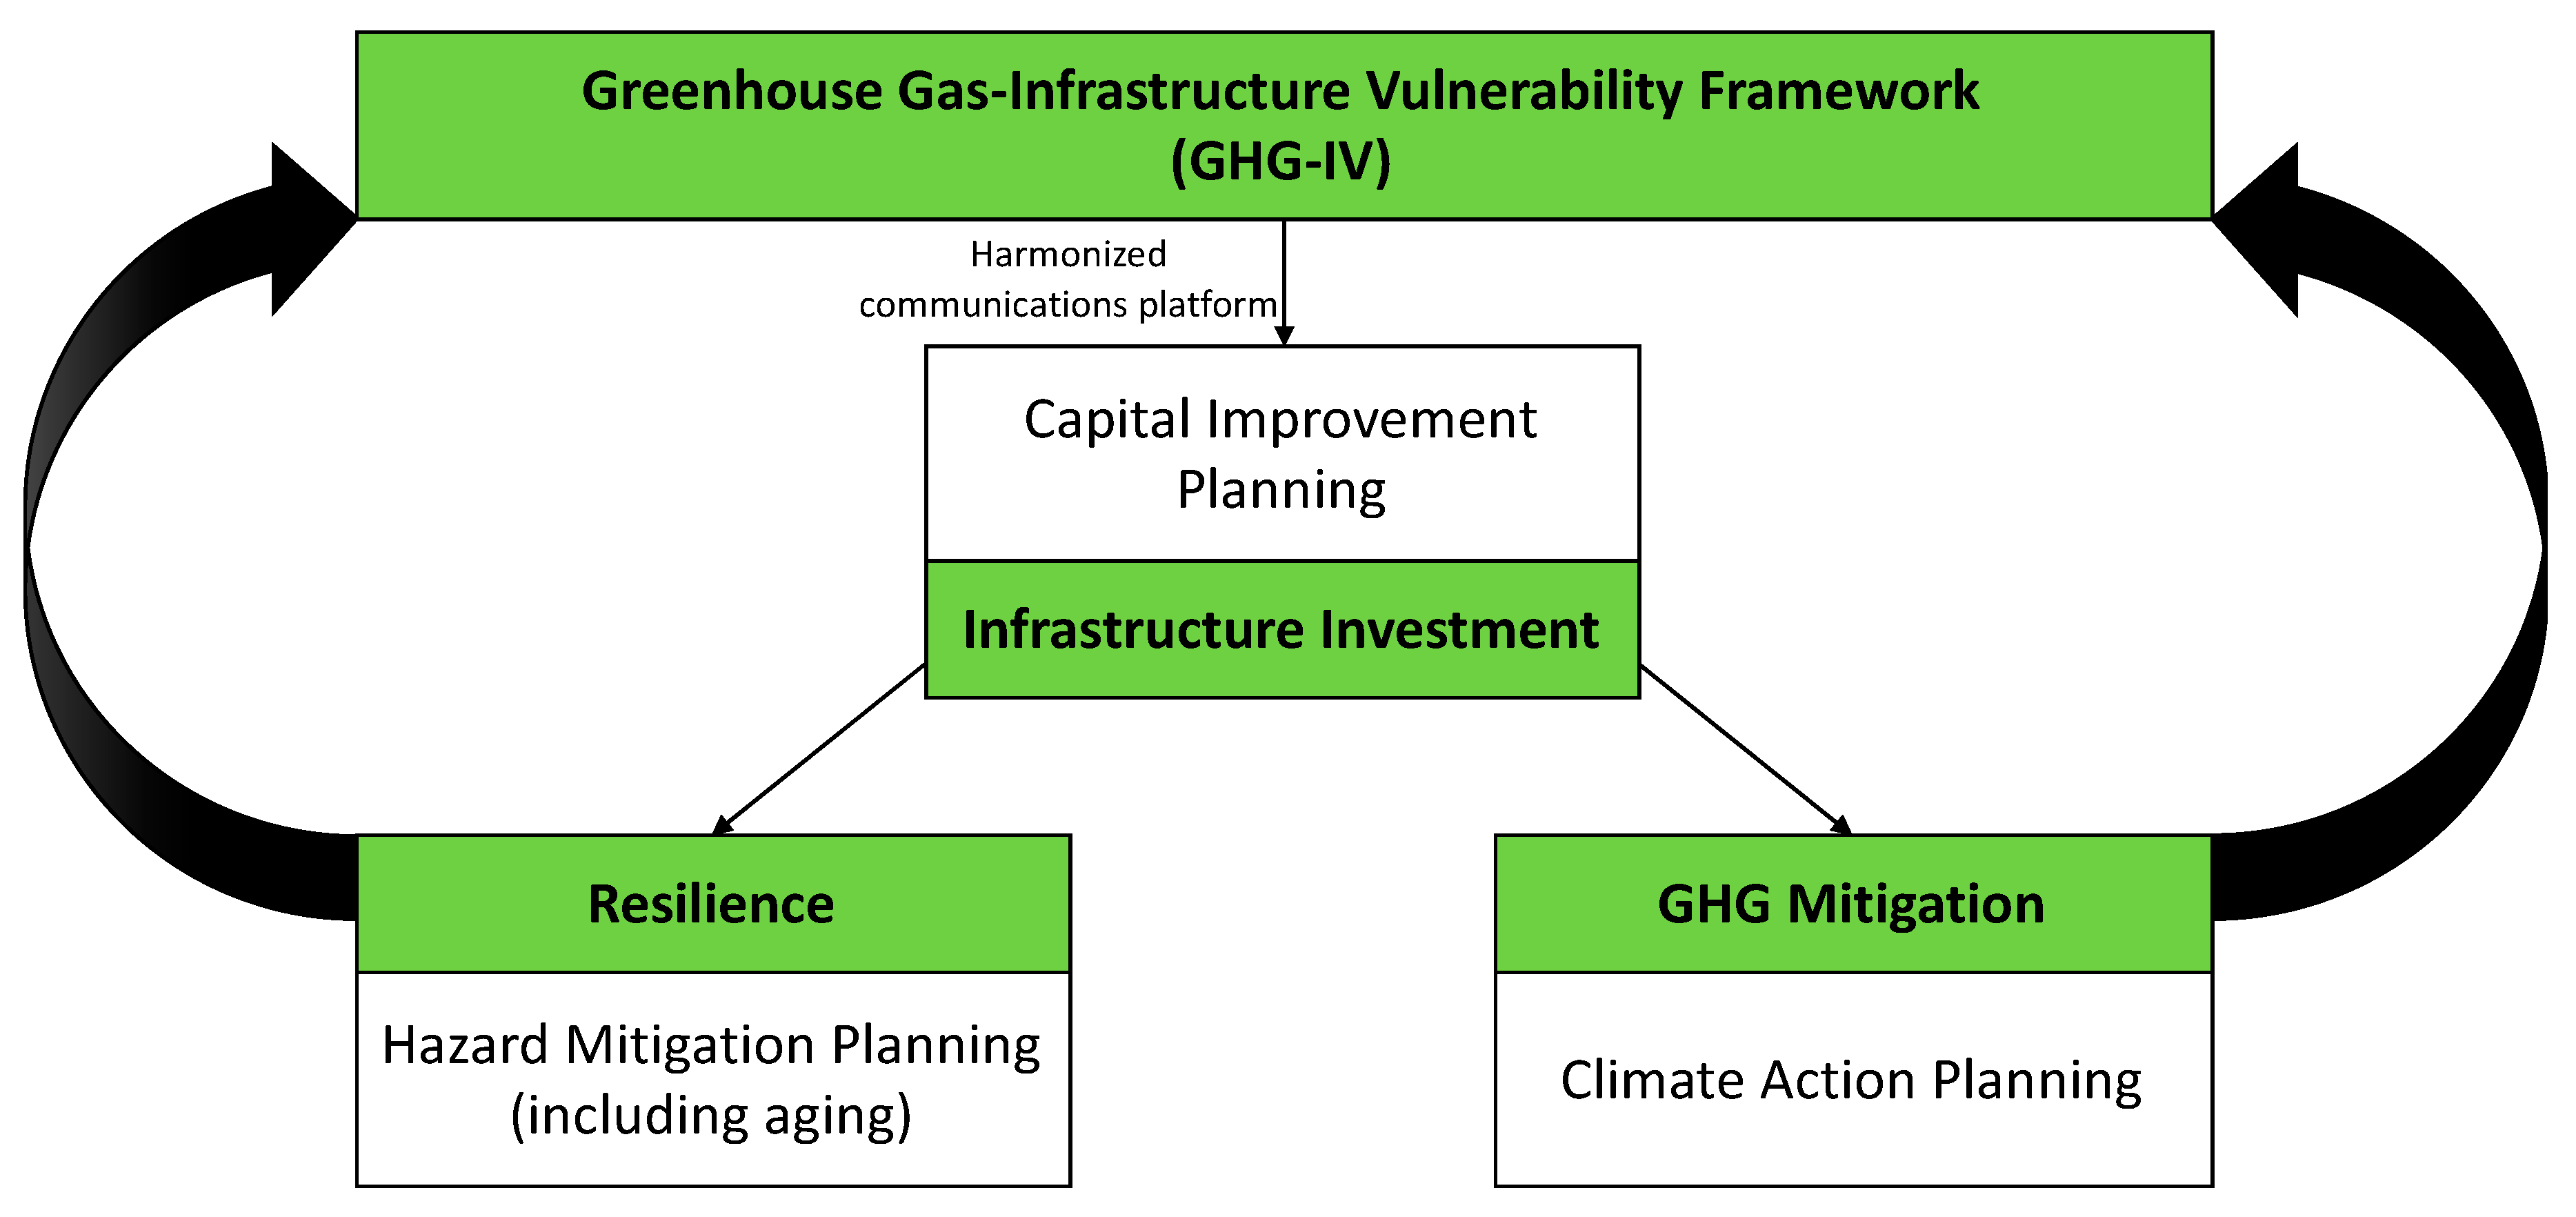
While the reliability and resilience of city infrastructure systems are affected by climate change related events, these same systems are also key levers for mitigating the GHG emissions that would reduce the long-term risks of extreme climate change and related events. Globally, infrastructure and the provision of key resources to support life in cities contribute to 87% of GHG emissions and 97% of water withdrawals [29]. From both a carbon mitigation and a resource use perspective, these infrastructure sectors are critical drivers of change. While the baseline vulnerability and risk to these sectors informs resilience plans, to date, there has been no framework to connect priorities between climate action, hazard mitigation, resilience, and the CIP process. Adding to the number of siloed information sources in the CIP process, climate action and resilience planning are often undertaken by different agencies in the municipal governments, such as environmental health, sustainability, and safety and urban planning. Each of these silos often neglect the potential synergies that exist. Additionally, climate action planning has generally focused on action of the producer (e.g., electric generator, water utility, or wastewater treatment plant) or the end-user (i.e., homes, businesses, and industry) rather than the foundational infrastructures that enables the producer or end user emission generating activities to occur. Therefore, a framework that can harmonize climate action outcomes with infrastructure vulnerability/resilience metrics relevant to the CIP process is necessary to fully integrate and financially support the intended resilience and sustainability outcomes. This framework is presented as the Greenhouse Gas-Infrastructure Vulnerability (GHG-IV) approach, as shown on Figure 3. By connecting service and reliability characteristics considered in the CIP to sustainability/resilience baseline metrics of the city, this framework would inform which climate interventions would be most feasible and effective given the reliability of the underlying and collocated systems with which climate interventions plug into.
The GHG-IV framework incorporates the internationally accepted protocol for assessing community-wide GHG emissions [7] and reallocates emissions to the foundational infrastructure sectors to better connect with the assets involved in the CIP process, allowing for a common platform for communicating between departmental silos. Pairing the GHG contribution of each foundational infrastructure sector and subsector with geospatial layers detailing infrastructure reliability and vulnerability characteristics and indicators related to age, potential hazards and interdependencies, as discussed above, can provide a baseline to serve as the underpinning for a low-carbon and resilient capital investment plan. The framework provides guidance for integrating such information for an IICIP to prioritize projects and resources more effectively to achieve community resilience and climate change mitigation goals.
3.4. Remedial Secondary Infrastructure—A KPI of Infrastructure Reliability
In cities where GIS information is not available, or reliable, alternative approaches to evaluating the reliability of existing infrastructure can be considered. In addition, although there are numerous indicators for the built environment, there is not enough depth that fully considers the ramifications of infrastructure unreliability. For example, ISO 37120 [30] provides a core indicator: Percentage of city population with potable water supply service. However, this indicator defines a potable water system as:
“…a service that delivers potable water through a pipe or similar duct that is connected to a network, the supply of which is relatively continuous…”
A ‘relatively continuous’ service implies that the water supply is not 24/7 and therefore the system goes unpressurized for a significant portion of the day and becomes susceptible to contamination. It is, therefore, critically important to consider how each infrastructure system functions when developing reliability KPIs. For example, consider a Service Level Benchmarking (SLB) Program carried out by the Government of India’s Ministry of Urban Development (MoUD) in 2006 in 28 cities, which found the average duration of water supply was 3.3 h per day, with a range from one hour every three days to 18 h per day [31]. When water pipes are unpressurized they will easily contaminate the water that is being delivered, i.e., potable water is no longer potable. As a result, residents of the city need to ‘remediate’ the service by purchasing their own water tanks, pumps, and point of use water treatment systems. This depth of reliability investigation can be applied to all seven foundational infrastructure sectors, e.g., intermittent grid interruptions, or lack of municipal solid waste (MSW) service.
When basic services are unreliable in a city, citizens and businesses have to compensate for this unreliability by purchasing personal systems—referred to as remedial secondary infrastructure (RSI) [32]. These RSI purchases include; home water treatment systems, diesel generators, and air filters, to name a few. The need for RSI, particularly diesel generators to compensate for an unreliable power grid or the burning of municipal solid waste (MSW) to compensate for poor sanitation, lead to higher levels of localized air pollution and respiratory disease. RSI has been defined as [32]:
“Privately owned infrastructure required to complement municipal delivery of daily primary infrastructure services when the utility is not providing reliable and high quality basic services.”
The presence of RSI indicates a loss in the scale of economy for supplying basic services, e.g., the water distribution paradigm shifts from ‘treat/distribute/consume’ to ‘treat/distribute/pump/store/re-treat/consume’. The additional pumping, storage, and treatment components come at the expense of the end-user [32]. This has a direct impact on time to obtain and maintain RSI and end-user economics. In fact, 88 percent of the households in Delhi, India pay 4.3 times more for RSI to use water than they pay to purchase the water [33]. These RSI systems create generations-old reliance, and the long-term mistrust in the primary utility’s capacity to provide reliable services, resulting in end users not readily ‘accepting’ new infrastructure. Thus, even if utilities in India transition to 24/7 water supply, the end users may continue to store water and/or to re-treat the municipal water. This creates a discussion as to the approach infrastructure should take, e.g., decentralized or centralized [34].
The type of RSI, by each infrastructure sector, can be mapped onto a city’s GIS platform and overlaid with socioeconomic planning groups to identify connections between the final unit price for each sector (e.g., $USD/kWh or $USD/kL), and set the foundation for examining unit costs, time savings, and behavior acceptance of proposed new systems. For example, wealthier homes and businesses may use individual reverse osmosis units for water and diesel generators for electricity, while lower socioeconomic groups may use no treatment and charcoal, causing potential environmental justice and equity issues. For urban data collection, RSI can be used for assessing trends, and benchmarking against other cities and regions can help track progress toward resiliency and sustainability goals and help identify relevant strategies in peer cities.
4. Vision and Priorities for Action: An Integrated Information CIP Process
The USF recognizes that cities require “integrated urban data processes to promote coordination between government bodies and key stakeholders to support effective knowledge sharing and robust decision making” [2]. However, it is not just data that is required, there are two other key considerations for an effective platform for making complex decisions. The first consideration is recognizing that an effective CIP process is a communications challenge—not just an engineering or data challenge. Cities are flush with data and have created transparent links to these data (e.g., OpenData, OpenGrid, etc.) but the public is unsure as to how this is all connected. The internet of things (IoT) provides data accessibility, but not an organized communications tool. The second consideration is that to galvanize support for change (i.e., to get to the city we want), an effective CIP process recognizes that there are significant behavioral components that need to be overcome. That is, the ‘out-of-sight-out-of-mind’ paradigm is a powerful force that keeps the public disengaged from infrastructure decisions. Without communications that provide tangible information regarding the true costs of not having reliable and resilient infrastructure, the public cannot be expected to change the political climate necessary for elected officials to overcome NIMTOF.
Engaging the public and seeking real input into complex decisions has always been problematic. Commonly, climate action planning includes public stakeholders as it “…engages and empowers various constituencies including those that are most affected by climate change impacts, as well as those particularly well placed to contribute to climate actions” [35]. However, nebulous requirements in climate action planning ask that “Cities conduct vulnerability assessments to identify current and future risks/impacts to people, community assets, and community functions” [35], without defining all infrastructure as ‘assets’ and providing a methodology for accomplishing these tasks. Similarly, protocols offered for city resilience planning, while recognizing the importance of a reliable built environment to support a community’s social institutions, do not provide a methodology for infrastructure assessment [36,37]. Without a methodology for assessing the baseline conditions of a city’s infrastructure systems and the relationship to other city systems (e.g., social, economic, and governance), the city, and public do not have a logical place to start, nor do the resulting CIP priorities align with the city’s sustainability and resilience goals.
While most cities attempt to engage the public as stakeholders for addressing necessary capital improvements through various expert committees (e.g., a ‘task force’), a task force is reliant on the data they receive from each separate utility’s staff and asset management system. They do not have their own information to counter or propose informed alternatives. As such, these task forces simply rely on each department’s reporting of the necessary capital improvement needs, O&M, and deferred needs as reported by that department’s staff [12] and the task force is unable to compare priorities across each of the city’s utilities. The public prioritization processes in the CIP do not provide a methodology nor the integrated information to support credible prioritization of infrastructure needs. An integrated geospatial visioning platform for the CIP would allow the public to view MVCs as KPIs for the overall reliability of city services and better understand the relationship of collocated multiple infrastructure systems.
This integrated information visioning requires a paradigm shift to not only identify the existing ‘communication breakdowns’ in the CIP process among key stakeholder groups, but also identify relevant information for the stakeholders and tools to effectively integrate disparate priorities. Previous work [12] has identified four such communication breakdowns in the typical municipal CIP process: (a) intra-departmental; (b) public to governance (‘governance’ refers to the CIP decision authority); (c) public utility to governance; and (d) private utility to governance. These communication barriers need to be resolved in order to achieve the intent of the New Urban Agenda’s “…commitment to sustainable urban development as a critical step for realizing sustainable development in an integrated and coordinated manner at the global, regional, national, subnational and local levels, with the participation of all relevant actors” [38]. Communication is the key to the new IICIP paradigm and converting the existing data into relevant and integrated information for the stakeholder groups of the CIP process is not only achievable but also has the potential to radically transform the process and outcomes [12]. Meeting the information needs of various stakeholder groups requires a robust baseline database, which would include:
- the design-life and replacement rate for each system,
- In lieu of the above, RSI and associated socio-demographics to represent reliability,
- integrating threats of collocation and natural hazards to each system,
- visualizing these threats by simple use of colors to generate a heat map,
- identifying all infrastructure assets by ownership to engage more stakeholders,
- quantifying the connection between a city’s total carbon footprint and the connection to each infrastructure system and the inherent vulnerabilities,
- the degree and location of vulnerabilities to provide valuable insight to the emergency management and can be correlated with sociodemographic data for better planning, and
- how a city’s comprehensive plan addresses existing infrastructure vulnerabilities and how implementation of capital improvements is proactively addressing natural hazards and systems’ vulnerabilities.
The information in this paradigm for the prioritization of projects must be established when a city sets the vision for the ‘city we want’—or USF’s Stage 2—Vision and Priorities for Action. Changing current municipal CIP practices from siloed and isolated decision-making into an integrative process will require three things: (1) an integrated data platform that communicates the true status of all the city’s infrastructure vulnerabilities and associated GHG footprint; (2) integrative decision-making process between the city governance and city utilities and departments; and (3) a robust public engagement process that better communicates the city’s current infrastructure vulnerabilities [12] and associated community-wide GHG emissions. An integrative CIP process such as this will inherently need to be iterative, requiring inputs from various stakeholders to not only understand baseline existing conditions, vulnerabilities and emissions but also for iteratively assessing and synthesizing investment scenarios to understand the implications for increasing reliability, meeting infrastructure resilience, and GHG emission mitigation goals.
Prioritizing projects within the CIP process, as championed from within city government, is challenging enough. The needs, and vulnerabilities, of private utilities that are franchised to provide basic services, are typically not integrated into the CIP process. New demands for climate-smart cities often fall peripheral to the CIP process, yet need to be integrated in the CIP as a city only achieves resilience when its infrastructure assets can absorb and bounce back from the catastrophic threats it faces. A climate-smart CIP should guide cities to establish a baseline of existing infrastructure vulnerabilities from age, collocation, and natural disasters. With these new considerations, and KPIs, in mind, better connections to prioritized CIP investments could extend across government silos to include improvements in urban planning, disaster response, and/or financial management.
5. Conclusions
The USF promotes direct linkages to the metrics in SDG 11 to “Make cities and human settlements inclusive, safe, resilient and sustainable” [39]. However, curiously, the USF does not prioritize linkages to SDG 9 that has the goal to: “Build resilient infrastructure, promote inclusive and sustainable industrialization and foster innovation” [40]. In fact, SDG 9 is not mentioned in the USF, even though the connection between infrastructure and the economy of a city are cited throughout [2]:
“Urban economic development is intricately linked to—and often a prerequisite for—service delivery, investments in infrastructure, and poverty reduction in cities.”
That is, reliable and resilient infrastructure is foundational to a thriving city economy. SDG 9 speaks to this issue and its relation to a city’s economic vitality, recognizing that “Aging, degraded or non-existent infrastructure makes conducting good business challenging” [40]. This is a critical topic to consider as our utilities, governments and various frameworks promote extending the remaining useful life of assets. While this recommendation seems economically sound, there are significant ramifications to consider of allowing a paradigm of aging infrastructure. For example, the Los Angeles, California water system will have, within 10 years, 90 percent of their water mains (12,200 km) exceeding the AWWA recommended design-life [41]. For scale, the kilometers of water main in Los Angeles that will exceed design-life is the approximate driving distance from Miami, Florida to Seattle, Washington—roundtrip! In addition, given the current paradigm of burying our distribution infrastructure below paved streets, replacing each kilometer of L.A.’s water system has a direct impact on the city’s transportation, economics, and public safety. However, because the L.A. Department of Water and Power (DWP) is using remaining useful life of the assets, the current $1.3 billion plan is to replace only 700 km of deteriorating pipe in the next 10 years (5.7 percent) [41]. As a result, Los Angeles is an example of a city with a plethora of open access data (e.g., http://geohub.lacity.org/) yet averages about three water main breaks a day across the city.
The GHG-IV framework can help provide the necessary KPIs to better connect climate action priorities to the CIP, helping government officials understand the alignment of various internal and external stakeholder priorities—and thus simplifying the communications with the public. When the overall objective is to maintain and provide reliable services to a growing population, that can sustain environmental ‘shocks’, the objectives to achieve this goal may be aligned if common KPIs can be applied that show the connection between resilient infrastructure and actions to reduce climate change. That is, KPIs must not only track infrastructure vulnerabilities, but also the progress of climate mitigation/resilience outcomes. This is also the intent of the USF Stages 2 and 3 (Part I of the USF) to be “…carried out in parallel to ensure correlation between the project visioning and the financing” [2].
To meet the many resilience and sustainability goals set forth by the world’s cities, the CIP process must evolve to integrate multiple existing sources of information across departmental silos to effectively prioritize improvement resources. This paper proposed a paradigm for an effective CIP process; a systems framework for viewing synergies between soft and hard infrastructure; identified new KPIs for infrastructure reliability (for developed and developing nations); and, pathways for integrating the GHG footprint with infrastructure vulnerabilities. In summary, to facilitate an effective IICIP, cities must be enabled to: (1) integrate existing priorities across multiple city departments by streamlining the process of analysis in order to facilitate the creation of a holistic systems-level priority; (2) comprehensively visualize data on all infrastructure systems and identify the key vulnerabilities and risks on all infrastructure systems to find locations of highest risk within a city; and (3) develop a baseline that enables systems thinking and proactive analysis by understanding the vulnerability and GHG emissions attributable to all foundational infrastructure systems, to identify those most pertinent for climate action and resilience.
Author Contributions
All authors contributed equally to this work.
Funding
This research received no external funding.
Conflicts of Interest
The authors declare no conflict of interest.
References
- Rockefeller Foundation. City Resilience Framework; Rockefeller Foundation: New York, NY, USA, 2015. [Google Scholar]
- Wang, X.; Salat, S.; Painter, D. Urban Sustainability Framework (USF): First Edition; World Bank: Washington, DC, USA, 2018. [Google Scholar]
- Kaganova, O. Guidebook on Capital Investment Planning for Local Governments; Urban Development Series; World Bank: Washington, DC, USA, 2011. [Google Scholar]
- Egler, H.-P.; Frazao, R. Sustainable Infrastructure and Finance: How to Contribute to a Sustainable Future. 2016. Available online: http://unepinquiry.org/wp-content/uploads/2016/06/Sustainable_Infrastructure_and_Finance.pdf (accessed on 2 March 2018).
- United Nations. World Urbanization Prospects: The 2014 Revision; United Nations: New York, NY, USA, 2014. [Google Scholar]
- Institute for Sustainable Infrastructure Envision: Driving success In Sustainable Infrastructure Projects. Available online: https://sustainableinfrastructure.org/envision/envision-v3-release/ (accessed on 2 March 2018).
- Fong, W.K.; Sotos, M.; Doust, M.; Schultz, S.; Marques, A.; Deng-Beck, C. Global Protocol for Community-Scale Greenhouse Gas Emission Inventories; World Resources Institute: New York, NY, USA, 2014. [Google Scholar]
- Ramaswami, A.; Russell, A.; Chertow, M.; Hollander, R.; Tripathi, S.; Lei, S.; Cui, S.; Nagpure, A.S. International, Interdisciplinary Education on Sustainable Infrastructure and Sustainable Cities: Key Concepts and Skills. Bridg 2014, 44, 11–21. [Google Scholar]
- OECD. Fostering Investment in Infrastructure; OECD: Paris, France, 2015. [Google Scholar]
- Multihazard Mitigation Council. Natural Hazard Mitigation Saves: 2017 Interim Report; Multihazard Mitigation Council: Washington, DC, USA, 2017. [Google Scholar]
- Folkman, S. Water Main Break Rates in the USA and Canada: A Comprehensive Study. 2018. Available online: https://digitalcommons.usu.edu/cgi/viewcontent.cgi?article=1173&context=mae_facpub (accessed on April 4 2018).
- Reiner, M.; Cross, J. Addressing the Infrastructure Decay Rate in US Cities. Handb. Sustain. Resil. Infrastruct. 2018. under review. [Google Scholar]
- Rodin, J. The Resilience Dividend: Being Strong in a World Where Things Go Wrong; Public Affairs; Profile Books: London, UK, 2014; Volume 5, ISBN 1610394704. [Google Scholar]
- Silva, J.D. City Resilience Index—Understanding and Measuring City Resilience. Available online: https://www.arup.com/perspectives/themes/cities/city-resilience-index (accessed on June 22 2016).
- Reiner, M.; McElvaney, L. Foundational infrastructure framework for city resilience. Sustain. Resil. Infrastruct. 2017, 2, 1–7. [Google Scholar] [CrossRef]
- ASCE. 2017 Infrastructure Report Card: A Comprehensive Assessment of America’s Infrastructure; ASCE: Reston, VA, USA, 2017. [Google Scholar]
- American Water Works Association. Buried No Longer: Confronting America’s Water Infrastructure Challenge; American Water Works Association: Denver, CO, USA, 2011. [Google Scholar]
- Denver Water Pipe Replacement. Available online: https://www.denverwater.org/project-updates/pipe-replacement (accessed on 8 July 2017).
- The Water Research Foundation Knowledge Portals- Asset Management Breaks & Leaks FAQ’s. Available online: http://www.waterrf.org/knowledge/asset-management/breaks-leaks/Pages/faqs.aspx (accessed on 22 May 2018).
- ASCE. 2017 Infrastructure Report Card: Grading Scale. Available online: https://www.infrastructurereportcard.org/making-the-grade/what-makes-a-grade/ (accessed on 1 April 2017).
- STAR Communties Sustainability Tools for Assessing and Rating Communities. Available online: http://www.starcommunities.org/ (accessed on 1 April 2018).
- FEMA. Integrating Manmade Hazards into Mitigation Planning; FEMA: Washington, DC, USA, 2003. [Google Scholar]
- FEMA. Technological Hazards. Available online: http://www.fema.gov/technological-hazards (accessed on 2 June 2017).
- Bloomberg, M.M.R. A Stronger, More Resilient New York; New York, NY, USA, 2013; Available online: https://www.nycedc.com/resource/stronger-more-resilient-new-york (accessed on 25 June 2018).
- Muggah, R.; Cities Are on the Front-Line of Climate Change. They must Adapt or Die. Available online: https://www.weforum.org/agenda/2016/10/cities-are-on-the-front-line-of-climate-change-they-must-adapt-or-die/ (accessed on 17 May 2017).
- Betts, R.A.; Collins, M.; Hemming, D.L.; Jones, C.D.; Lowe, J.A.; Sanderson, M.G. When could global warming reach 4 °C? Philos. Trans. R. Soc. A Math. Phys. Eng. Sci. 2011, 369, 67 LP-84. [Google Scholar] [CrossRef] [PubMed]
- Cutter, S.; Solecki, B.; Bragado, N.; Carmin, J.; Fragkias, M.; Ruth, M.; Wilbanks, T.J. Chapter 11: Urban Systems, Infrastructure, and Vulnerability. Climate Change Impacts in the United States: The Third National Climate Assessment; U.S. Global Change Research Program: Washington, DC, USA, 2014.
- Melillo, J.; Richmond, T.; Yohe, G. Climate Change Impacts in the United States: The Third National Climate Assessment; U.S. Global Change Research Program: Washington, DC, USA, 2014.
- Ramaswami, A.; Russell, A.; Culligan, P.; Sharma, K.R.; Kumar, E. Meta-principles for developing smart, sustainable, and healthy cities. Science 2016, 352, 940–943. [Google Scholar] [CrossRef] [PubMed]
- ISO. Sustainable Development of Communities: Indicators for City Services and Quality of Life; ISO: Geneva, Switzerland, 2010; p. 112. [Google Scholar]
- Franceys, R.; Jalakam, A. The Karnataka Urban Water Sector Improvement Project: 24x7 Water Supply is Achievable; World Bank: Washington, DC, USA, 2010. [Google Scholar]
- Reiner, M.B.; Ramaswami, A. What Is Remedial Secondary Infrastructure? Implications for Infrastructure Design, Policy for Sustainability, and Resilience. J. Infrastruct. Syst. 2016. [Google Scholar] [CrossRef]
- Dutta, V. Preference Heterogeneity, Public Choice and Willingness to Pay: Study of Water Supply Reform in a Mega City; Teri University: Delhi, India, 2006. [Google Scholar]
- Fisher, S.; Reiner, M.B.; Sperling, J. Unreliable sustainable infrastructure: Three transformations to guide cities towards becoming healthy “Smart Cities.” In International Conference on Sustainable Infrastructure 2017: Policy, Finance, and Education, Proceedings of the International Conference on Sustainable Infrastructure, New York, NY, USA, 26–28 October 2017; ASCE: Reston, VA, USA, 2017. [Google Scholar]
- UN-Habitat. Guiding Principles for City Climate Action Planning; UN-Habitat: Nairobi, Kenya, 2015. [Google Scholar]
- Reiner, M.; Rouse, D. Dependency model: Reliable infrastructure and the resilient, sustainable, and livable city. Sustain. Resilient Infrastruct. 2017, 9689, 1–6. [Google Scholar] [CrossRef]
- SNIST. Community Resilience Planning Guide for Buildings and Infrastructure Systems; NIST: Gaithersburg, MD, USA, 2016; Volume 20.
- UN-Habitat III. New Urban Agenda; United Nations: Quito, Ecuador, 2017; ISBN 9789211327311. [Google Scholar]
- United Nations. Sustainable Development Goal 11; United Nations: New York, NY, USA, 2017. [Google Scholar]
- United Nations. Sustainable Development Goal 9; United Nations: New York, NY, USA, 2017. [Google Scholar]
- Poston, B.; Stevens, M. L.A.’s Aging Water Pipes: A $1-Billion Dilemma. 16 February 2015. Available online: http://graphics.latimes.com/la-aging-water-infrastructure/ (accessed on 25 June2018).
Figure 1.
Foundational Infrastructure Framework (FIF) of a city’s built environment represents a hierarchical interdependent systems framework that make up the holistic function of cities. Adapted from Reiner and McElvaney (2017) [15].
Figure 1.
Foundational Infrastructure Framework (FIF) of a city’s built environment represents a hierarchical interdependent systems framework that make up the holistic function of cities. Adapted from Reiner and McElvaney (2017) [15].

Figure 2.
Series of geospatial analyses to produce Most Vulnerable Cells (MVC—at far right) within a city to help prioritize projects in the CIP.
Figure 2.
Series of geospatial analyses to produce Most Vulnerable Cells (MVC—at far right) within a city to help prioritize projects in the CIP.

Figure 3.
Connecting resilience and GHG mitigation to capital improvement planning through the GHG-IV Framework.
Figure 3.
Connecting resilience and GHG mitigation to capital improvement planning through the GHG-IV Framework.

© 2018 by the authors. Licensee MDPI, Basel, Switzerland. This article is an open access article distributed under the terms and conditions of the Creative Commons Attribution (CC BY) license (http://creativecommons.org/licenses/by/4.0/).
Share and Cite
MDPI and ACS Style
Reiner, M.; Pelton, R.; Fang, A. Integrating a City’s Existing Infrastructure Vulnerabilities and Carbon Footprint for Achieving City-Wide Sustainability and Resilience Goals. Urban Sci. 2018, 2, 53. https://doi.org/10.3390/urbansci2030053
AMA Style
Reiner M, Pelton R, Fang A. Integrating a City’s Existing Infrastructure Vulnerabilities and Carbon Footprint for Achieving City-Wide Sustainability and Resilience Goals. Urban Science. 2018; 2(3):53. https://doi.org/10.3390/urbansci2030053
Chicago/Turabian StyleReiner, Mark, Rylie Pelton, and Andrew Fang. 2018. "Integrating a City’s Existing Infrastructure Vulnerabilities and Carbon Footprint for Achieving City-Wide Sustainability and Resilience Goals" Urban Science 2, no. 3: 53. https://doi.org/10.3390/urbansci2030053