COVID-19

This is the effect coronavirus has had on air pollution all across the world

A Central Industrial Security Force (CISF) personnel stands guard inside the empty premises of the historic Taj Mahal during a 21-day nationwide lockdown to slow the spreading of the coronavirus disease (COVID-19), in Agra, India, April 2, 2020. REUTERS/Sunil Kataria - RC2BWF9PU6E0

There has been a dramatic reduction of smog in India since the lockdown started. Image: REUTERS/Sunil Kataria

Marco Hernandez
Data Visualization Developer, Reuters Graphics
Share:
Our Impact
What's the World Economic Forum doing to accelerate action on COVID-19?
The Big Picture
Explore and monitor how COVID-19 is affecting economies, industries and global issues
A hand holding a looking glass by a lake
Crowdsource Innovation
Get involved with our crowdsourced digital platform to deliver impact at scale
Stay up to date:

COVID-19

  • The coronavirus pandemic has lead to an increase in air quality all around the world. Lockdowns have resulted in factories and roads shutting, thus reducing emissions.
  • These 11 visualizations, using data from NASA’s Global Modeling and Data Assimilation team, show the dramatic impact lockdown measures have had on pollution levels.

To contain the coronavirus pandemic, billions of people have been told to stay at home. In China, authorities placed almost half a billion people under lockdown, the equivalent of nearly 7% of the world’s population. Many other countries have since taken similar measures, initially in hard-hit Italy and Spain, and more recently in the United States and India.

Have you read?

The restrictions have sent financial markets into free fall. But they have also given residents in some of the world’s most polluted cities something they have not experienced in years: clean air.

Reuters visualisations, based on data from NASA’s Global Modeling and Data Assimilation team, show how concentrations of some pollutants fell drastically after the lockdowns started.

Satellite observations record information on aerosols in the atmosphere. NASA’s model is then able to provide estimates of the distribution of these pollutants close to the Earth’s surface.

China

The maps below show how levels of PM2.5 nitrate fell in China’s Hubei province after the government imposed travel restrictions. Nitrate is one of the components that make up PM2.5, tiny particles, about 3% of the diameter of human hair, that can penetrate deep into the lungs and enter the bloodstream, leading to heart disease, strokes or cancer.

Nitrate aerosols are formed from nitrogen compounds, which can be emitted by human activities, especially burning fuel and diesel.

emissions enviroment air polllution industry co2 sustainability green matter Coronavirus china virus health healthcare who world health organization disease deaths pandemic epidemic worries concerns Health virus contagious contagion viruses diseases disease lab laboratory doctor health dr nurse medical medicine drugs vaccines vaccinations inoculations technology testing test medicinal biotechnology biotech biology chemistry physics microscope research influenza flu cold common cold bug risk symptomes respiratory china iran italy europe asia america south america north washing hands wash hands coughs sneezes spread spreading precaution precautions health warning covid 19 cov SARS 2019ncov wuhan sarscow wuhanpneumonia  pneumonia outbreak patients unhealthy fatality mortality elderly old elder age serious death deathly deadly
PM2.5 Nitrate, weekly averages in China. Image: Reuters Graphics
emissions enviroment air polllution industry co2 sustainability green matter Coronavirus china virus health healthcare who world health organization disease deaths pandemic epidemic worries concerns Health virus contagious contagion viruses diseases disease lab laboratory doctor health dr nurse medical medicine drugs vaccines vaccinations inoculations technology testing test medicinal biotechnology biotech biology chemistry physics microscope research influenza flu cold common cold bug risk symptomes respiratory china iran italy europe asia america south america north washing hands wash hands coughs sneezes spread spreading precaution precautions health warning covid 19 cov SARS 2019ncov wuhan sarscow wuhanpneumonia  pneumonia outbreak patients unhealthy fatality mortality elderly old elder age serious death deathly deadly
Emissions in China. Image: Reuters Graphics

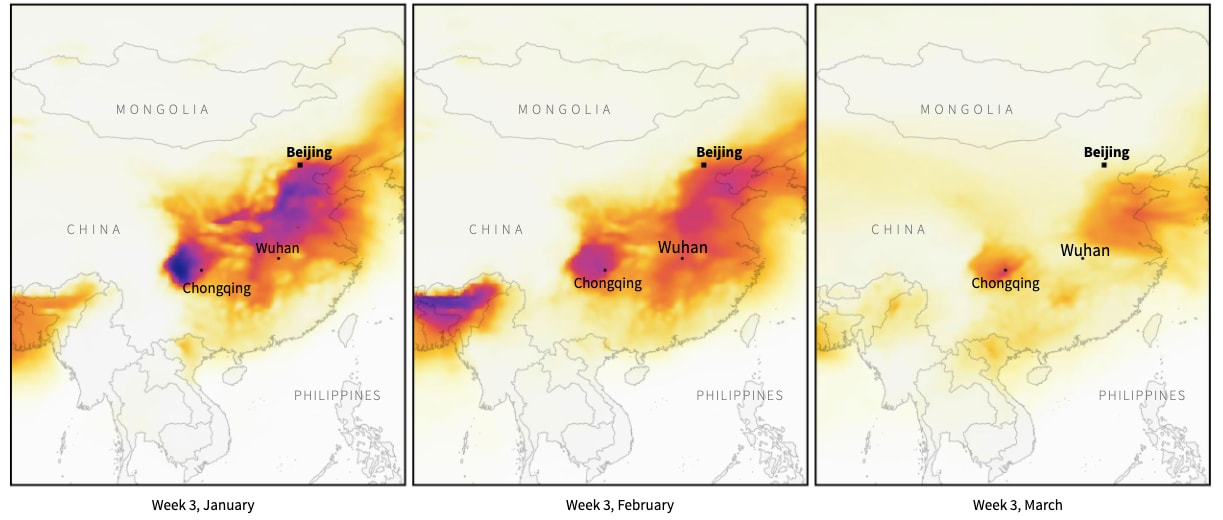
“We may soon learn how much of an impact this temporary pause in pollution has had on human health and the environment, but the clearest takeaway from this event is how satellite measurements of nitrogen compounds can be used as an indicator of economic activity,” said Ryan Stauffer, a research scientist at NASA’s Goddard Space Flight Center.

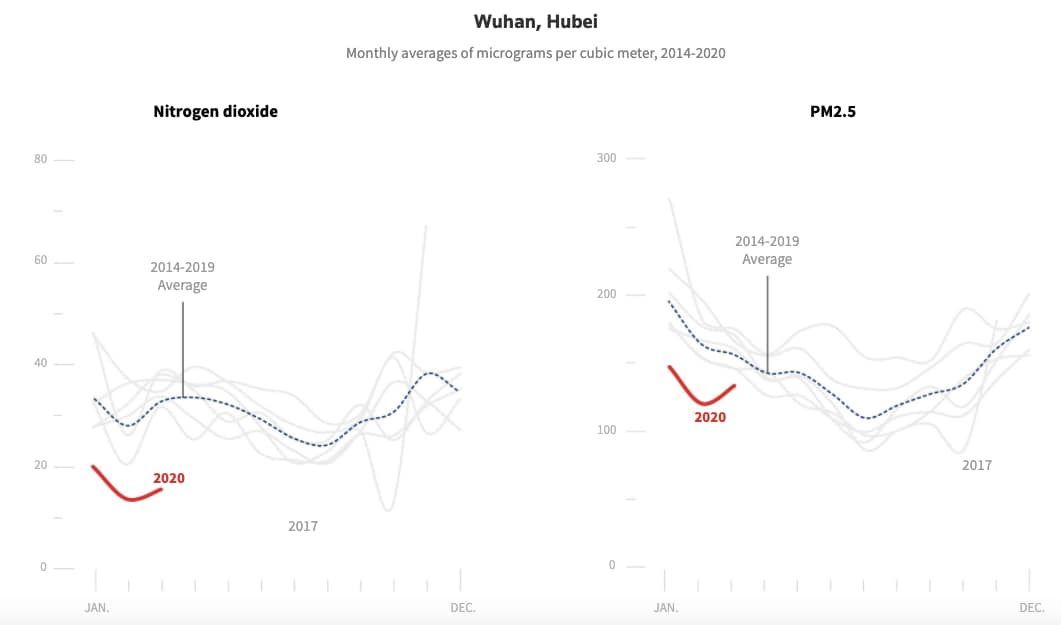
Ground station metrics from Wuhan, where the pandemic originated, show how certain pollutants including nitrogen dioxide were at record lows during the first few months of the year.

Some of the major sources of nitrogen dioxide are vehicle exhausts, power plants and wastewater treatment plants.

Scientists say nitrogen dioxide pollution has been steadily decreasing over the last few years. However, the lockdown may have contributed to this year’s drop.

The following charts show monthly averages of pollutants over the last seven years.
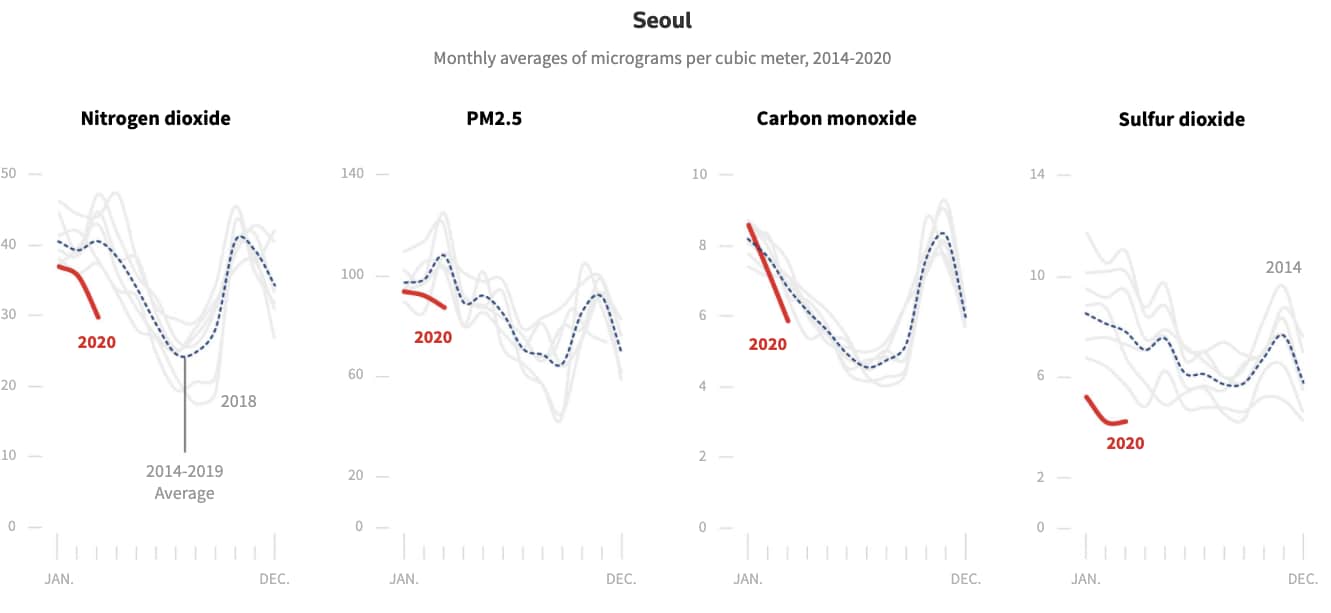
emissions enviroment air polllution industry co2 sustainability green matter Coronavirus china virus health healthcare who world health organization disease deaths pandemic epidemic worries concerns Health virus contagious contagion viruses diseases disease lab laboratory doctor health dr nurse medical medicine drugs vaccines vaccinations inoculations technology testing test medicinal biotechnology biotech biology chemistry physics microscope research influenza flu cold common cold bug risk symptomes respiratory china iran italy europe asia america south america north washing hands wash hands coughs sneezes spread spreading precaution precautions health warning covid 19 cov SARS 2019ncov wuhan sarscow wuhanpneumonia  pneumonia outbreak patients unhealthy fatality mortality elderly old elder age serious death deathly deadly
Monthly averages of micrograms per cubic meter, in Wuhan, Hubei, 2014-2020. Image: Reuters Graphics

South Korea

In early March, South Korea reported a large increase in COVID-19 cases. Since then, ground stations have been measuring the lowest levels of some pollutants for seven years. Although South Korea did not impose major restrictions on residents, changes in daily activity could have contributed to the drop.

emissions enviroment air polllution industry co2 sustainability green matter Coronavirus china virus health healthcare who world health organization disease deaths pandemic epidemic worries concerns Health virus contagious contagion viruses diseases disease lab laboratory doctor health dr nurse medical medicine drugs vaccines vaccinations inoculations technology testing test medicinal biotechnology biotech biology chemistry physics microscope research influenza flu cold common cold bug risk symptomes respiratory china iran italy europe asia america south america north washing hands wash hands coughs sneezes spread spreading precaution precautions health warning covid 19 cov SARS 2019ncov wuhan sarscow wuhanpneumonia  pneumonia outbreak patients unhealthy fatality mortality elderly old elder age serious death deathly deadly
Monthly averages of micrograms per cubic meter, in Seoul, 2014-2020. Image: Reuters Graphics

Italy

Similar patterns unfolded across Italy following the introduction of a nationwide lockdown on March 9. Restrictions had already been implemented in late February in some northern regions, where COVID-19 cases had surged.

The industrial belt across northern Italy often experiences high levels of air pollution, but estimates show otherwise this year.

emissions enviroment air polllution industry co2 sustainability green matter Coronavirus china virus health healthcare who world health organization disease deaths pandemic epidemic worries concerns Health virus contagious contagion viruses diseases disease lab laboratory doctor health dr nurse medical medicine drugs vaccines vaccinations inoculations technology testing test medicinal biotechnology biotech biology chemistry physics microscope research influenza flu cold common cold bug risk symptomes respiratory china iran italy europe asia america south america north washing hands wash hands coughs sneezes spread spreading precaution precautions health warning covid 19 cov SARS 2019ncov wuhan sarscow wuhanpneumonia  pneumonia outbreak patients unhealthy fatality mortality elderly old elder age serious death deathly deadly
PM2.5 Nitrate, weekly averages in Italy. Image: Reuters Graphics
emissions enviroment air polllution industry co2 sustainability green matter Coronavirus china virus health healthcare who world health organization disease deaths pandemic epidemic worries concerns Health virus contagious contagion viruses diseases disease lab laboratory doctor health dr nurse medical medicine drugs vaccines vaccinations inoculations technology testing test medicinal biotechnology biotech biology chemistry physics microscope research influenza flu cold common cold bug risk symptomes respiratory china iran italy europe asia america south america north washing hands wash hands coughs sneezes spread spreading precaution precautions health warning covid 19 cov SARS 2019ncov wuhan sarscow wuhanpneumonia  pneumonia outbreak patients unhealthy fatality mortality elderly old elder age serious death deathly deadly
Emissions in Italy. Image: Reuters Graphics

Of the pollutants that fell most significantly in northern Italy, nitrogen dioxide stood out, according to data recorded at ground stations. Bergamo, one of the provinces most affected by the virus, has experienced improvements in air quality.

emissions enviroment air polllution industry co2 sustainability green matter Coronavirus china virus health healthcare who world health organization disease deaths pandemic epidemic worries concerns Health virus contagious contagion viruses diseases disease lab laboratory doctor health dr nurse medical medicine drugs vaccines vaccinations inoculations technology testing test medicinal biotechnology biotech biology chemistry physics microscope research influenza flu cold common cold bug risk symptomes respiratory china iran italy europe asia america south america north washing hands wash hands coughs sneezes spread spreading precaution precautions health warning covid 19 cov SARS 2019ncov wuhan sarscow wuhanpneumonia  pneumonia outbreak patients unhealthy fatality mortality elderly old elder age serious death deathly deadly
Monthly averages of micrograms per cubic meter, in Bergamo, Lombardy, 2015-2020. Image: Reuters Graphics

India

Every winter, New Delhi and other big cities in the north are enveloped in a blanket of smog as farmers burn crop residue. The air tends to clear a little in spring.

emissions enviroment air polllution industry co2 sustainability green matter Coronavirus china virus health healthcare who world health organization disease deaths pandemic epidemic worries concerns Health virus contagious contagion viruses diseases disease lab laboratory doctor health dr nurse medical medicine drugs vaccines vaccinations inoculations technology testing test medicinal biotechnology biotech biology chemistry physics microscope research influenza flu cold common cold bug risk symptomes respiratory china iran italy europe asia america south america north washing hands wash hands coughs sneezes spread spreading precaution precautions health warning covid 19 cov SARS 2019ncov wuhan sarscow wuhanpneumonia  pneumonia outbreak patients unhealthy fatality mortality elderly old elder age serious death deathly deadly
Lockdown has visibly changed India's air quality. Image: Bhushan Kumar, Sunil Kataria / Reuters.

However, in the first few months of this year, India experienced a significant decline in some pollutants. The lockdown imposed by Prime Minister Narendra Modi on the country’s 1.3 billion people could be a major contributing factor. However, there may also be other factors impacting air quality, according to Pallavi Pant, an air quality scientist at the Health Effects Institute in Boston.

“Air pollution levels are often influenced by local meteorology, like temperature or wind speed. Several early analyses are showing declines in air pollution in regions where shutdowns have taken place. However, any such analyses should consider all relevant factors.” Pallavi Pant told Reuters.

Ground stations in northern India also show a downward trend in overall PM2.5, according to data from local authorities.

emissions enviroment air polllution industry co2 sustainability green matter Coronavirus china virus health healthcare who world health organization disease deaths pandemic epidemic worries concerns Health virus contagious contagion viruses diseases disease lab laboratory doctor health dr nurse medical medicine drugs vaccines vaccinations inoculations technology testing test medicinal biotechnology biotech biology chemistry physics microscope research influenza flu cold common cold bug risk symptomes respiratory china iran italy europe asia america south america north washing hands wash hands coughs sneezes spread spreading precaution precautions health warning covid 19 cov SARS 2019ncov wuhan sarscow wuhanpneumonia  pneumonia outbreak patients unhealthy fatality mortality elderly old elder age serious death deathly deadly
Monthly averages of PM2.5 micrograms per cubic meter, in Lucknow and Delhi, 2015-2020. Image: Reuters Graphics

Beyond improvements in outdoor air quality, scientists are also curious how lockdowns have affected indoor air quality, with millions of people staying at home for far longer than usual.

“As we continue to talk about improvements in outdoor air quality, people are spending a lot more time indoors and the exposure patterns for indoor air pollution might be different at this time too,” said Pant.

Don't miss any update on this topic

Create a free account and access your personalized content collection with our latest publications and analyses.

Sign up for free

License and Republishing

World Economic Forum articles may be republished in accordance with the Creative Commons Attribution-NonCommercial-NoDerivatives 4.0 International Public License, and in accordance with our Terms of Use.

The views expressed in this article are those of the author alone and not the World Economic Forum.

Related topics:
COVID-19Future of the EnvironmentEnergy Transition
Share:
World Economic Forum logo
Global Agenda

The Agenda Weekly

A weekly update of the most important issues driving the global agenda

Subscribe today

You can unsubscribe at any time using the link in our emails. For more details, review our privacy policy.

Winding down COVAX – lessons learnt from delivering 2 billion COVID-19 vaccinations to lower-income countries

Charlotte Edmond

January 8, 2024

About Us

Events

Media

Partners & Members

  • Join Us

Language Editions

Privacy Policy & Terms of Service

© 2024 World Economic Forum