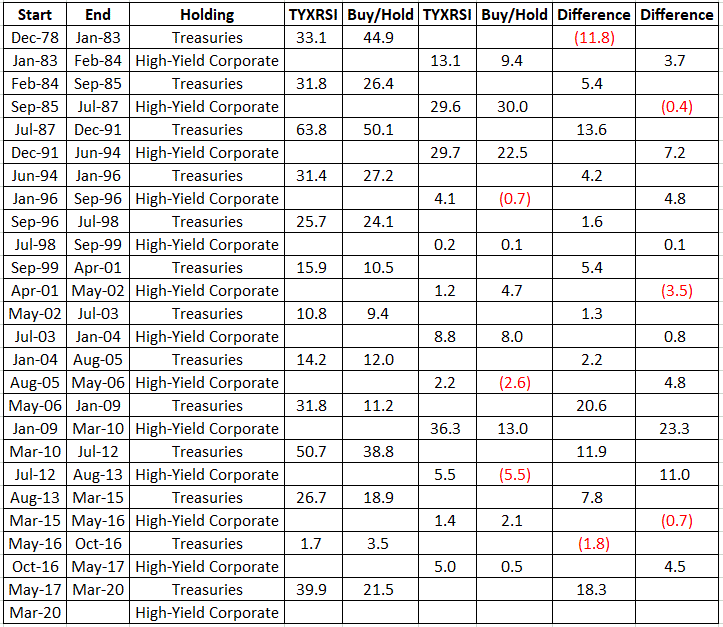
IMPORTANT NOTE: In the original version of this article posted on 4/29/2020 Figure 4 – which contains a listing of the hypothetical trades generated by the strategy contained herein – was in error. The table that appears in Figure 4 below has been corrected.
In this article I highlighted the fact that the best predictor of the expected future return for bonds is their current yield.
In this article I highlighted the fact that interest rates move in long-term trends and that the current roughly 39 year downtrend is getting “a little long in the tooth” and introduced a simple trend-following measure designed to keep you on the right side of the long-term trend in rates.
Finally, in this article I highlighted the performance for long-term treasuries, short-term treasuries and high yield corporate bonds during rising and falling interest rate environments.
What We Know So Far
*Interest rates have been trending lower for roughly 39 years. This WILL NOT last forever
*Even if rates do not reverse higher anytime soon, there is only so much more they can fall
*The bond market environment and the mindset that investors have enjoyed for almost 4 decades is still very much in force, HOWEVER, it is almost certain to evaporate in the years ahead (and chances are very few investors are prepared to deal with this change)
*Long-term treasuries are the place to be when interest rates are falling
*Long-term treasuries ARE NOT the place to be when rates are rising
*Short (and intermediate, i.e., 3-7 year) treasuries perform well in a falling rate environment AND can also perform decently over the course of a rising rate environment. They are also much less volatile than long-term bonds
*High-yield corporate bonds can perform well regardless of the trend in interest rates – as they are much more highly correlated to the stock market and economic trends that impact companies than they are to the long-term treasury yield. The downside is that they can get hurt badly in a recession
Jay’s TYXRSI Method
What follows is “one way” to attack the bond market. It is obviously not the “only way” and certainly no claim is being made that it is the “best way” – but it does address the tendency for:
*Bond yields to rise and fall within a larger up or down trend
*The fact that long-term treasuries perform best when rates are falling
*High yield corporates outperform long-term treasuries when rates are rising
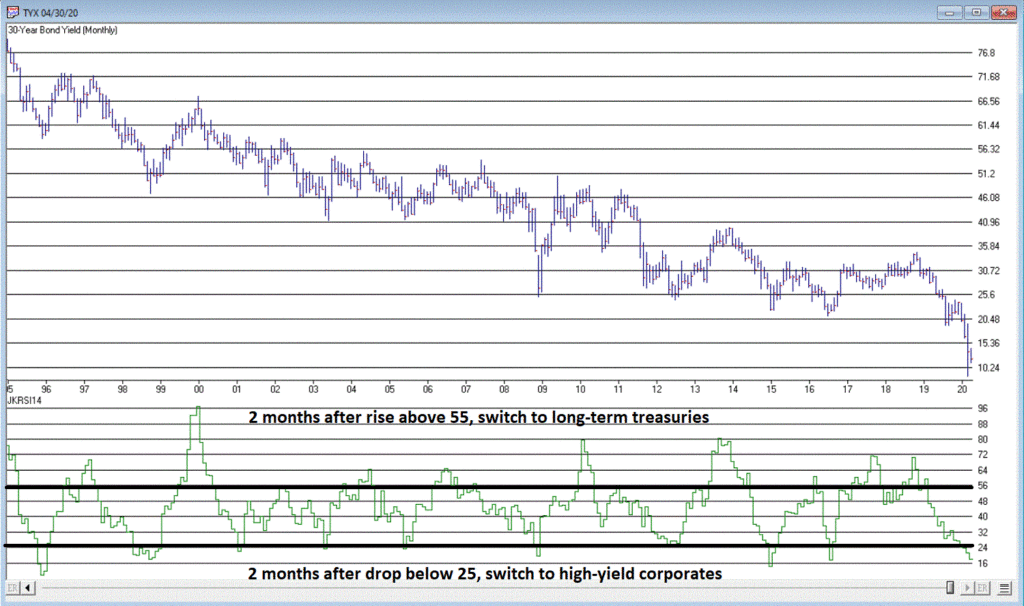
Figure 1 displays ticker TYX ($TYX in a lot of charting software), an index that tracks the yield on 30-year treasury bonds (times 100 for some reason. So, at the end of March 2020 the 30-year treasury yield stood at 1.351%, so TYX was 13.51).
TECHNICAL NOTE: First available data for TYX starts in 1994. Prior to that time, I use the month-end 30-year yield from another source whose name – in all candor – I can’t quite recall. So good time for the “data obtained from sources believed to be reliable” disclaimer.

Figure 1 – Ticker TYX: 30-year treasury yield (x10) (Courtesy AIQ TradingExpert)
Below the chart for TYX is an indicator labeled JKRSI14. It is simply one version of the venerable RSI indicator first introduced by Welles Wilder way back when (calculations are detailed at the end of the article). Note that as TYX falls so does JKRSI14 and vice versa. For our purposes we will use 25 and 55 as our cutoffs for “low” and “high”.
The Trading Rules
*At the end of each month we look at the value for JKRSI14
*If since the end of last month JKRSI14 has dropped from above 25 to 25 or lower, a “sell alert” (for long-term treasuries) occurs
*At the end of the month two months after a sell alert, we sell long-term treasuries and buy high yield corporates
* If since the end of last month JKRSI14 has risen from below 55 to 55 or higher, a “buy alert” (for long-term treasuries) occurs
*At the end of the month two months after a buy alert, we sell high-yield corporates and buy long-term treasuries
And so on and so forth.
Why a 2-month lag between “Alert” and “Trade”?
Bonds tend not to “turn on a dime”. Just because treasury yields are “overbought” at the end of a given month, it does not mean that momentum will immediately reverse and favor high-yield corporates. The 2-month lag gives the current trend a little additional time to “run its course.”
The Data
For testing purposes – and in order to generate as long of a test as possible, we will use the following data for testing purposes:
Long-term treasuries: The Bloomberg Barclays Long Treasury Index from January 1979 through March 2020
High-yield corporates: Vanguard High-Yield Corporate fund (VWEHX) from January 1979 through June 1983, then the Bloomberg Barclays High-Yield Corporate Index after that.
The Results
*Our test starts on 12/31/1978 with long-term treasuries as the favored vehicle, so we will hold the Barclays Long Treasury Index
*The JKRSI14 value for TYX finally dropped below 25 at the end of November 1982. So, two months later – at the close of January 1983, long-term treasuries would be sold and high-yield corporates would be purchased.
*On December 1983 the JKRSI14 value popped back above 55, so at the end of February 1984 the system switched out of high-yield corporates and back into long-term treasuries.
*And so on and so forth.
The last two trades were:
*At the end of March 2017, JKRSI14 popped above 55 so at the end of May 2017 the system moved out of high-yield corporates into long-term treasuries
*At the end of January 2020, JKRSI finally dropped back below 25 so at the end of March 2020 the system moved out of long-term treasuries and back into high-yield corporates.
Comparing TXYRSI Method to Buy-and-Hold
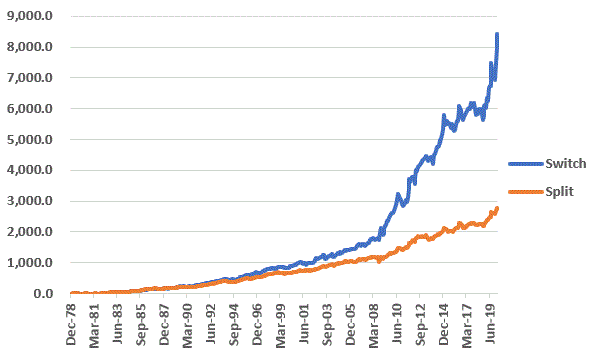
To have a basis of comparison for the strategy, our “benchmark” involves splitting 50/50 between long-term treasuries and high-yield corporates and then rebalancing to 50/50 at the beginning of each year.
Figure 2 displays the cumulative growth for both the TXYRSI Method and the Buy-and-Hold Approach.

Figure 2 – Cumulative Total Return for TXYRSI Method versus Buy-and-Hold (1978-2020)
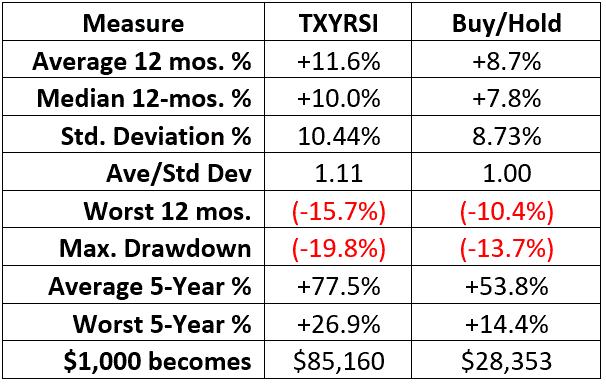
Figure 3 displays the comparative performance of the TYXRSI Method versus Buy-and-Hold

Figure 3 – Comparative Results
Figure 4 shows the individual trade results

Figure 4 – Hypothetical Trade Results
Summary
The TYXRSI Method makes intuitive sense:
*If 30-year treasury yields get “overbought” it suggests that long-term treasuries are oversold relative to other types of bonds, and that a switch into long-term treasuries makes sense.
*Likewise, if 30-year treasury yields are “oversold” it suggests that long-term treasuries are overbought relative to other type of bonds and a switch into high-yield corporate (which can appreciate regardless of the overall trend in interest rates) make sense.
Will this hold up in the future? That’s the question.
A Few Additional Notes
#1. I am looking ahead to the day when rates are no longer in a long-term downtrend. For a number of bond market strategies that I follow I anticipate that when the day comes that TYX trends above it 120-month exponential moving average (see Figure 7 in this article) I will hold intermediate-term (3-7 year) treasuries instead of long-term treasuries when a given strategy calls for treasuries to be held.
#2. Calculations for JKRSI14:
A = this month’s change in TYX
B = if A > 0 then A else 0
C = if A <= 0 then absolute value of A else 0
D = 14-month total of B
E = 14-month total of C
F = D/(D+E)
JKRSI14 = (F * 100)
Jay Kaeppel
Disclaimer: The information, opinions and ideas expressed herein are for informational and educational purposes only and are based on research conducted and presented solely by the author. The information presented represents the views of the author only and does not constitute a complete description of any investment service. In addition, nothing presented herein should be construed as investment advice, as an advertisement or offering of investment advisory services, or as an offer to sell or a solicitation to buy any security. The data presented herein were obtained from various third-party sources. While the data is believed to be reliable, no representation is made as to, and no responsibility, warranty or liability is accepted for the accuracy or completeness of such information. International investments are subject to additional risks such as currency fluctuations, political instability and the potential for illiquid markets. Past performance is no guarantee of future results. There is risk of loss in all trading. Back tested performance does not represent actual performance and should not be interpreted as an indication of such performance. Also, back tested performance results have certain inherent limitations and differs from actual performance because it is achieved with the benefit of hindsight.


Confused by Fig. 4. For example, one is in treasuries from 5/1/17 to 3/31/20 and in high yield corp from 5/1/16 to 10/31/16. What happens between those periods. Can you please explain.
Satish, thank you for the excellent catch! Just before I copied the table originally I changed a link which essentially threw off much of the information. I have updated the article with a corrected table in Figure 4 and a note at the outset stating that the original table was in error and has since been corrected. I appreciate you alerting me to this! Take Care, Jay