
Abstract
A sufficient intake of fruits can alleviate micronutrient deficiencies and reduces the risks of a number of associated diseases. In many parts of sub-Saharan Africa, however, the production and consumption of fruits are inadequate on average and in particular so in specific seasons. To better incorporate fruits into local food systems while addressing the challenge of seasonal availability, World Agroforestry (ICRAF) has developed a methodology based on “fruit tree portfolios” that selects socio-ecologically suitable and nutritionally important fruit tree species for farm production, to meet local consumption needs. We here present this approach and illustrate it with data from a case study involving Western and Eastern Kenya. The approach uses mixed methods to capture on-farm fruit tree diversity and seasonality at a household level (n = 600 in our case study), the months of household’s food security and insecurity (n = 600) and food consumption patterns at an individual level, to identify dietary gaps (n = 294 women and child pairs in our example). In our case study, 31 fruit tree species were reported on farms in our Western Kenya sample (9 of which were indigenous) and 51 (27 indigenous) in Eastern Kenya. In addition, the median number of food-insecure months per household was four (ranging from 0 to 9 months) in Eastern Kenya and three (0 to 12 months) in Western Kenya. Finally, using 24-h recalls the proportion of women that had consumed a fruit the day before the interview was around 55% in Western Kenya and 80% in Eastern Kenya, with consumption averaging 93 and 131 g, respectively. Using these parameters for each site and fruit tree phenology and food composition data sets, we derived context-specific recommendations that involve promoting 11 fruit tree species to address micronutrient gaps.
1 Introduction
Malnutrition, which is a key risk factor determining non-communicable diseases (NCDs) (Development Initiatives 2018; Forouhi and Unwin 2019), is a global challenge, with one in three people worldwide affected. While the causes are complex, a common denominator is a low-quality diet (Global Panel on Agriculture and Food Systems for Nutrition 2016; Branca et al. 2019), with insufficient consumption of fruits, vegetables, legumes, nuts and whole grains (WHO 2015; McMullin et al. 2019). Fruits and vegetables contain high levels of vitamins and minerals (FAO/INFOODS 2017), and their consumption is associated with a reduced risk of a number of diet-related non-communicable diseases including cardiovascular disease, stroke hypertension, and type 2 diabetes (Boeing et al. 2012; Cooper et al. 2012; Muraki et al. 2013; Aune et al. 2017).
While the global supply of fruits and vegetables is on average 22% short of population needs according to established dietary recommendations (Lock et al. 2004), low-income countries on average fall 58% short (Siegel et al. 2014). Among the reasons that particularly hamper fruit and vegetable intake in low-income nations are supply side limitations, including seasonal unavailability, inappropriate post-harvest handling and the limited practice of value addition technologies for perishable foods (Siegel et al. 2014; Development Initiatives 2017). Globally, shortfalls in supply also reflect a focus in recent decades on food systems’ delivery of sufficient calories rather than a full spectrum of nutrients (Burchi et al. 2011; Global Panel on Agriculture and Food Systems for Nutrition 2016; Willett et al. 2019). This has been exasperated in low-income nations in continents such as Africa as they transition to “more western” diets (Vorster et al. 2011). Recently, however, the need to focus much more on food quality through ‘nutrition-sensitive’ agriculture has increasingly been recognised in global policy frameworks and commitments (Global Panel on Agriculture and Food Systems for Nutrition 2016; United Nations 2016).
Within this new agenda, increasing tree cultivation has an important role to play (Jamnadass et al. 2015; Pretty et al. 2018) as around 74% of fruit produced globally are harvested from trees,Footnote 1 which also produce nutritious leafy vegetables, nuts, seeds and edible oils. Surveys show that tree cover is positively associated with dietary diversity and fruit and vegetable consumption (Ickowitz et al. 2014). Moreover, the deep and extensive roots of trees make them more drought tolerant than annual crops, meaning they can provide food in dry periods when other food sources are not available (Jamnadass et al. 2011; Kehlenbeck et al. 2013). Tree foods have thus the potential to complement and diversify the predominantly staple-based diets of rural households through the year. Trees also provide other important products including medicines, timber and fodder, and ecosystem services such as carbon sequestration and soil fertility replenishment that support the resilience of resource-constrained households (Prabhu et al. 2015).
In sub-Saharan Africa, inadequate micronutrient intakes contributed to by annual per capita consumption of fruits and vegetables far below World Health Organisation (WHO) recommendations (Table 1) are a primary concern (FAO and WHO 2004; Ruel et al. 2005; Keatinge et al. 2010). In addition, long dry periods in many locations on the continent and increased instability in weather patterns caused by anthropogenic climate change mean that securing seasonality of availability is a topic of increasing importance (FAO 2008). To better incorporate fruits into local food systems while addressing the challenge of seasonality, World Agroforestry (ICRAF) has developed a methodology that we call “fruit tree portfolios”. This approach selects combinations of socio-ecologically suitable and nutritionally important indigenousFootnote 2 and exotic fruit tree species for production on farms, being targeted to provide fresh fruit to counter monthly nutritional gaps in local diets (Jamnadass et al. 2015; Kehlenbeck and McMullin 2015).
Here, we describe the different elements of the fruit tree portfolio approach and explore its feasibility through a case study involving the development of location-specific portfolios in Western and Eastern Kenya, where contrasting agro-climatic and socio-economic conditions prevail. We aimed to determine if at our chosen sites a combination of fruit tree species on single farms could potentially deliver fresh fruits to households year-round, and if we could address specific micronutrient gaps, particularly of vitamin AFootnote 3 and vitamin C. We chose Kenya for our case study because micronutrient deficiencies co-exist with both under- and over-nutrition, with increased fruit consumption potentially having an important role in both cases in future (Development Initiatives 2018). Our approach uses mixed methods to explore on farm fruit tree diversity at a household level. It considers production seasonality, the months of household’s food security and insecurity, and food consumption at an individual level. The approach can be adapted and used in other locations and can be expanded to include other foods. The approach builds on previous work to identify food harvest gaps and fruit tree species seasonality (Kehlenbeck et al. 2013) by being novel in two aspects: first, in the use of individual-level food consumption data to identify dietary gaps; and second in the use of food composition data to select optimum combinations of fruit tree species that target micronutrient needs in local food systems.
2 Materials and Methods
2.1 Study sites
The development and testing of the fruit tree portfolio methodology was undertaken in two regions of Kenya, namely Western and Eastern Kenya. Specifically, in Western Kenya, two separate sites, Kakamega and Siaya Counties were chosen, while in Eastern Kenya the site chosen was Machakos County (Fig. 1).

Research sites chosen for testing of the fruit tree portfolio approach in Kenya. Maps of the locations of surveyed farms (nH), 296 in the Western Kenya region, in Kakamega and Siaya Counties, and 304 farms in Machakos County in the Eastern Kenya region are shown. Source of maps: ICRAF
The agroecology and economies of these three sites vary, although all demonstrate micronutrient deficiencies among human populations. Kakamega County in the Western region has a transitional to humid climate with a higher annual rainfall of between 1280 and 2210 mm. Rainfall is in addition more evenly distributed across the year, although less rain falls between December and February normally. Agricultural production in higher altitude locations in the county is based on intensive maize, tea and bean cultivation, while in lower altitudes the main crop is sugarcane, which is a crucial cash crop. In 2009, the county had a population of around 1.7 million people (Kakamega CIDP 2016) and a stunting rate for children under five years of age of 28% (KNBS 2014). Siaya County in the Western Kenya region is located along the shores of Lake Victoria. A semi-arid to transitional climate prevails, with a large range of average annual rainfall of 800 to 2000 mm. The rainfall here shows a bi-modal pattern with dry periods in January/February and July/August. The livelihoods of most Siaya County residents depend on fisheries and small-scale farming. Siaya County is home to over 800,000 people (Siaya CIDP 2016) and has a below-five years old child stunting rate of 25% (KNBS 2014). Finally, Machakos County has a semi-arid climate with a bi-modal, but unreliable, average annual rainfall of between 500 and 1300 mm, depending on the exact location. Dry periods are experienced in January/February and July to September. Main food production in the county involves maize, beans, millet and sorghum, with agriculture contributing 70% of household income (Machakos CIDP 2015). In 2009, the county had a population of almost 1.1 million people (Machakos CIDP 2015) and an average stunting rate for children under five years of age of 26%, rather similar to the other chosen sites (KNBS 2014).
2.2 Methodology
The fruit tree portfolio approach consists of a number of elements that we illustrate here with our Kenyan case study. The key research tools are summarised in this paper and relevant primary data presented for illustrating the application of the methodology using the case study sites. The mixed method used for data collection triangulates information from a quantitative household socio-economic and farm diversity survey, a food consumption and food security survey, on-farm fruit tree inventories, and qualitative farmer focus group discussions, to develop fruit harvest calendars. The different elements of the approach and samples involved for our case study are indicated in Fig. 2. Below, the individual tools that are combined to constitute the complete approach are described.

The methodological framework for the fruit tree portfolio approach, the tools involved and sample sizes (n) for the current Kenyan case study are shown
2.3 Quantitative data collection
2.3.1 Tool 1: Household socio-economic and farm diversity survey
To develop location-specific portfolios, it is first necessary to understand the local socio-ecological context. A socio-economic and farm diversity survey was therefore used to capture the characteristics of farming households in each of our locations. Socio-demographic variables included: gender, age, level of education, employment status, profession, marital status, household composition (those permanently living in the household) and household type (e.g. female- or male-headed). Diversity data were also captured from individual respondents to support the later development of location-specific portfolios. The diversity data included: fruit tree species, varieties and the number of both wild and planted trees on farms, and fruit production, with the season of fruiting per species. Data were collected on both indigenous and exotic tree species. Initially, we treated our Western and Eastern Kenyan regions as single separate entities, but because our analysis revealed substantial variation within our Western Kenya sample, we further split this region when relevant into the two separate Kakamega and Siaya County sites for subsequent analyses and interpretations. A total (nH) of 600 rural smallholder farming households was interviewed in 2014, 296 from Kakamega and Siaya Counties combined in Western Kenya (interviewed November 2014; 125 and 171 from the two counties, respectively) and 304 from Machakos County in Eastern Kenya (interviewed April 2014).
2.3.2 Tool 2: Food consumption and food security survey
In series with the above, a household and individual food consumption and food security survey was undertaken based on a range of standardised approaches. A 24-h dietary recall was used to gather information on all foods (including but not restricted to tree foods) and beverages consumed in the period prior to the survey. These allowed the calculation of individual dietary diversity scores and of the nutritional adequacy of diets (FAO 2011). This was undertaken with a sub-sample (nF) of 294 women/primary care-giver and child pairs from the 600 households interviewed with Tool 1 (Fig. 2). This sub-sample was made up of a random collection of 166 households in Kakamega and Siaya Counties (interviewed February 2015) and 128 in Machakos County (interviewed September 2014). As is evident, the months of implementing the surveys were different across sites. This was because of the different timings of the rainy seasons; surveys were timed for one month before expected commencement. As key to the development of portfolios is the identification of food insecurity periods, we used the Months of Adequate Household Food Provisioning (MAHFP) tool to collect this information (Bilinsky and Swindale 2010). We applied specific criteria in the food consumption and food security survey: the mother or primary care-giver had to be available for the survey and the household had to contain at least one child under the age of ten years.
2.3.3 Tool 3: On-farm fruit tree inventory
As noted in section 2.3.1, during household interviews farmers were asked to provide information on fruit tree species on their farms. We further obtained inventory information on planted and naturally-established fruit trees through formal botanic evaluation by scientists who recorded tree species’ names and numbers for each surveyed farm. In our inventory, we classified trees as any woody, perennial species, including ‘true’ trees, woody shrubs and lianas. Although bananas (Musa × paradisiaca L.) and papayas (Carica papaya L.) are non-woody, they were also included in the inventory, as farmers generally classify them as trees. The on-farm fruit tree inventory was conducted for a random systematic (to cover different agro-ecological zones) sub-sample (nT) of 172 households from the 600 initially surveyed with Tool 1, involving 72 households in Western Kenya and 100 in Eastern Kenya (Fig. 2).
2.4 Qualitative data collection
2.4.1 Tool 4: Farmer focus group discussions - developing fruit harvest calendars
Focus group discussions (FGDs) were used to capture additional data to complement the quantitative information collected above. A key objective was to capture information from a representative set of farmers from the chosen three sites to agree the timing of harvest and consumption of fruits by their communities. This allowed us to triangulate fruit harvest information with available expert knowledge and literature reports, and take account of the ecological variation of landscapes which means that harvest months of species and varieties can vary in different locations. To aid farmers’ recall beyond season to specific months, a calendar with reference points such as the planting and harvest seasons of maize was used to guide discussions. The FGD participants were selected based on a stratified random sampling approach from the complete list of 600 initial households, ensuring equal coverage of different agro-ecological zones. In total, eight (nC) FGDs were conducted; four in Western Kenya (two each in Siaya and Kakamega Counties) and four in Eastern Kenya, Machakos County, with 63 and 42 farmers participating in each of the case study regions, respectively.
2.5 Developing fruit tree portfolios
The novelty of our fruit tree portfolio methodology lies in the use of location-specific data on fruit tree species phenology and on fruit nutrient composition to address harvest and specific micronutrient gaps. In our case study we illustrate this with reference to the important vitamins A and C. Fruit tree species which are ecologically suitable, have the selected vitamins, are important in the area according to both the surveys (Tools 1 and 3) and the FGDs (Tool 4) are considered for inclusion in the portfolio. In the current section, we outline the steps in developing location-specific fruit tree portfolios using the data collected with the research tools we have already described.
- Step 1:
The first step involved reviewing the harvest calendars developed with farmers during the FGDs (Tool 4 above). The fruit tree species identified during the FGDs were verified against socio-economic and farm diversity data collected with Tool 1, as well as against information from expert consultations, available databases and the literature on fruit tree species’ harvest seasons. The list of species was cross-checked with the results of the fruit tree inventory (Tool 3) to identify species that may have been overlooked or forgotten in the FGDs but that were of high abundance on farms. A fruit tree harvest calendar was then produced in a matrix where species names are located in rows and months of the year in columns, with harvest months per tree species added (Fig. 3). These calendars are a starting point for a phenological understanding of fruit production in landscapes, although they require further work to confirm them that was outside the scope of the current study. For example, the stability of phenology across years should in future be assessed.
- Step 2:
The second step of development involved combining the fruit tree harvest calendar with the results from the MAHFP tool to align the calendar with periods of food insecurity through the year for each of our chosen sites (Figs. 4 a and b, 5 - upper graph, peak in food insecurity months highlighted by red box). One objective of the fruit tree portfolio is to ensure that at least one fruit tree species is available for harvest in each month of the year. If harvest gaps were identified, these were ‘closed’ by identifying ecologically suitable fruit tree species which could be cultivated for fruit harvest during gaps. To find additional indigenous fruit tree species for the portfolio that are suited to the location but that may have been overlooked in field surveys, several decision support tools are available. In our case study of Kenya, these include the vegetationmap4africa (Kindt et al. 2015; van Breugel et al. 2015).
- Step 3:
In addition to filling harvest ‘gaps’, the composition of the fruit tree portfolio was adjusted to address the micronutrient deficiencies of the target communities. For current purposes, vitamins A and C were selected as key micronutrients of interest as they are often lacking in diets, with significant health consequences, and fruits can provide an important source of both. Results from the food consumption and food security survey (Tool 2 above) were analysed to identify dietary diversity at household and individual levels for women/primary care-givers and children, and to determine fruit intake. The 24-h recall data were then used to assess women and young children’s vitamin A and vitamin C intake. In parallel, the fruit tree species identified in harvest calendars at specific sites were evaluated for their vitamin A and C contents to assemble a food composition database on tree foods. This assembly applied international standards and guidelines from FAO/INFOODS (FAO/INFOODS 2012a, 2012b) and made use of available literature and databases (e.g. Favier et al. 1993; Stadlmayr et al. 2012; USDA 2015; FAO/INFOODS 2017). Nutrient contents were compiled, aggregated and standardised for 100 g of the edible portion (EP) of fruit on a fresh weight basis. Tree species’ vitamin A and vitamin C contents were then rated from ‘no source’ to ‘high source’ following the FAO and WHO (2007) Codex Alimentarius Food Labelling Guidelines supplemented by our own scaling approach (Table 2). According to the FAO and WHO (2004) Expert consultation on human vitamin and mineral requirements the recommended daily intake for adults (calculated average women/men) is 45 mg of vitamin C and 575 micrograms (mcg) of Vitamin A (RE). Codes for these vitamin C and/or vitamin A contents were then added to the earlier devised fruit harvest calendar (See Step 1).
Fig. 3 
Fruit harvest calendars for case study sites in Western and Eastern Kenya according to results of eight Focus Group Discussions, literature reviews and expert consultations. Harvest seasons for fruits (green shaded boxes), and vitamin contents (vitamin C in mg per 100 g fresh (raw) weight of edible portion (EP); vitamin A in mcg RE (retinol equivalent) per 100 g EP) of selected indigenous (i) and exotic (e) fruit species in Western (Siaya and Kakamega Counties) and Eastern Kenya (Machakos County). All nutrient values of the above listed tree foods will be available in a forthcoming database under development by World Agroforestry
Fig. 4 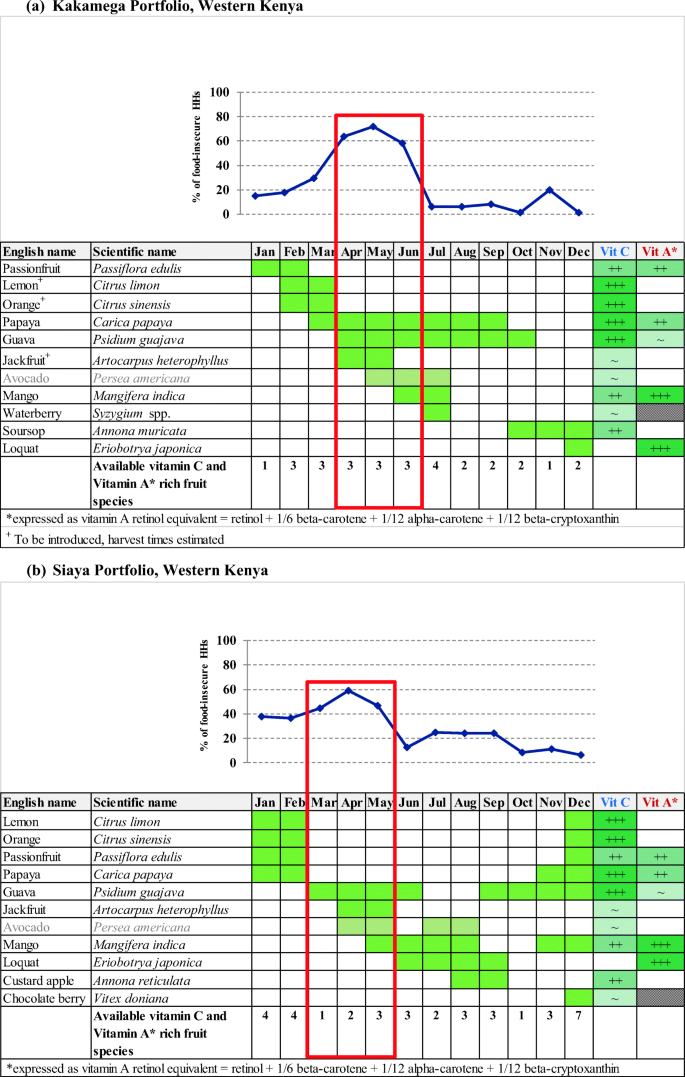
a and b Fruit Tree Portfolios for Kakamega (a) and Siaya (b), Western Kenya. The final selected 10 fruit tree species with moderate to high vitamin A and/or vitamin C contents (plus avocado) and their months of harvest, indicated by green-shaded boxes in calendar. These are mapped against months of food security of the surveyed households (HHs) in Kakamega (nH = 125) and Siaya (nH = 171), and months of food insecurity highlighted by the red box. Ratings of vitamin A and vitamin C contents are given as +++ (high source); ++ (source); ~ (present, but low); blank, white (no source); blank, grey (no data available) [See Step 3 in this paper for more detail on how the ratings were calculated]
Table 2 Vitamin A and vitamin C content ratings developed for the portfolio approach - Step 4:
Step 4: The final step in developing the fruit tree portfolio was to select a total of 10 to 12 fruit tree species from the harvest calendar that, if cultivated on a single farm, could supply the farmer’s family with fresh fruits and specific micronutrients year-round. To do so, each calendar month was considered separately and, if possible, at least one species selected per target nutrient, e.g. one species such as mango (Mangifera indica L.) with high vitamin A content and another species such as orange (Citrus × sinensis L. Osbeck) with high vitamin C content (Figs. 4 a and b, 5). Minor fruit tree species (i.e. mentioned only by a few respondents or available for harvest for only one month) were mostly excluded. If two or more species had similar or partly overlapping harvest months, then the species with the most months of harvest, or highest vitamin A and C values was selected. Species available in the most food-insecure months were retained. In addition, a few indigenous species were included, if available, and a certain level of species diversity was generally targeted to account for risks of crop failure for specific species, particularly in the face of climatic stresses and increasing risk of drought.


3 Results
3.1 Household socio-economic and farm diversity data
The mean size of the surveyed households (nH = 600) was equal or close to five members in Western (Kakamega and Siaya Counties combined) and Eastern (Machakos County) Kenya regions, with the mean number of children per household however higher in the former region (Table 3). The proportion of female-headed households was generally low in both Eastern and Western regions, but lower in the former case. The level of formal education was somewhat higher in Eastern Kenya compared to Western Kenya, while the proportion of household heads who mentioned that their main occupation was ‘farmer’ was similar in the two regions. Mean farm size was larger in the Eastern Kenya region.
The statistics of households determined from our study vary somewhat from county-level data available in the Kenya 2014 Census (KNBS 2014) and in County Integrated Development Plans (Machakos CIDP 2015; Kakamega CIDP 2016; Siaya CIDP 2016). In the Census, household sizes were smaller in Machakos County than Kakamega and Siaya Counties, being 4, 4.4 and 4.2 members, respectively, a relationship between regions that is similar to that revealed by the data we collected. However, family size was overall smaller in the Census than in our study. In County Integrated Development Plans, farm sizes were 0.6 ha for Kakamega and 1.5 ha for Siaya, and 0.8 ha for Machakos, again revealing some differences (our farm sizes in Siaya appear somewhat smaller on average than expected from County Integrated Development Plan data).
A total of 31 different fruit tree species were mentioned to be found on farm by respondents (nH = 296) from Western Kenya (including 9 indigenous species) and 51 species (including 27 indigenous ones) by respondents (nH = 304) from Eastern Kenya (Table 4). The median number of self-reported fruit tree species in farms, and individual fruit trees per farm, were both significantly lower in Western than Eastern Kenya. In addition, of the total number of fruit trees on farms indicated by respondents in the Western and Eastern Kenya regions, only 2.1% and 6.2% were of indigenous species, respectively. Twelve households in Western Kenya and three in Eastern Kenya did not mention any fruit tree on their farms.
The three most frequently mentioned fruit tree species across farms in Western Kenya, ordered by rank, were mango, avocado (Persea americana Mill.) and guava (Psidium guajava L.), each indicated by more than 50% of respondents as present on their farm (Table 5). In Eastern Kenya, the three most frequently mentioned species, again ordered by rank, were mango, papaya and avocado, each of which again was indicated to be present on their farm by more than 50% of respondents. In terms of on-farm abundance (i.e. total number of individuals of a species summed across farms within a region), guava, kei apple (Dovyalis caffra (Hook.f. & Harv.) Warb.) and mango were the most abundant on farms according to respondents in Western Kenya and mango, papaya and banana in Eastern Kenya. All of these species were indicated to have a relative abundance of at least 8% of all trees when totalling numbers across farms within regions.
The formal fruit tree inventory (nT) conducted on a subset of 72 farms in Western Kenya and 100 farms in Eastern Kenya revealed 30 and 31 species, respectively. Comparing these figures to the number of farmer-identified (nH) fruit tree species for the regions (see above), the farmer and formal inventory (nT) values were very similar for Western Kenya, but significantly more species were identified by farmers in Eastern Kenya (51; Table 4) than were identified on-farms during the inventory (31). This may have been due to over-estimation by farmers or the mention of species which could also be found in the surrounding landscape. In Western Kenya, formal inventory results on the frequency of occurrence of fruit trees across farms corresponded exactly in ranking with information from farmers, while for Eastern Kenya formal inventory results indicated that lemon (Citrus × limon L. Osbeck) ranked third in terms of the proportion of farms with the tree, rather than banana being in this position with the farmer survey.
3.2 Food consumption and dietary diversity of women and children
For the 294 women (nF) interviewed in this study, mean dietary diversity, a proxy for nutritional adequacy, was similar when total collected data were partitioned across Western and Eastern Kenya regions, despite the different survey months, with 4.7 (ranging 2–8) and 4.6 (ranging 1–7) food groups out of nine being consumed, respectively. The proportion of women that had consumed a fruit the day before the interview was 55% in Western Kenya and 80% in Eastern Kenya. This was consistent with women in Western Kenya consuming smaller quantities of fruits in February than women in Eastern Kenya in September, the time at which data was collected and just before the onset of the rains (our figures were 93 and 131 g, respectively). Furthermore, when considering the average quantities consumed by only those who had consumed a fruit in the previous 24 hours, this was similar across regions, with values of 170 and 165 g per person per day in Western and Eastern Kenya, respectively. The most frequently consumed fruits by the interviewed 166 women in Western Kenya were mango and banana, both in season in the month of the survey (February; Fig. 3), and eaten by 24% and 20% of respondents, respectively. For the 128 women in Eastern Kenya these fruits were orange (not in season in September when the survey was performed) and avocado (in season), eaten by 38% and 27% of respondents, respectively. Only 31% of the interviewed women in Western Kenya and 30% of those in Eastern Kenya had consumed a vitamin A-rich fruit the day before the interview. However, when considering all foods rich in vitamin A (not just tree fruits), 93% of interviewed women in Western Kenya had on the previous day eaten foods rich in vitamin A, and 97% had in Eastern Kenya.
For the 293 paired children (one child could not be interviewed) (nF) under ten years of age interviewed in our study, mean dietary diversity was lower in Western Kenya than in Eastern Kenya, with values of 5.2 (ranging 1–9) and 5.8 (ranging 3–8) food groups out of nine being consumed, respectively. The proportion of children that had consumed a fruit the day before the interview was 45% in Western Kenya and 69% in Eastern Kenya, while the mean amount of fruits consumed was also lower in Western Kenya (55 g and 97 g for the two regions, respectively). When considering the averages consumed by only those who had consumed a fruit in the previous 24 hours, this was also higher in Eastern than Western Kenya (140 and 124 g, respectively). Similar to the results for women, the most frequently consumed fruits by the 166 children surveyed in Western Kenya were mango and banana (eaten by 21% and 13% of respondents, respectively) and for the 127 children surveyed in Eastern Kenya were orange and avocado (eaten by 34% and 21%, respectively). Only 28% of the surveyed children in Western Kenya and 25% of those surveyed in Eastern Kenya had consumed a vitamin A-rich fruit in the day before the interview. However, when considering all foods rich in vitamin A, 89% of interviewed children in Western Kenya and 98% in Eastern Kenya had on the previous day eaten such foods.
3.3 Household food insecurity
Results from the MAFHP (nH = 600) showed that in Western Kenya, 91% of the surveyed 295 households (one did not complete this question) experienced food insecurity in the 12 months prior to the interview, with differences between the two studied counties noted. The food insecure season lasted from April to June, with up to 72% of respondents affected, in Kakamega County (Fig. 4a, upper part of the figure) and between February and May in Siaya County, with up to 59% of household’s food-insecure (Fig. 4b, upper part of the figure). The median number of food-insecure months per household in Western Kenya was three (range 0–12 months). In Eastern Kenya, 87% of the surveyed 304 households stated that they experienced food insecurity in the 12 months prior to the interview. The respondents identified the period of August to December to be of high food insecurity, with a peak in October when 76% of the households were food insecure (Fig. 5, upper part of the figure). The median number of food-insecure months per household in Eastern Kenya was four, with a range of 0–9 months.

Fruit Tree Portfolio for Machakos, Eastern Kenya. The final selected 10 fruit tree species with moderate to high vitamin A and/or vitamin C contents (plus avocado) and their months of harvest, indicated by green-shaded boxes in calendar. These are mapped against months of food security of the surveyed households (HHs) (nH = 304), months of food insecurity highlighted by the red box. Ratings of vitamin A and vitamin C contents are given as +++ (high source); ++ (source); ~ (present, but low); blank, white (no source); blank, grey (no data available) [See Step 3 in this paper for more detail on how the ratings were calculated]
3.4 Seasonal calendars for the most important fruit species
During the four FGDs (nC) in Western Kenya, 36 fruit tree species were mentioned by participants, including 20 wild/indigenous species found in natural habitats or on farms. This result was different from our observations based on the individual interviews of 296 households (nH) when a smaller proportion of indigenous species was mentioned (31 fruit tree species indicated in total on farms, which included only 9 indigenous species). In the FGDs, the harvest seasons of 24 fruit species in Siaya County, and 13 species in Kakamega County, were identified with respondents (Fig. 3). Some species such as banana and wild passionfruit (Passiflora foetida L.) were said to be available for harvest throughout the year, while other fruit trees such as water berry (Syzygium spp.) were mentioned as bearing fruit for only one month each year. In each of the months during a year, at least five fruit tree species in Siaya and one in Kakamega County were available for harvest according to the FGD participants. In Siaya County, the highest number of fruit tree species with ripe fruits (15 species) was identified by the participants for the month of December, while the lowest (five species) was identified for the month of March. In Kakamega County, the highest number of fruit species was available in July (seven species) and the lowest in January (one species).
In Eastern Kenya, 52 fruit species, including 36 wild/indigenous species, were listed by the participants of the four FGDs. This was similar to the results of the individual interviews of 304 respondents (nH) in the same region (51 species identified, including 27 indigenous ones). During the FGDs, harvest seasons could be identified for 23 species (Fig. 3), ranging from only one month per year (e.g. pomegranate, Punica granatum L.) to year-round (i.e. tickberry, Lantana camara L.). According to FGD participants, in November only three species were harvestable while in May as many as nine species were.
3.5 Fruit tree portfolios for Western and Eastern Kenya
Based on the data collected as described above, portfolios were developed for each of the three study areas. These list fruit tree species that have available information on months of harvest and on nutrient composition, for vitamins A and/or C. Species that were a ‘source’ or even ‘high source’ of vitamin A and/or vitamin C according to Fig. 3 were selected for the portfolio, while those with rather low vitamin values or of low importance in a particular study area were not included. Although avocado is not a source of vitamin A and contains low levels of vitamin C, it provides high levels of vitamin E, an antioxidant protecting body cells from oxidative damage, and is rich in good fat, consisting mainly of monounsaturated fat. In addition, avocado fruit ripen during highly food insecure months and are prioritised by farmers. We thus treated avocado as an exception and included it in our fruit tree portfolios.
The final portfolios for the two study areas, Kakamega and Siaya Counties in Western Kenya, were developed. For each of the areas, ten vitamin A and/or vitamin C-rich fruits were selected, along with avocado in both cases (Fig. 4 a and b). As a result, the following 11 species constituted the fruit tree portfolio for Kakamega County (ordered by harvest occurrence, beginning with January): passion fruit (Passiflora edulis Sims), lemon, orange, papaya, guava, jackfruit (Artocarpus heterophyllus Lam), mango, water berry, soursop (Annona muricata L.) and loquat (Eriobotrya japonica Thunb. Lindl.) plus avocado (Fig. 4a). Of this list, lemon, orange and jackfruit were not mentioned by FGD respondents in the Kakamega region but were considered as important for their months of harvest and nutrient values and were thus included. For Siaya County, the portfolio consisted of: lemon, orange, passion fruit, papaya, guava, jackfruit, mango, loquat, custard apple (Annona reticulata L.) and chocolate berry (Vitex doniana) plus avocado (Fig. 4b).
Similarly, a final portfolio was developed for Machakos and consisted of the ten species: papaya, mango, loquat, waterberry, custard apple, guava, lemon, orange, passion fruit and desert date (Balanites aegyptiaca (L.) Delile) (plus the exception of avocado) that provide farming families year-round with fresh, vitamin-rich fruits when cultivated together on a farm (Fig. 5).
4 Discussion
In this case study demonstration of our fruit tree portfolio approach, we have shown that it can be used to identify location-specific combinations of fruit tree species for on-farm cultivation that address month-on-month fruit harvest and micronutrient gaps in local households’ diets. The approach involves a variety of tools that allow triangulation of data sets. It also provides an example of how agriculture may be used to promote nutritionally rich foods, particularly for rural smallholders who rely predominantly on foods from their own farms (FAO and WHO 2014; Ng’endo et al. 2015). The defined portfolios can help reshape local food systems to contribute to national and global goals on nutrition such as SDG2 to “end all forms of malnutrition by 2025” (Covic and Hendricks 2016; United Nations 2016; FAO, IFAD, UNICEF, WFP, and WHO 2018).
4.1 Using data for evidence based, nutrition sensitive agricultural approaches
The portfolio approach makes use of location-specific data to not only capture the socio-ecological dynamics of smallholder food production diversity but uniquely includes individual food consumption data to inform knowledge on local dietary gaps. Such individual-level consumption data are imperative for informed decision making at country, regional and global levels, but the information available is generally limited and dispersed (IFPRI 2014; Micha et al. 2018). For example, the data available are often based on national food supplies rather than individual-level information disaggregated by location, gender, age and intra-household food allocation. A key point identified by the authors of the Global Nutrition Report 2017 was the need to fill this data gap. In our portfolio approach we do this on a context-specific local level. This information can complement wider nationwide surveys, especially when supported by global initiatives to collate data and make it publicly available through accessible platforms such as the FAO/WHO Global Individual Food Consumption Data Tool (FAO and WHO 2017).
4.2 Selecting location specific fruit tree species diversity to address seasonal availability
Our case study showed that the portfolio approach can be adapted to different locations with diverse agro-ecological conditions, as illustrated by the varying environments of our three case study sites in Kenya. The tools we applied were flexible enough to develop portfolios for each site that were unique, due to variations in species suitability fruit tree phenology and farmers’ preferences. The portfolios could in addition be designed to include intra-specific diversity by promoting different varieties of fruit species with offset harvest seasons. This applies for example to mango which is rich in vitamin A and highly favoured by farmers and consumers, where there is an opportunity to extend seasonal availability by introducing and promoting several early- and late-maturing types (Keding et al. 2017). In our case study, for instance, growing early-maturing mango varieties already available in Kenya could contribute to closing fruit harvest gaps in April/May in Kakamega, March/April in Siaya and October/November in Machakos. It’s important to note of course that the portfolio is a recommendation, it may not be ideal for a farmer to produce all species included due to land, water and other restrictions.
4.3 Closing micronutrient gaps in local food production systems
Population needs in achieving food-based dietary recommendations are falling short and will continue to do so unless strategic interventions are made for increasing the production of nutrient-rich foods such as fruits and vegetables (Keats and Wiggins 2014; Siegel et al. 2014). Our case study reveals low fruit consumption by women and children at three sites in Kenya during the dry season, just before the expected onset of the rains, particularly of vitamin A rich fruits. Another study (Keding et al. 2017) in Western Kenya found that during the dry season when fruit consumption was double that of the rainy season, but still low, women had significantly increased vitamin A and vitamin C intake. Moreover, even though there are other sources of such vitamins, for example in vegetables, Keding et al. (2017) reported that fruits contributed significantly to intake of these vitamins and thus to closing the nutrient gap of these vitamins, especially during the dry season. By applying the presented portfolio approach, the increased availability and consumption of fruits during both seasons (rainy and dry) could help to close the remaining nutrient gaps identified. Several other studies from various countries have also found an association between seasonality, production diversity and key food security and nutrition (dietary diversity) indicators (Kumar et al. 2015; Ng’endo et al. 2015; Ng’endo et al. 2017; Stevens et al. 2017). Ideally, for future portfolio development, the collection of individual-level food consumption data at multiple times in the year to cover varying seasons, matched with repeated fruit phenology data capture, would ensure more robust location-specific recommendations for portfolio entry.
4.4 Mainstreaming the promotion of indigenous and underutilised fruit tree species
The portfolio approach promotes the cultivation of indigenous and underutilised tree species - perennial foods which have received little attention by researchers in the past, despite their potential for providing food and nutrition security (Hawtin 2007; Armstead et al. 2009; FAO and Bioversity International 2017; Dawson et al. 2018). Indigenous fruit species may be available during ‘lean’ (food insecurity) periods and thus could provide a buffer between harvest seasons of commonly found and often farmer-favoured exotic species (Kehlenbeck et al. 2013). Overall, some indigenous fruit tree species were present on farms in our case study. Of the total fruit species mentioned to be cultivated on farms, indigenous species represented more than half (53%) in Eastern Kenya, and nearly one third (29%) in Western Kenya. Our study shows that the inclusion of indigenous fruit species in portfolios is important to bridge fruit harvest gaps, and sometimes nutrient gaps, to ensure year-round provisioning. For example, desert date (fresh, raw) is a good source of Vitamin C in Machakos during August and September compared to some other species available during that time. The ability of these types of food to fill gaps is particularly relevant given their increasing recognition in international frameworks and guidelines (FAO and WHO 2014; FAO 2016); a key justifcation for their promotion should lie in filling month-on-month nutrient gaps. The promotion of underutilised species in crop diversification is explicitly stated as a recommendation in the Framework of Action of the International Nutrition Conference (ICN2), as is the incorporation of these species into locally-adapted food-based dietary guidelines (FAO and WHO 2014; FAO 2016). This is most pertinent in regions and countries where fruit production and consumption are low, and where a wide range of indigenous species exist and are better adapted to local environments than introduced exotic species (Kehlenbeck et al. 2013). Promoting the cultivation and use of indigenous fruit tree species on farms could also contribute to the adaptation of farming systems to anthropogenic climate shocks.
4.5 Nutrient composition data for linking agriculture and nutrition
Although it is increasingly recognised that the better use of agricultural biodiversity may support more nutritious diets (Convention on Biological Diversity 2006; United Nations 2016), information on the nutrient content of indigenous and underutilised crops is often hard to come by (Stadlmayr et al. 2013). Less-researched plants rich in micronutrients may therefore be overlooked in agriculture and nutrition development planning, projects and policies. In our present case study, for example, a lack of data on vitamin contents of indigenous fruit tree species including wild passionfruit and wild medlar (Vangueria madagascariensis J.F.Gmel.) (Fig. 3) led to their exclusion from our portfolios, even though they might make important nutritional contributions. It should also be noted that the nutrient content of foods is influenced by many factors, including soils, climate, agricultural practices, post-harvest handling and genetics (Greenfield and Southgate 2003). Regarding the last factor, studies have shown that minerals and vitamins can vary in level as much between crop varieties as between different crops (Charrondiere et al. 2013). Mango varieties, for example, can vary more than three-fold in their beta-carotene content (Muoki et al. 2009). Rarely however are such intra-specific data collected and published. Clearly, compiling and making more widely available the food composition data of indigenous and underutilised crops in particular is important for promoting their future use.
4.6 Beyond food production – consumption pathways
The fruit tree portfolio approach described here provides a suitable entry point for promoting a direct production-consumption pathway to address fruit consumption and dietary needs, with consistent associations demonstrated between agricultural biodiversity and more diverse diets at household and community levels (Jones 2017a). Yet, some studies have found that improving small farmers’ access to markets rather than increasing on-farm production diversity may be a more effective strategy to improve diets in smallholder farm households (Sibhatu et al. 2015; Koppmair et al. 2017). Evidence on whether production diversity, market-based strategies or a combination of both improve diets is inconclusive and context dependent (Fanzo 2017; Jones 2017b). What should not be overlooked in this debate, as mentioned by Remans et al. (2015), is the need to explore relationships between production and consumption at different scales, including at landscape and district levels. Production diversity, particularly of perishable foods such as fruits, plays a crucial role especially where infrastructure is limited, as it supplies local markets and provides nutritious and accessible foods to local communities (Ickowitz et al. 2019). Moreover, in areas with poor market access or low purchasing power, farm and production diversity clearly do increase dietary diversity (Kumar et al. 2015) and interventions aiming at increasing on-farm species diversity, such as the fruit tree portfolio approach, should be combined with awareness campaigns on healthier diets. These should be targeted to women because reviews on homestead food production systems have found consistently that a nutritional effect is more likely when they are subject to behaviour change communications (Iannotti et al. 2009; Ruel and Alderman 2013).
5 Conclusion
In light of the global agenda to ensure more sustainable food systems both globally and locally, there is increased awareness for the need to transform agricultural interventions to meet the dietary needs of increasing populations. In sub Saharan Africa, improving nutrition is a priority for regional bodies and national governments, many of which highlight the important role of diversifying food production. The fruit tree portfolio approach can be scaled to inform policies for sustainable intensification of fruit production to meet food and nutrient gaps, based on national food-based dietary guidelines. Our case study has demonstrated a methodology which can be applied to varying contexts, highlighting the relevance, and the need to make use of, location-specific data. In forthcoming applications, the portfolio approach presented here could be strengthened by including individual-level food consumption data at different points in the year to capture seasonal production variations and other time-dependent patterns, and by monitoring inter-seasonal stability in fruit tree phenology. This would support robust recommendations of fruit tree species to target year-round harvest and nutrient gaps in local diets by building further resilience into production systems. In addition, the role of local markets and the link to local food production diversity should be explored to better inform location-specific portfolios. The availability and accessibility of various promotion programmes should also be explored. In our own research, we are investigating different approaches for the adoption of fruit tree portfolios by local communities and relevant methods of mainstreaming will be the subject of further publications. Finally, the benefit of fruits (and vegetables) cannot be attributed to isolated nutrients, but rather to a dietary pattern rich in a diversity of these nutritious foods. These, and pulses which are traditional components of mixed farming systems, are at the centre of a healthy diet. With this in mind, the portfolio approach can be expanded to incorporate these other nutritious foods and starchy staples to address not only vitamin but protein, mineral and calorific/energy intake needs, for a wider, ‘diversified diet’ approach.
Notes
Data for 2016, http://www.fao.org/faostat/en, accessed on 14 April 2019.
Indigenous fruit trees, sometimes referred to as underutilised, orphan or new crops (Hawtin 2007; Armstead et al. 2009; FAO and Bioversity International 2017; Dawson et al. 2018). These are foods with underexploited potential for supporting food and nutritional security that have generally received little attention by researchers and businesses.
“Vitamin A” in this paper refers to vitamin A retinol equivalent (RE) = retinol +1/6 beta-carotene +1/12 alpha-carotene +1/12 beta-cryptoxanthin, an expression generally used for vitamin A intakes and requirements. Vitamin A activity from plant foods consists only from the vitamin A active carotenoids, including beta-carotene (highest activity), alpha-carotene and beta-cryptoxanthin, which are converted to vitamin A in the body; retinol is absent in plant foods.
References
Armstead, I., Huang, L., Ravagnani, A., Robson, P., & Ougham, H. (2009). Bioinformatics in the orphan crops. Briefings in Bioinformatics, 10, 645–653.
Aune, D., Giovannucci, E., Boffetta, P., Fadnes, L. T., Keum, N., Norat, T., Greenwood, D. C., Riboli, E., Vatten, L. J., & Tonstad, S. (2017). Fruit and vegetable intake and the risk of cardiovascular disease, total cancer and all-cause mortality—a systematic review and dose-response meta-analysis of prospective studies. International Journal of Epidemiology, 46, 1029–1056.
Bilinsky, P., & Swindale, A. (2010). Months of Adequate Household Food Provisioning (MAHFP) for Measurement of Household Food Access: Indicator Guide (v.4). Washington, D.C.: FHI 360/FANTA.
Boeing, H., Bechthold, A., Bub, A., Ellinger, S., Haller, D., Kroke, A., Leschik-Bonnet, E., Müller, M. J., Oberritter, H., Schulze, M., Stehle, & Watzl, B. (2012). Critical review: vegetables and fruit in the prevention of chronic diseases. European Journal of Nutrition, 51, 637–663.
Branca, F., Lartey, A., Oenema, S., Aguayo, V., Stordalen, G.A., Richardson, R., Arvelo, M., & Afshin, A. (2019). Transforming the food system to fight non-communicable diseases. BMJ, 364, art. no. 1296.
Burchi, F., Fanzo, J., & Frison, E. (2011). The role of food and nutrition system approaches in tackling hidden hunger. International Journal of Environmental Research and Public Health, 8(2), 358–373.
Charrondiere, U., Stadlmayr, B., Rittenschober, D., Mouille, B., Nilsson, E., Medhammar, E., Olango, T., Eisenwagen, S., Persijn, D., Ebanks, K., Nowak, V., Du, J., & Burlingame, B. (2013). FAO/INFOODS food composition database for biodiversity. Food Chemistry, 140, 408–412.
Convention on Biological Diversity. (2006). Decision adopted by the conference of the parties to the convention on biological diversity at its eighth meeting. VIII/23. Agricultural biodiversity. Curitiba: UNEP/CBD/COP.
Cooper, A. J., Forouhi, N. G., Ye, Z., et al. (2012). Fruit and vegetable intake and type 2 diabetes: EPIC-InterAct prospective study and meta-analysis. European Journal of Clinical Nutrition, 66(10), 1082–1092.
Covic, N., & Hendricks, S. (2016). Introduction. In: Covic N, Hendriks S (eds) Achieving a nutrition revolution for Africa: the road to healthier diets and optimal nutrition. ReSAKSS Annual Trends and Outlook Report 2015. International Food Policy Research Institute, Washington, DC.
Dawson, I.K., Hendre, P., Powell, W., et al. (2018). Supporting human nutrition in Africa through the integration of new and orphan crops into food systems: placing the work of the African Orphan Crops Consortium in context. ICRAF Working Paper No 276. Nairobi, World Agroforestry Centre. https://doi.org/10.5716/WP18003.PDF.
Development Initiatives. (2017). 2017 Global Nutrition Report: nourishing the SDGs. Bristol: Development Initiatives.
Development Initiatives. (2018). 2018 Global Nutrition Report: Shining a light to spur action on nutrition. Bristol: Development Initiatives.
Fanzo, J. C. (2017). Decisive decisions on production compared with market strategies to improve diets in rural Africa. Journal of Nutrition, 147(1), 1–2.
FAO. (2008). Climate change and food security: A framework document. Rome: Food and Agricultural Organization of the United Nations http://www.fao.org/forestry/15538-079b31d45081fe9c3dbc6ff34de4807e4.pdf. Accessed 3 July 2018.
FAO. (2011). Guidelines for measuring household and individual dietary diversity. Rome: Food and Agriculture Organisation of the United Nations http://www.fao.org/fileadmin/user_upload/wa_workshop/docs/FAO-guidelines-dietary-diversity2011.pdf. Accessed 3 July 2018.
FAO. (2016). Voluntary guidelines for mainstreaming biodiversity into policies, programmes and national and regional plans of action on nutrition. Rome: FAO.
FAO and Bioversity International. (2017). Guidelines on assessing biodiverse foods in dietary intake surveys. Rome, Italy: Food and Agriculture Organization of the United Nations.
FAO and WHO. (2004). FAO/WHO Expert consultation on vitamin and mineral requirements in human nutrition. Second edition. FAO, Rome.
FAO and WHO. (2007). Codex Alimentarius. Food Labelling. Fifth edition. Rome: FAO and WHO.
FAO and WHO. (2014). Framework for Action: outcome document. In Second International Conference on Nutrition. Rome, Italy: Food and Agriculture Organization.
FAO and WHO. (2017) FAO/WHO GIFT Global Individual Food consumption data Tool. http://www.fao.org/gift-individual-food-consumption/en/. Accessed 3 July 2018.
FAO, IFAD, UNICEF, WFP and WHO. (2018). The State of Food Security and Nutrition in the World 2018. Building climate resilience for food security and nutrition. Rome, FAO. Licence: CC BY-NC-SA 3.0 IGO.
FAO/INFOODS. (2012a) FAO/INFOODS Guidelines for Checking Food Composition Data prior to the Publication of a User Table/Database– Version 1.0 FAO, Rome.
FAO/INFOODS. (2012b) FAO/INFOODS Guidelines for Converting Units, Denominators and Expressions. FAO, Rome (2012).
FAO/INFOODS. (2017). FAO/INFOODS Food Composition Database for Biodiversity - Version 4.0 (BioFoodComp4.0). FAO, Rome. Available at http://www.fao.org/infoods/infoods/tables-and-databases/en/. Accessed 3 July 2018.
Favier, J., Ireland-Ripert, J., Laussucq, C., & Feinberg, M.R. (1993). Repertoire general des aliments no. 3. Table de composition des fruits exotiques, fruits de cueillette d’Afrique. TEC & DOC, 207,ORSTOM/CNEVA/CIQUAL/INRA.
Forouhi, N. G., & Unwin, N. (2019). Global diet and health: old questions, fresh evidence, and new horizons. The Lancet., 393, 1916–1918. https://doi.org/10.1016/S0140-6736(19)30500-8.
Global Panel on Agriculture and Food Systems for Nutrition. (2016). Food systems and diets: Facing the challenges of the 21st century. London: UK.
Greenfield, H., & Southgate, D. (2003). Food composition data: production, management and use (2nd ed.). Rome, Italy: Food and Agriculture Organization of the United Nations.
Hawtin, G. (2007). Underutilized plant species research and development activities -review of issues and options. A report submitted to the chairs of the Global Facilitation Unit for Underutilised Species (GFU) Steering Committee and International Centre of Underutilised Crops (ICUC) Scientific Advisory Board.
Iannotti, L., Cunningham, K., & Ruel, M. (2009). Improving diet quality and micronutrient nutrition. Homestead food production in Bangladesh. IFPRI Discussion Paper 00928, Washington, DC.
Ickowitz, A., Powell, B., Salim, M. A., & Sunderland, T. (2014). Dietary quality and tree cover in Africa. Global Environmental Change, 24, 287–294.
Ickowitz, A., Powell, B., Rowland, D., Jones, A., & Sunderland, T. (2019). Agricultural intensification, dietary diversity, and markets in the global food security narrative. Global Food Security, 20, 9–16.
IFPRI. (2014). Global nutrition report 2014: actions and accountability to accelerate the world’s progress on nutrition. Washington, DC: International Food Policy Research Institute.
Jamnadass, R. H., Dawson, I. K., Franzel, S., Leakey, R. R. B., Mithöfer, D., Akinnifesi, F. K., Tchoundjeu, Z., et al. (2011). Improving livelihoods and nutrition in sub-Saharan Africa through the promotion of indigenous and exotic fruit production in smallholders’ agroforestry systems: a review. International Forestry Review, 13, 338–354.
Jamnadass, R., McMullin, S., Iiyama, M., & Dawson, I., et al. (2015). Understanding the roles of forests and tree-based systems in food provision. In B. Vira, C. Wildburger, & S. Mansourian, Forests, Trees and Landscapes for Food Security and Nutrition. A Global Assessment Report (p. 172). Vienna: IUFRO World Series Volume 33.
Jones, A. D. (2017a). Critical review of the emerging research evidence on agricultural biodiversity, diet diversity, and nutritional status in low- and middle-income countries. Nutrition Reviews, 75(10), 769–782.
Jones, A. D. (2017b). On-farm crop species richness is associated with household diet diversity and quality in subsistence- and market-oriented farming households in Malawi. Journal of Nutrition, 147, 86–96.
Kakamega CIDP. (2016). First Kakamega County Integrated Development Plan, 2013-2017. https://kakamega.go.ke/the-first-county-integrated-development-plan-2013-2017/. Accessed 17th April 2018.
Keatinge, J. D. H., Waliyar, F., Jamnadass, R. H., Moustafa, A., Andrade, M., Drechsel, P., Hughes, J. A., Kadirvel, P., & Luther, K. (2010). Relearning old lessons for the future of food: by bread alone no longer: diversifying diets with fruit and vegetables. Crop Science, 50, S51–S62.
Keats, S., & Wiggins, S. (2014). Future diets: implications for agriculture and food prices. London: Overseas Development Institute.
Keding, G., Kehlenbeck, K., Kennedy, G., & McMullin, S. (2017). Fruit production and consumption: practices, preferences and attitudes of women in rural western Kenya. Food Security, 9, 453–469.
Kehlenbeck, K., & McMullin, S. (2015). Fruit tree portfolios for improved diets and nutrition in Machakos County, Kenya. Nairobi: World Agroforestry Centre (ICRAF). ISBN: 978-92-9059-381-2.
Kehlenbeck, K., Asaah, E., & Jamnadass, R. (2013). Diversity of indigenous fruit trees and their contribution to nutrition and livelihoods in sub-Saharan Africa: examples from Kenya and Cameroon. In J. Fanzo, D. Hunter, T. Borelli, & F. Mattei (Eds.), Diversifying food and diets: using agricultural biodiversity to improve nutrition and health (pp. 257–269). London: Earthscan.
Kew Science. (2017). Plants of the World online. http://www.plantsoftheworldonline.org/. Accessed 12th April 2019.
Kindt, R., van Breugel, P., Orwa, C., Lillesø, J.P.B., Jamnadass, R., & Graudal, L. (2015). Useful tree species for Eastern Africa: a species selection tool based on the Vegetationmap4africa map. Version 2.0. World Agroforestry Centre (ICRAF) and Forest & Landscape Denmark. http://vegetationmap4africa.org. Accessed 13 June 2018.
KNBS. (2014). Kenya Demographic and Health Survey. Kenya National Bureau of Statistics, Nairobi, Kenya. https://dhsprogram.com/pubs/pdf/fr308/fr308.pdf. Accessed 15th April 2018.
Koppmair, S., Kassie, M., & Qaim, M. (2017). Farm production, market access and dietary diversity in Malawi. Public Health Nutrition, 20(2), 325–335.
Kumar, N., Harris, J., & Rawat, R. (2015). If They Grow It, Will They Eat and Grow? Evidence from Zambia on Agricultural Diversity and Child Undernutrition. The Journal of Development Studies, 51(8), 1060–1077.
Lock, K., Pomerleau, J., Causer, L., & McKee, M. (2004). Low Fruit and Vegetable Consumption. In M. Ezzati, A. D. Lopez, A. Rodgers, & C. J. L. Murray (Eds.), Comparative Quantification of Health Risks: Global and Regional Burden of Diseases Attributable to Selected Major Risk Factors. Geneva: World Health Organization.
Machakos CIDP. (2015). Machakos County Integrated Development Plan http://www.machakosgovernment.com/documents/CIDP.pdf. Accessed 17th April 2018.
McMullin, S., Stadlmayr, B., Roothaert, R., & Jamnadass, R. (2019). Fresh fruit and vegetables: contributions to food and nutrition security. In P. Ferranti, E. M. Berry, & J. R. Anderson (Eds.), Encyclopedia of food security and sustainability. Volume 3: Sustainable Food Systems and Agriculture (pp. 217–225). Amsterdam: Elsevier.
Micha, R., Coates.J., Leclercq, C., Charrondiere, U.R., & Mozaffarian, D. (2018). Global dietary surveillance: data gaps and challenges. Food and Nutrition Bulletin, Volume 39, Issue 2. https://doi.org/10.1177/0379572117752986, 175, 205.
Muoki, P., Makokha, A., Onyango, C., & Ojijo, N. (2009). Potential contributions of mangoes to reduction of vitamin A deficiency in Kenya. Ecology of Food and Nutrition, 48, 482–498.
Muraki I, Imamura F, Manson JE, et al. (2013). Fruit consumption and risk of type 2 diabetes: results from three prospective longitudinal cohort studies. BMJ, 2013; 347: f5001.
Ng’endo, M., Keding, G. B., Bhagwat, S., & Kehlenbeck, K. (2015). Variability of On-Farm Food Plant Diversity and Its Contribution to Food Security: A Case Study of Smallholder Farming Households in Western Kenya. Agroecology and Sustainable Food Systems, 39(10), 1071–1103. https://doi.org/10.1080/21683565.2015.1073206.
Ng’endo, M., Bhagwat, S., & Keding, G. B. (2017). Contribution of Nutrient Diversity and Food Perceptions to Food and Nutrition Security Among Smallholder Farming Households in Western Kenya: A Case Study. Food and Nutrition Bulletin, 39, 1–21. https://doi.org/10.1177/0379572117723135.
Prabhu, R., Barrios, E., Bayala, J., Diby, L., Donovan, J., Gyau, A., Graudal, L., Jamnadass, R., Kahia, J., Kehlenbeck, K., Kindt, R., Kouame, C., McMullin, S., van Noordwijk, M., Shepherd, K., Sinclair, F., Vaast, P., Vågen, T.G., & Xu, J. (2015). Agroforestry: realizing the promise of an agroecological approach. Biodiversity and ecosystem services in agricultural production systems. Agroecology for food security and nutrition Proceedings of the FAO International Symposium. 18-19 September 2014, Rome, Italy.
Pretty, J., Benton, T. G., Bharucha, Z. P., Dicks, L. V., Butler Flora, C., Godfray, C. J., Goulson, D., Hartley, S., Lampkin, N., Morris, C., Pierzynski, G., Vara Prasas, P. V., Reganold, J. R., Rockström, J., Smith, P., Thorne, P., & Wratten, S. (2018). Global assessment of agricultural system redesign for sustainable intensification. Nature Sustainability, 1, 441–446.
Remans, R., DeClerck, F. A., Kennedy, G., & Fanzo, J. (2015). Expanding the view on the production and dietary diversity link: scale, function and change over time. Proceedings of the National Academy of Sciences of the United States of America, 112, E6082.
Ruel, M., & Alderman, H. (2013). Nutrition sensitive interventions and programmes: how can they help to accelerate progress in improving maternal and child nutrition. The Lancet, 382, 536–551.
Ruel, M. T., Minot, N., & Smith, L. (2005). Patterns and determinants of fruit and vegetable consumption in sub-Saharan Africa. In Paper presented at the joint FAO/WHO workshop on fruit and vegetables for health, 1–3 Sept 2004. Kobe: Japan.
Siaya CIDP. (2016). Siaya County Integrated Development Plan 2013-2017. https://roggkenya.org/wp-content/uploads/docs/CIDPs/Siaya-County-Integrated-Development-Plan_CIDP_2013-2017.pdf. Accessed 17th April 2018.
Sibhatu, K.T., Krishna, V.V., & Qaim, M. (2015). Production diversity and dietary diversity in smallholder farm households. PNAS, vol. 112, | no. 34, 0657–10662. www.pnas.org/cgi/doi/10.1073/pnas.1510982112.
Siegel, K. R., Ali, M. K., Srinivasiah, A., Nugent, R. A., & Narayan, K. M. V. (2014). Do We Produce Enough Fruits and Vegetables to Meet Global Health Need? PLoS One, 9, e104059. https://doi.org/10.1371/journal.pone.0104059.
Stadlmayr, B., Charrondière, U. R., Enujiugha, V. N., Bayili, R. G., Fagbohoun, E. G., Samb, B., Addy, P., Barikmo, I., Ouattara, F., Oshaug, A., Akinyele, I., Amponsah Annor, G., Bomfeh, K., Ene-Obong, H., Smith, I. F., Thiam, I., & Burlingame, B. (2012). West African food composition table/table De Composition Des Aliments D’afrique De L’ouest. Rome: FAO.
Stadlmayr, B. C., Charrondiere, R., Eisenwagen, S., Jamnadass, R., & Kehlenbeck, K. (2013). Nutrient composition of selected indigenous fruits from sub Saharan Africa. Journal of the Science of Food and Agriculture, 93(11), 2627–2636.
Stevens, B., Watt, K., Brimbecombe, J., Clough, A., Judd, J., & Lindsay, D. (2017). The role of seasonality on the diet and household food security of pregnant women living in rural Bangladesh: A cross-sectional study. Public Health Nutrition, 20(1), 121–129. https://doi.org/10.1017/S136898001600183X.
United Nations (2016). Sustainable Development Goals https://sustainabledevelopment.un.org/sdg2. Accessed 3 July 2018.
USDA. (2015). USDA National Nutrient Database for Standard Reference, Release 28. U.S. Department of Agriculture, Agricultural Research Service, Nutrient Data Laboratory.
van Breugel, P., Kindt, R., Lillesø, J.P.B, Bingham, M., Demissew, S., Dudley, C., Friis, I., Gachathi, F., Kalema, J., Mbago, F., Moshi, H.N, Mulumba, J., Namaganda, M., Ndangalasi, H.J., Ruffo, C.K., Védaste, M., Jamnadass, R., and Graudal, L. (2015). Potential Natural Vegetation Map of Eastern Africa (Burundi, Ethiopia, Kenya, Malawi, Rwanda, Tanzania, Uganda and Zambia). Version 2.0. Forest & Landscape Denmark and World Agroforestry Centre (ICRAF). URL: http://vegetationmap4africa.org. Accessed 13 June 2018.
Vorster, H. H., Kruger, A., & Margetts, B. M. (2011). The nutrition transition in Africa: can it be steered into a more positive direction? Nutrients, 3(4), 429–441. https://doi.org/10.3390/nu3040429.
WHO. (2010). Nutrition Landscape Information Systems (NLiS). http://apps.who.int/nutrition/landscape/report.aspx. Accessed 22nd November 2017.
WHO. (2015). Healthy Diet. Factsheet Nr 394. World Health Organization, Geneva, Switzerland. http://www.who.int/mediacentre/factsheets/fs394/en /. Accessed 22nd May 2018.
Willett, W., Rockström, J., Loken, B., Springmann, M., Lang, T., Vermeulen, S., Garnett, T., Tilman, D., DeClerck, F., Wood, A., Jonell, M., Clark, M., Gordon, L.J, Fanzo, J., Hawkes, C., Zurayk, R., Rivera, J.A., de Vries, W., Sibanda, L.M., Afshin, A., Chaudhary, A., Herrero, M., Agustina, R., Branca, F., Lartey, A., Fan, S., Crona, B., Fox, E., Bignet, V., Troell, M., Lindahl, T., Singh, S., Cornell, S.E., Srinath Reddy, K., Narain, S., Nishtar, S., Murray, C.J.L. et al. (2019). Food in the Anthropocene: the EAT–Lancet Commission on healthy diets from sustainable food systems. The Lancet, 393 447–492.
Acknowledgments
The authors wish to acknowledge the funding provided by the European Commission (EC) and International Fund for Agricultural Development (IFAD) for the Fruiting Africa Project led by World Agroforestry (ICRAF). We thank anonymous reviewers for their comments that improved the manuscript. We also thank Ian Dawson (ICRAF) for assistance in editing our manuscript.
Author information
Authors and Affiliations
Corresponding author
Ethics declarations
Conflict of Interest
The authors declared that they have no conflict of interest.
Informed consent
Informed consent was obtained from all individual participants included in the study.
Rights and permissions
Open Access This article is distributed under the terms of the Creative Commons Attribution 4.0 International License (http://creativecommons.org/licenses/by/4.0/), which permits unrestricted use, distribution, and reproduction in any medium, provided you give appropriate credit to the original author(s) and the source, provide a link to the Creative Commons license, and indicate if changes were made.
About this article

Cite this article
McMullin, S., Njogu, K., Wekesa, B. et al. Developing fruit tree portfolios that link agriculture more effectively with nutrition and health: a new approach for providing year-round micronutrients to smallholder farmers. Food Sec. 11, 1355–1372 (2019). https://doi.org/10.1007/s12571-019-00970-7
Received:
Accepted:
Published:
Issue Date:
DOI: https://doi.org/10.1007/s12571-019-00970-7