When it comes to “investing” (roughly defined here as “putting money into investment vehicles with the intent of generating long-term growth of capital”), trend-following approaches tend to yield the best results (at least according to your esteemed author).
But when it comes to “trading” (roughly defined here as “speculating on shorter-term movements in the price of securities with the intent – if we’re being honest – of making as much money as possible as quickly as possible) anything goes.
When “trading”, it is OK to enter incredibly speculative positions (in fact some might argue that that is the whole point) in an effort to capture quick – and with any luck, sizeable – gains.
The key is to limit the amount of risk you expose yourself to in the process.
One Example
What follows is – as always – NOT a trade recommendation. It simply serves to illustrate the points I am trying to make.
Ticker XLF is presently beaten down, hated and loathed – not to mention unloved. In addition, in the last month it has broken down below its 200-day moving average. A quick glance at Figure 1 reveals a stock that most “investors” would have no trouble staying away from.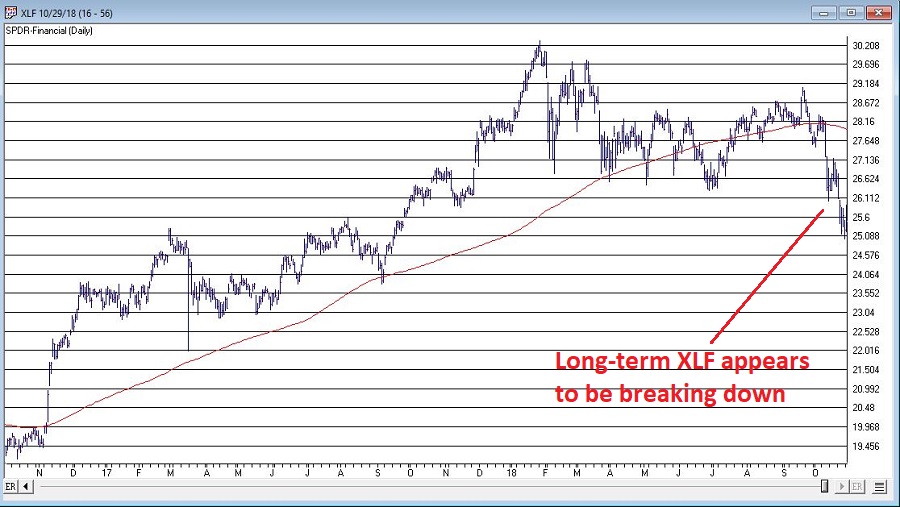 Figure 1 – XLF trend appears to be breaking down (Courtesy AIQ TradingExpert)
But we are not talking today about “investing”. We are talking about “trading/speculating”. So, let’s consider the following:
*The stock market tends to perform well during the last few days of October/first few days of November.
*Sentiment for XLF has been in a range that often precedes advances (See Figure 2.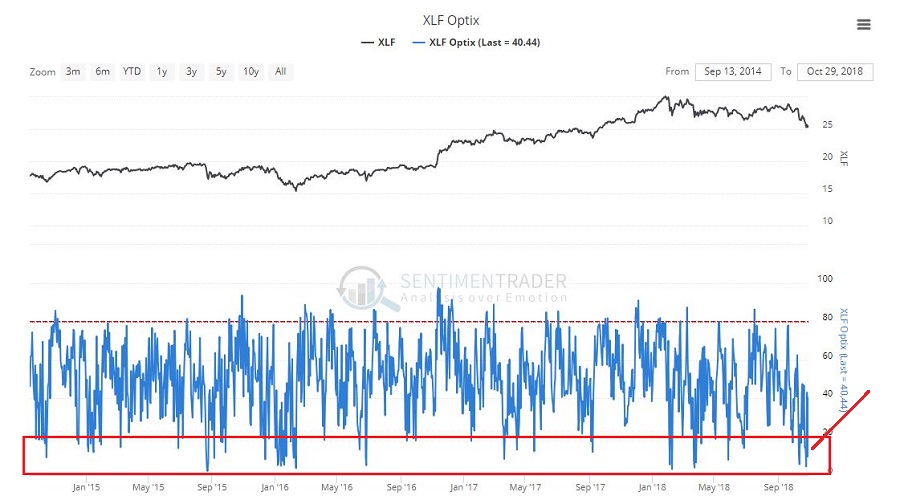 Figure 2 – Sentiment has been very bearish for XLF (Courtesy Sentimentrader.com)
*The 3-day RSI for XLF is signaling a potential bullish divergence. See Figure 3
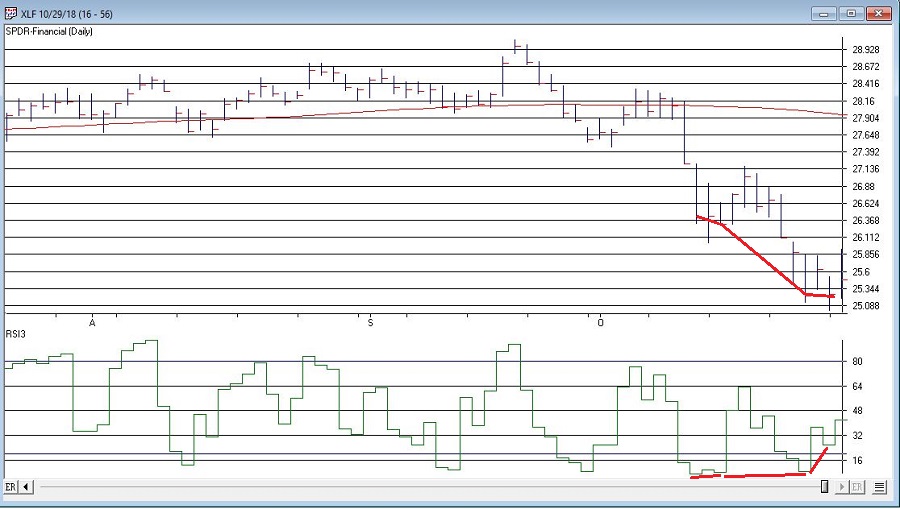 Figure 3 – Potential bullish divergence between XLF and it’s 3-day RSI (Courtesy AIQ TradingExpert)
XLF and 3-day RSI made a low on 10/11. Price made subsequent new lows on 10/15 and 10/24 while RSI made higher lows – thus forming a potential bullish divergence.
What to Do
If you are an “investor”, the thing to do is to stop reading and move on to the next thing on your “To Do” list.
If you are a trader/speculator the next thing to do is to assess:
*Is this a situation worth risking money on?
*And, if “Yes”, assessing how to play it without taking too much risk
One potential example play appears below. This play involves simply buying the Dec 26 call option on ticker XLF. The particulars appear in Figure 4 and the risk curves in Figure 5
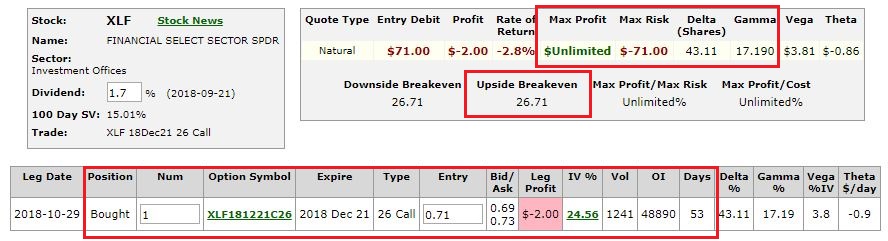 Figure 4 – XLF Dec 26 call (Courtesy www.OptionsAnalysis.com)
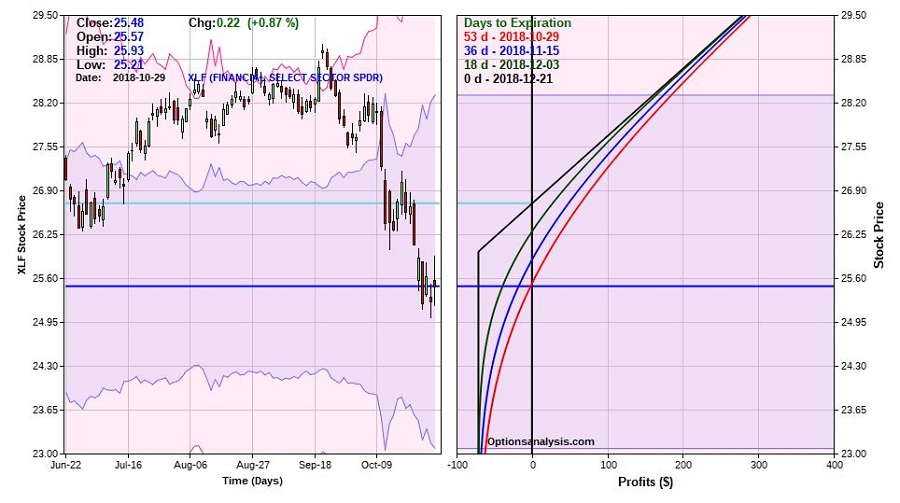 Figure 5 – XLF Dec 26 call risk curves (Courtesy www.OptionsAnalysis.com)
As this is written, buying a one-lot costs $71. A trader with a $25K account who is willing to risk 2% (or $500) on a trade could buy up to 7 of the Dec 26 calls ($71 x 7 = $497).
In terms of trade management:
*If the trade does no show a profit with 30 days left until expiration it might be a good idea to exit and cut one’s loss.
*This is a short-term speculative play so in terms of profit, the trade should be looking to either, a) take a profit, or b) sell some at a profit and let the rest ride, at the first decent opportunity.
Summary
Remember, I am not “predicting” that XLF is about to rally nor am I “recommending” the trade displayed above. I am simply pointing out one example approach to Serious Contrarian Speculation
Jay Kaeppel
Disclaimer: The data presented herein were obtained from various third-party sources. While I believe the data to be reliable, no representation is made as to, and no responsibility, warranty or liability is accepted for the accuracy or completeness of such information. The information, opinions and ideas expressed herein are for informational and educational purposes only and do not constitute and should not be construed as investment advice, an advertisement or offering of investment advisory services, or an offer to sell or a solicitation to buy any security.

