Nothing last forever. And there are no permanent advantages in the stock market. But history is a pesky thing. And yes, some things do seem to work better than others.
Take the “November-April Five Portfolio” listed below for example (with potential ETF substitutes).
| Sector | Fidelity | ETF |
| Electronics | FSELX | SMH or XSD |
| Construction | FSHOX | ITB or XHB |
| Chemicals | FSCHX | XLB |
| Hospitals | FSHCX | IHF |
| Retailing | FSRPX | XLY |
Figure 1 – The November-April Five
Figure 2 shows some performance numbers for each of the Fidelity funds listed in Figure 1 if held ONLY from the close on Oct 31 through the close on Apr 30th every year starting in October 1986
| Sector | Fidelity | Ave % +(-) | % times UP |
| Electronics | FSELX | +15.3% | 88% |
| Construction | FSHOX | +14.1% | 88% |
| Chemicals | FSCHX | +13.3% | 94% |
| Hospitals | FSHCX | +10.2% | 73% |
| Retailing | FSRPX | +12.3% | 85% |
Figure 2 – The November-April Five individual Results (Nov-Apr, 1986-2019) (Source: Calculated using Monthly Total Return data from PEP Database by Callan Associates)
The blue line in Figure 3 displays the growth of $1,000 split equally between the 5 funds listed in Figure 1 each November 1st and held through the following April 30th. The orange line represents the growth of an investment in ticker VFINX (Vanguard S&P 500 Index fund) during the same 6-month period each year.
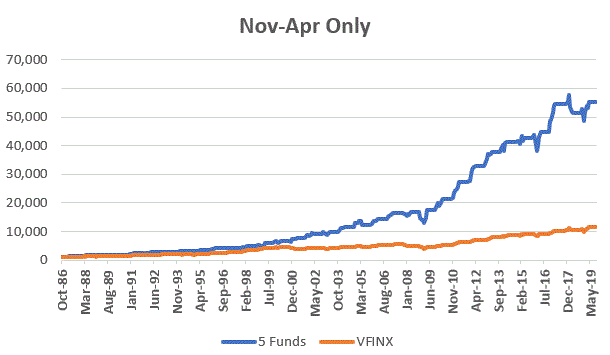
Figure 3 – Growth of $1,000 invested in 5 Fidelity Funds versus VFINX – Nov 1 through Apr 30 ONLY ; 1986-2019
Figure 4 displays a few comparative numbers between the Fidelity 5 and VFINX only during November through May.
| Measure | Fidelity | VFINX |
| Average % | +13.0% | +8.1% |
| % times UP | 94% | 85% |
Figure 4 – Fidelity November-April Five annual results versus S&P 500 Index (VFINX); November through April ONLY; 1986-2019
Finally, Figure 5 displays the year-by-year results (for just the months of November through April – no gain or loss is added or subtracted during May through October).
| Start | End | Fidelity 5 | VFINX | Difference |
| 1986 | 1987 | 18.8 | 19.7 | (1.0) |
| 1987 | 1988 | 19.3 | 5.4 | 13.9 |
| 1988 | 1989 | 15.2 | 12.9 | 2.3 |
| 1989 | 1990 | 3.7 | (1.3) | 5.0 |
| 1990 | 1991 | 52.5 | 25.4 | 27.1 |
| 1991 | 1992 | 11.7 | 7.2 | 4.4 |
| 1992 | 1993 | 5.7 | 6.5 | (0.8) |
| 1993 | 1994 | 8.7 | (2.4) | 11.1 |
| 1994 | 1995 | 7.1 | 10.4 | (3.3) |
| 1995 | 1996 | 16.9 | 13.7 | 3.1 |
| 1996 | 1997 | 9.3 | 14.7 | (5.4) |
| 1997 | 1998 | 16.6 | 22.4 | (5.8) |
| 1998 | 1999 | 19.3 | 22.4 | (3.1) |
| 1999 | 2000 | 19.8 | 7.2 | 12.5 |
| 2000 | 2001 | 2.7 | (12.1) | 14.8 |
| 2001 | 2002 | 22.2 | 2.2 | 19.9 |
| 2002 | 2003 | 0.6 | 4.4 | (3.8) |
| 2003 | 2004 | 7.3 | 6.2 | 1.1 |
| 2004 | 2005 | 11.3 | 3.2 | 8.1 |
| 2005 | 2006 | 12.9 | 9.6 | 3.3 |
| 2006 | 2007 | 11.1 | 8.5 | 2.6 |
| 2007 | 2008 | (11.4) | (9.7) | (1.7) |
| 2008 | 2009 | 9.4 | (8.5) | 17.9 |
| 2009 | 2010 | 27.1 | 15.6 | 11.5 |
| 2010 | 2011 | 25.7 | 16.3 | 9.4 |
| 2011 | 2012 | 18.4 | 12.7 | 5.7 |
| 2012 | 2013 | 14.8 | 14.3 | 0.5 |
| 2013 | 2014 | 8.0 | 8.3 | (0.2) |
| 2014 | 2015 | 9.8 | 4.3 | 5.5 |
| 2015 | 2016 | 1.0 | 0.4 | 0.7 |
| 2016 | 2017 | 17.7 | 13.2 | 4.5 |
| 2017 | 2018 | 5.0 | 3.8 | 1.2 |
| 2018 | 2019 | 11.8 | 9.7 | 2.1 |
Figure 5 – Year-by-Year Results (Source: Monthly Total Return data from PEP Database by Callan Associates)
Summary
The results above are (at least in my market-addled mind) fairly compelling.
Nevertheless, do not make the mistake of thinking that “you can’t lose” by trading the funds listed above during the times listed above. Finally, as always, I am NOT “recommending” the funds above – just highlighting some interesting market history.
Jay Kaeppel
Disclaimer: The information, opinions and ideas expressed herein are for informational and educational purposes only and are based on research conducted and presented solely by the author. The information presented does not represent the views of the author only and does not constitute a complete description of any investment service. In addition, nothing presented herein should be construed as investment advice, as an advertisement or offering of investment advisory services, or as an offer to sell or a solicitation to buy any security. The data presented herein were obtained from various third-party sources. While the data is believed to be reliable, no representation is made as to, and no responsibility, warranty or liability is accepted for the accuracy or completeness of such information. International investments are subject to additional risks such as currency fluctuations, political instability and the potential for illiquid markets. Past performance is no guarantee of future results. There is risk of loss in all trading. Back tested performance does not represent actual performance and should not be interpreted as an indication of such performance. Also, back tested performance results have certain inherent limitations and differs from actual performance because it is achieved with the benefit of hindsight.

