Article

Land Use and Land Cover Change in the Bale Mountain Eco-Region of Ethiopia during 1985 to 2015

by
Sisay Nune Hailemariam
1,*,
Teshome Soromessa
1 and
Demel Teketay
2
1
Center for Environmental Science, College of Natural Sciences, Addis Ababa University, P.O. Box 1176, Addis Ababa, Ethiopia
2
Department of Crop Science and Production, Botswana University of Agriculture and Natural Resources, Private Bag 0027, Gaborone, Botswana
*
Author to whom correspondence should be addressed.
Submission received: 25 July 2016 / Revised: 30 September 2016 / Accepted: 4 November 2016 / Published: 17 November 2016

Abstract

:
Anthropogenic factors are responsible for major land use and land cover changes (LULCC). Bale Mountain Eco-Region in Ethiopia is a biodiversity-rich ecosystem where such LULCC have occurred. The specific objectives of this study were to: (i) determine which LULC types gained or lost most as a result of the observed LULCC; (ii) identify the major drivers of the LULCC/deforestation; and (iii) assess the approximate amount of carbon stock removed as a result of deforestation during the study period. Remote sensing and GIS were used to analyze LULCC. Landsat images acquired in 1985, 1995, 2005, and 2015 were used. Additionally, data from the Central Statistics Agency on cropland expansion, and human and livestock population growth were analyzed and correlations were made. The results showed that forest lost 123,751 ha while farmland gained 292,294 ha. Farmland and urban settlement expansion were found to be major drivers of LULCC. Aboveground carbon stock removed from forest and shrubland was more than 24 million tons. In the future, allocation of land to different uses must be based on appropriate land use policies. Integrating biodiversity and ecosystem values for each land cover as per the UN Sustainable Development Goal (UN-SDG) 15.9 may be one of the mechanisms to limit unplanned expansion or invasion of one sector at the expense of another.

1. Introduction

Land use and land cover change (LULCC) refers to human modification of the terrestrial surface of the Earth [1]. The negative impact of LULCC on biodiversity, climate, water, soil, and air, in particular, and on ecosystem services in general, has been recognized as one of the greatest environmental concerns for human populations today [2]. LULCC is not a recent phenomenon in Ethiopia; for example, the World Resource Institute (WRI) [2] has reported such events to have occurred during 7000–1800 BCE. However, current LULCC is aggravated by the scale, speed, and long-term nature of civilization [1,2].
Much of the direct change is a consequence of land use, and today about 40% of the land surface is used for agriculture (crops and pasture) [3]. In addition to cropland, tree plantations, urbanization in order to produce food, timber, housing, and other commodities have resulted in the reduction of many ecosystem services, including biodiversity [4].
Globally, agriculture and associated land use changes have been the principal drivers of deforestation and were responsible for 24% of global greenhouse gas (GHG) emissions in 2010 [5]. From 1970 to 2011, CO2 emissions increased by about 90%, and agriculture, deforestation, and other land use changes have been the second largest sources of global carbon emissions, next to the use of fossil fuels [5]. Agriculture accounts for 14% of GHG emissions (6.8 Gt of CO2) [6]. The GHG emissions from this sector are highly likely to increase as humans struggle to increase food production by the required 70% by 2050 [6]. Tropical deforestation has been responsible for 15%–25% of annual global GHG emissions, and accounts for nearly 70% of total GHG emissions in Africa [7].
For example, in Ethiopia, the estimated forest area in 1955 was 17 million ha, but by 1979 it dropped dramatically to 3.4 million ha, with the average annual loss shown in Table 1 [8]. However, FAO reported that 11.4% of land in Ethiopia is covered by forest [9]. A highland reclamation study [10] revealed the consequences of deforestation and permanent removal of other vegetation in the Ethiopian highlands. Accordingly, about 27.5 million ha of the areas examined showed significant signs of accelerated soil erosion, while about 14.5 million ha of land were considered the ‘worst affected areas’ and were recommended to be abandoned [8].
LULCC contributes to climate change in Ethiopia. The agriculture sector (livestock, crop, and forestry) contributed 88% of the total GHG emissions in Ethiopia in 2010 [11]. The total accounted GHG emissions during that period was 150 Mt CO2e, of which 133 Mt CO2e was from agriculture. Livestock exhibited the biggest share of GHG emissions (65 Mt CO2e), followed by forestry (55 Mt CO2e) and crop production (13 Mt CO2e) [11]. The major activities contributing to GHG emissions in forestry were deforestation for agricultural expansion, forest degradation for fuelwood, and limited formal and informal logging [11,12].
There is uncertainty as to how much the economy of Ethiopia may be affected as a result of the ongoing climate change, but a reduction of 10% or more of the GDP has been projected in all sectors by 2050 [13]. Mideksa [14] pointed out that climate change may hit economic development hard in two ways. Firstly, it will reduce agricultural production and output in the sectors linked to agriculture, which is likely to reduce the GDP of Ethiopia by about 10% from its benchmark level. Secondly, it will lead to income inequality in which the Gini coefficient increases by 20%, causing further decline in economic growth, which, in turn, will fuel poverty. (The Gini coefficient is mainly used to measure income inequality. The range of the coefficient is [0,1], with 0 representing perfect equality [15]). Thus, climate change is expected to increase the proportion of people living in poverty, which ultimately may drive more LULCC.
On top of the impact on the economy, climate change and weather-related impacts in Ethiopia have claimed a lot of lives already. In addition to the number of animal lives lost as a result of the famines during 1972–1973 and 1984–1985, an estimate made by different authors indicated that the lives of 560,000 people were lost [16]. Historically, more than 40 mass mortality famines are known to have afflicted Ethiopia in the past thousand years [17]. For example, “The Great Ethiopian Famine” of 1882–92 claimed one-third of the population of Ethiopia [17]. Despite the fact that human lives continued to be lost, the population in Ethiopia increased four-fold between 1990 and 1998 [18].
LULCC analysis has become an important tool to generate evidence for decision-makers, spatial planners, local communities, or actors who are operating within a given landscape to formulate appropriate policies and strategies, generate data for spatial planning, and develop detailed land use plans as well as understand agents of change. Hence, LULCC analysis helps decision-makers ensure sustainable development and understand the dynamics of the changing environment [19].
The current debate on the importance of the landscape approach requires sufficient data on land use and land cover to continue to successfully monitor the efficiency of the landscape approach. Therefore, information on spatial and temporal analyses of LULCC becomes indispensable.
Various authors addressed LULCC in Ethiopia, their focus varying greatly in terms of thematic area as well as spatial locations [20,21,22,23,24,25,26]. However, comprehensive and national scale analysis was conducted by the Woody Biomass Inventory and Strategic Planning Project (WBISPP), which has produced land use and land cover maps for Ethiopia [27]. All of these studies highlighted that land use and land cover change has an impact on biodiversity, water resources, forest and local livelihoods, among others. The main drivers are linked to farmland expansion and population growth.
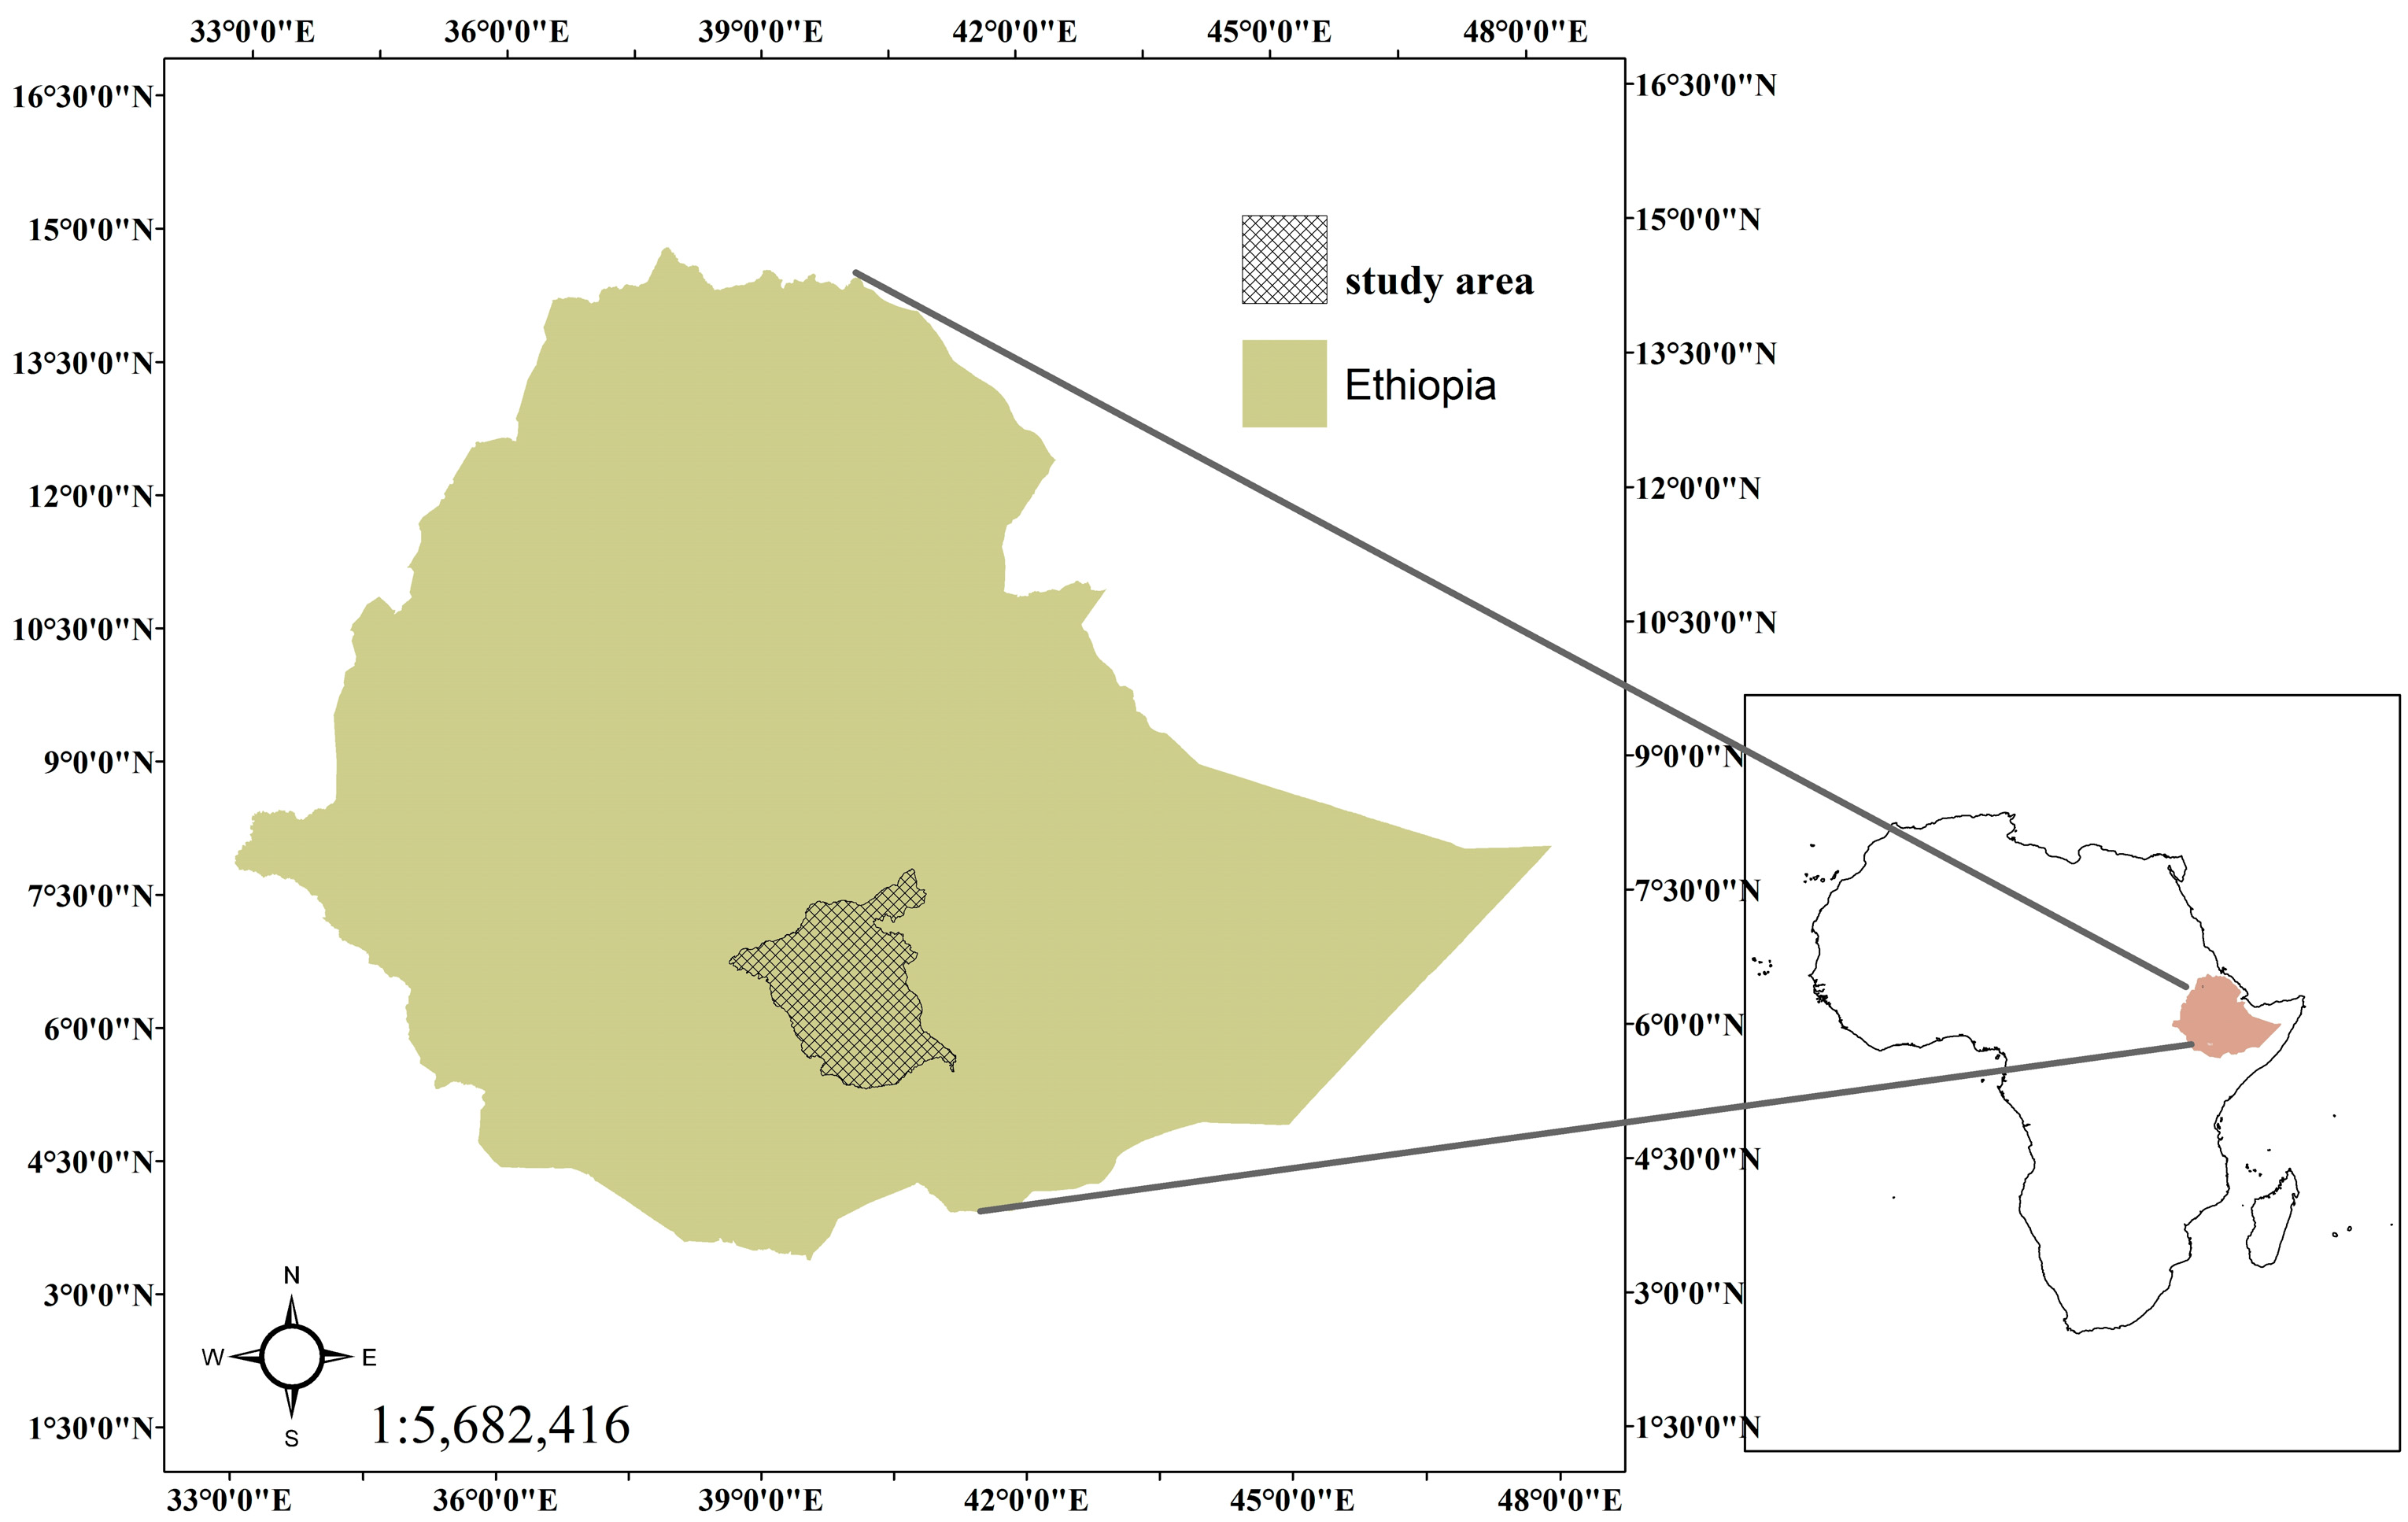
LULCC analyses undertaken in the Bale Mountains Eco-Region (BMER) in Ethiopia are limited either spatially or temporally. For example, two studies conducted by different authors concentrated on the Bale Mountain National Park (BMNP) within the BMER, covering some 220,000 ha [28]. The first study, which was carried out in 2007, detected changes over a period of 33 years by considering the years 1973, 2000, and 2005 [29]. The second study considered changes over four decades, from 1973 to 2008, focusing specifically on the years 1973, 1987, 2000, and 2008 [30]. Warra et al. [31] have also analyzed aerial photographs from 1965 and 1973 and SPOT 5 from 2007 in the Kasso catchment of the BMNP. Another recent land cover analysis was undertaken by the Oromia Forest and Wildlife Enterprise (OFWE) with the support of FARM Africa and SOS Sahel for the preparation of a REDD+ Project Design Document [31]. The study conducted by OFWE et al. [32] covered the years 2000, 2005, 2009, and 2011. Spatially, the study that was carried out by OFWE is comparable with the current study, but the area covered in the study was smaller in area by at least 1.5 million ha.
The current study can be considered as a bridge between the studies carried out in 2007, 2012, 2013, and 2014, and similar future analyses. This study covered about 3.8 million ha of the BMER, which none of the above mentioned studies have addressed, and would fill the gap in information at both temporal and spatial scales. Additionally, this study is relevant to the Climate Resilient Green Economy (CRGE) Strategy of Ethiopia [11] and UN Sustainable Development Goal indicator number 15.
The specific objective of the study was, therefore, to analyze LULCC between 1985 and 2015 in BMER, and identify major land uses that have undergone major changes using Remote Sensing (RS) and Geographic Information System (GIS). The following research questions were addressed: (i) Which LULC types gained or lost most as a result of the observed LULCC? (ii) What are the major drivers of the LULCC/deforestation? and (iii) What was the approximate amount of carbon stock removed as a result of deforestation during the study period?

2. Materials and Methods

2.1. Study Area

BMER is located, geographically, between 5°16ʹ54″N to 7°52ʹ55″N and 38°37ʹ52″E to 41°13ʹ0″E (Figure 1). BMER is found in one of the nine national regional states, called Oromiya. The BMER presents very interesting physiographic attributes. The central area of the eco-region is a high plateau, much of which is above 3000 m. Several peaks rise from this plateau, including Tullu Dimtu (4377 m), the second highest peak in Ethiopia.
There are about 40 streams and springs [28,32], which feed into five major rivers, Wabishebele, Genale, Dumel, Web, and Welmel [32].
In 2004, the WBISPP classified the BMER into eight major land use and land cover classes, namely, Afro-alpine heath vegetation, grassland, bushland, forest, shrubland, exposed rock and sand surface, cultivated land, woodland, and seasonal marsh. OFWE et al. [32] carried out in-depth analyses of moist and dry forests in addition to the vegetation types they considered, such as grasslands, shrubland, and woodlands. Kidane et al. [30] also analyzed 11 land use and land cover classes in their study area. They focused on agricultural land, Afromontane grassland and forest, Erica forest, shrubland and herbaceous formation, barren and burned areas, and water bodies. Warren et al. [31] dealt with six land use/cover types, namely agricultural rural settlements, grassland, bushland, Afroalpine scrub, woodland, and forestland. Despite the fact that there are similarities in some of the land uses and land covers in the abovementioned studies, their findings show some differences in the final products. This probably stems from a lack of LULCC classification protocol in the country.
Climate variation within the eco-region shows an interesting pattern. At high elevations, such as the Sanetti plateau, which includes the second highest mountain in Ethiopia, Tullu Dimtu, the annual average temperature is less than 7.5 °C, whereas at the lower altitude (500–1000 m) the temperature is higher, reaching an annual average of more than 27.5 °C [27]. There is also variation in the pattern of rainfall in the study area. In some parts of the BMER, a bi-modal rainfall is experienced, while other parts, mainly the western part, receive a uni-modal pattern of rainfall. The annual rainfall in the area ranges from 600 to 1400 mm [27]. Temperature and rainfall determine the land cover pattern, keeping other factors, such as soils, constant.
BMER comprises diverse and unique fauna and flora, which are well documented by different authors [29,30,33,34].
Agricultural land expansion is reported in the study area by different authors, (e.g., [30]). The report indicated that, within 35 years, the agricultural land area increased from 136.39 to 735.39 km2 within the study area. In general, in BMER, the major crops produced are cereals, e.g., barley (Hordeum vulgare L.), wheat (Triticum sativum Lam.), and teff (Eragrostis tef (Zucc.) Trotter); pulses, e.g., fava beans (Vicia fava L.), field peas (Pisum sativum L.), and haricot beans (Phaseolus vulgaris L.); and oilseeds, e.g., linseed (Linum usitatissimum L.) and sesame (Sesamum indicum L.). Vegetables, root crops, and fruits are also grown on a limited scale by some farmers [35].

2.2. Methods

In this study, Landsat images acquired in 1985, 1995, 2005, and 2015 were used. The images, which are georeferenced and radiometrically corrected, were accessed from the United States Geological Survey (USGS) website (http://www.usgs.gov, accessed on 11 November 2015). Landsat images are medium-resolution remote sensing tools that are used for land use and land cover change analyses. The Landsat program is the oldest Earth Observation Program, which was started in 1972 [36]. Of the many applications that Landsat is useful for, mapping of land cover, land use, soils, and geology is worth noting [36]. Thematic Mapper (TM) and Enhanced Thematic Mapper (ETM) are the two sensors in Landsat, which have been in use since 1982. The sensors are important for LULCC analyses. Obtaining adequate datasets requires the selection of type of sensor, relevant wavelength bands, and date(s) of acquisition.
Dry season and cloud-free images were used since they make conducting the analyses easier. The satellite images cover 185 × 185 km with a spatial resolution of 30 m, i.e., a single pixel in the image represents 30 × 30 m on the ground. The acquisition dates of the satellite images slightly differ within and between years, though the acquisition was carried out within the months of December, January, and February.
ENVI 5.0 and ArcGIS 10.0 were used during image processing and classification as well as production of the final LULCC maps.
The land use and land cover change analyses followed standard procedures (Figure 2).

2.2.1. Image Processing

Satellite images, hereafter images or image, are digital files comprising pixels (picture elements) that represent measured local reflectance (emission or backscatter) values in some designated part of the electromagnetic spectrum [36]. The major image processing steps undertaken are image layer stacking, resampling, and image enhancement of the image dataset, which are of utmost importance for LULC analyses.
Layer stacking is a method to build a new multiband file from geo-referenced images of various pixel sizes, extents, and projections. The input bands were re-sampled and re-projected to a common user-selected output projection and pixel size. The output file usually has a geographic extent that either encompasses all of the input file extents or only the data extent where all of the files overlap. Accordingly, six bands of the Landsat 7 images (1, 2, 3, 4, 5, and 7) of each year and three bands (2, 3, and 4) for Landsat 5 were layer stacked to form one full image with all bands to help the interpreter understand all features in the study area.
The re-sample operation resamples a raster map from the map’s current geo-reference to another target geo-reference [37]. The coordinate of each output pixel is used to calculate a new value from close-by pixel values in the input map using the nearest neighbor re-sampling method. Nearest neighbor re-sampling uses the digital value from the pixel in the original image that is nearest to the new pixel location in the corrected image. This is the simplest method and does not alter the original values [38].
For the improvement of image interpretability, image enhancement is important [36,37]. Image enhancement makes a raw image readily interpretable for a particular application [36]. False color composite, edge enhancement, and linear stretching were applied.
After all the images were corrected in the same way, all scenes from the same year were mosaicked together to cover the study area. From the mosaicked image, the portion that fell within the study area was extracted (subsetting) to limit the size of the mosaicked image to the size of the study area for preliminary classification, field verification, and the processing work to take place at a later stage.

2.2.2. Classification

Unsupervised classification was not necessary due to the fact that the authors have knowledge of the area [36]. Moreover, results of the earlier LULCC analyses were used to train the computer/software. Therefore, the main focus in this research was the supervised classification. The areas of interest were derived from a literature review, general area knowledge, and limited field visits. A total of eight land use and land cover classes were identified. All eight classes were identified in all images representing the years under investigation in a consistent manner.
Once a preliminary LULC map was produced for each year, a field visit was conducted in January 2016 to identify the LULC classes on the ground and gather training points in a more robust way. The eight classes were identified, namely Afroalpine vegetation, Erica vegetation, forest, woodland, shrubland, grassland, farmland, and urban settlements. For training points, more than 30 samples per LULC class were randomly assigned [36]. Simple random sampling was employed. Aerial photographs, SPOT images, classifications and descriptions made by Woody Biomass Inventory Strategic Planning Project, and data from field observations were used to generate reference data. In total, using a handheld Global Positioning System (GPS), 300 sample areas were gathered for training and testing. The actual classification was carried out after the training data had been established (half of the sample data) and the classification algorithm (Maximum Likelihood classifier) was selected. Maximum Likelihood classifier uses a parametric statistical approach to prepare the probability density distribution functions for each individual class [38]. Hence, the Maximum Likelihood classifier considers not only the cluster center but also its shape, size, and orientation [36]. The assumption of most Maximum Likelihood classifiers is that the statistics of the clusters have a ‘normal’ (Gaussian) distribution. The data collected during the ground truth were stored in Excel and converted to shape files using Arc GIS 10.0 Software and used for LULC classification, analysis, and accuracy assessments in ENVI 5.0 version software.

2.2.3. Validation of Results

Image classification is based on samples of the classes; hence, the quality should be checked and quantified [36]. Classification results and the data on LULC brought from the field were compared. Historical aerial photographs and SPOT 5 images (panchromatic—5 m resolution) acquired on (2006/7) were obtained from the Ethiopian Mapping Agency (EMA) for use as reference data to evaluate the accuracy of 1985 and 2005 Landsat image classifications, respectively. The 1995 classification was validated using Woody Biomass Inventory and Strategic Planning Project (WBISPP) data to study LULCC over the area. The accuracy of the 2015 classification was assessed using ground data collected separately.
Comparison was carried out by creating an error matrix, as discussed by Bakker et al. ([36], p. 161). Testing data (the other half of the sample points) were used to assess the accuracy of the final classification. Accuracy assessment is a measure of similarity of an estimate to the true value [38]. The accuracy (overall, producer’s, and user’s) was calculated for each class per year. The overall accuracies of these classifications were 85.2, 87.2, 76.9, and 87.9% for 1985, 1995, 2005, and 2015, respectively (Table 2). BMER encompasses a very large area, as a result of which diverse soil types, topography, altitudinal variation, and vegetation density exist. In such a situation, classification becomes difficult since a particular land cover, for example grassland, may depict different spectral signatures in the feature space, which is influenced by the agro-ecology in which the particular land cover is found [36,39].

2.2.4. Post-Classification

The purpose of this post-classification was to arrive at the LULCC for the two periods under investigation, i.e., 1985 and 2015. LULCC was estimated following a similar approach to that employed by Kidane et al. [30] for BMNP and Kindu et al. [40] for the Munessa-Shashemene landscape. Xiuwan [41] also recommended post-classification as an appropriate mechanism to analyze LULCC provided sufficient training sample data were available for a detailed ‘from–to’ detection, hence post-classification comparison was implemented [42]. ENVI change detection statistics tool (post-classification) was used to compare change detection between pairs of consecutive classified images. Accordingly, the years 1985 and 1995, 1995 and 2005, 2005 and 2015, and 1985 and 2015 were compared using a change detection matrix.

2.2.5. Removal of Carbon Stock

The removal of carbon stocks as a result of deforestation from forest and shrubland over the study periods was estimated by considering values estimated by OFWE et al. [31] for moist and dry forests in the eco-region and estimates made by Nune et al. [43], respectively. OFWE et al. [32] have reported aboveground biomass carbon stocks of 191.28 and 126.71 t·C·ha−1 for moist and dry forests, respectively. The carbon stock removed from the deforested area within the study period was estimated by using the mean values of carbon stocks estimated for moist and dry forests by OFWE et al. [32]. Nune et al. [43] estimated 36.67 t·C·ha−1 in shrublands of Ethiopia [43]

2.2.6. Management of Supportive Socioeconomic Data

Earlier studies in BMER showed that farmland and population growth were the main drivers of LULCC [30,31,32]. In our study, we considered crop production and human and livestock population growth to see if there was any correlation with LULCC. We used data from published reports of the Central Statistics Agency for the period between 1986 and 2014. Within this period, data for the years 2001, 2002, 2009, 1993, 1995, and 1996 were missing. However, we extrapolated the data using trend analysis in MINITAB 14. These data refer to an area (ha) occupied by cereals, pulses, and oil crops in the Bale Zone. The population data refer to males and females of all age groups and include urban and rural populations.

2.2.7. Data Analyses

Microsoft Excel was used to organize results of LULCC for the study period. Using MINITAB 14 and SPSS 20, trend analysis of LULCC, particularly in forest, farmland, shrubland, and grassland, and of correlations between different LULC changes was conducted. Furthermore, trend analysis of crop land area expansion and human and livestock growth was conducted. Correlations between cropland from the CSA results and farmland from LULCC analysis were identified.
Overall, a change matrix was constructed to understand or observe the magnitude of change between different LULC classes.

3. Results

3.1. LULC Change

3.1.1. Changes Observed in the Different LULC Types

The share of forest cover during the study period (1985–2015) exhibited a downward trend from 20.82 to 17.54% (Table 3, Figure 3). On the contrary, farmlands expanded from 15.43 in 1985 to 23.19% in 2015.
In general, out of the eight LULC types identified in the study area, only two, namely farmland and urban settlements, showed growth over the 31-year study period while the rest declined in their cover (Figure 3). Between 1995 and 2005, large areas of forests and shrubland were converted to other LULC types while grasslands lost substantial area between 2005 and 2015 (Table 4).
The downward trends observed (Figure 3) in the forest, grassland, and shrubland LULC types during the study period are higher than for the other three LULC types that showed moderate loss, namely, Afroalpine, Erica-dominated, and woodland LULC types. The results from the Linear Trend Analyses for 1985–2015 indicated that, on average, the annual changes of forest, farmland, shrubland, and grassland LULC types were −4661, 10575, −3703, and −2444 ha, respectively.
The highest correlation (negative) was found between farmland and forest LULC types, and the Pearson Correlation value was −0.997 (P = 0.0001). The correlation coefficient with the bootstrapped confidence interval at 95% was between −0.999 and −0.996. Similarly, the correlation between farmland and shrubland LULC types was −0.982 (P = 0.0001), and the correlation coefficient with the bootstrapped confidence interval at 95% was between −0.991 and −0.974. The correlation between farmland and grassland was −0.955 (P = 0.0001), and the correlation coefficient with the bootstrapped confidence interval at 95% was between −0.976 and −0.931. In all cases, Pearson correlation (two-tailed) was significant at the 0.01 level.
Forest cover loss until 1995 was less than 1000 ha per year, while after 1995, it increased to an annual loss of more than 5700 ha. The average annual loss of forest between 1985 and 2015 was more than 4500 ha (Figure 4). Farmland gained 50,271 ha between 1985 and 1995 (Table 4). Between 2005 and 2015, the gain of farmland was estimated at 103,320 ha. However, the average area added to farmland annually was estimated at about 10,575 ha.
Shrubland also showed a similar trend to forests around 1995. Approximate annual losses of shrubland from 1985 to 1995, 1995 to 2005, and 2005 to 2015 were 2204, 6081, and 1023 ha, respectively (Table 4). Patterns of loss of cover of grassland changed after 2006. Until 2005, the estimated annual loss of the area covered by grassland was 1536 ha, which increased to 5244 ha between 2005 and 2015.
Most of the area lost from forests, grassland, and shrubland was converted to farmland. Between 1985 and 1995, an estimated 50,271 ha of new farmland was gained from forest (37.6%), shrubland (35.9%), and grassland (16%). In the following 10 years (up to 2005), farmland gained an estimated area of 138,703 ha from forests (48%) and shrubland (43%). However, between 2005 and 2015, the area conversion from shrubland to farmland declined to 9%. During the same period, forests and grassland were converted and contributed to farmland at more or less the same magnitude, i.e., 43.2% and 42.3%, respectively.
Within the study period (1985–2015), the total area of forests, shrubland, and grassland converted to farmland was estimated at about 123,751, 93,078, and 83,158 ha, respectively. During the same period, farmland gained about 292,294 ha (Figure 5).

3.1.2. Change Detection Matrix

The change detection matrices for the periods 1985–1995, 1995–2005, and 2005–2015 were treated separately. The change detection matrix highlights that farmland gained land from all other LULCC except urban settlement (Table 5). As indicated above, the largest area cover gain of farmland was obtained from forests. The matrix also shows that urban settlement gained land from farmland, grassland, and shrubland.
Comparatively, areas covered by Afroalpine, Erica, and woodland LULC types were less affected (Figure 3 and Figure 4). This can be attributed to the fact that Afroalpine and Erica-dominated LULC types are less favorable for crop production due to the high altitudes in which they are found. Moreover, the Erica-dominated and Afroalpine vegetation zones are under the management and protection of the Bale Mountains National Park (BMNP) administration. The land occupied by woodlands is mostly used by pastoralist communities in the lowland part of the BMER, where agricultural investments and settlements (formal or informal) are not common owing to the dry agroecology, among other factors.
The highest loss was recorded in forests, shrubland, and grassland (Table 5) since they are favorable for farming in the BMER, depending on the availability of water for irrigation.

3.1.3. Major Drivers of LULCC/Deforestation

The socioeconomic data from Central Statistics Agency (CSA) regarding the area (ha) occupied by crops (cereals, pulses, and oil seeds) in the Bale Zone alone showed an increase from 61,290 ha in 1986 to 376,639 ha in 2014 (Figure 6). Therefore, the area of farmland estimated using remote sensing and GIS, and the annual crop production area reported by CSA, have a positive correlation of 0.824, (p = 0.0001). The correlation coefficient with a bootstrapped confidence interval at 95% was between 0.682 and 0.954. Correlations between farmland with area occupied by cereals, pulses, and oilseeds were 0.825 (p = 0.0001); 0.719 (p = 0.0001); and 0.633 (p = 0.0001), respectively. The strongest correlation existed between area of farmland and area occupied by cereal production.
The forest was the LULC type most affected by the expansion of farmland. The other LULC type that gained in area during the study period was urban settlement. Urban settlements have grown at the expense of, mostly, farmland, grassland, and shrubland (least). In total, 45.3 and 51.8% of the urban expansion within the study period took place through the conversion of farmland and grassland, respectively. Between 2005 and 2015, grassland lost a relatively high area to urban settlement compared with farmland and shrubland. Therefore, major drivers of LULCC are farmland, as a result of cropland expansion, and urban expansion.

3.2. Human and Livestock Population Growth

Human population growth in the Bale Zone alone projected by CSA revealed that, from 1985 onwards, there was an estimated annual growth of 76,953 people (Figure 7). Further correlation analysis between the area occupied by crop production and population growth resulted in a Pearson correlation value of 0.771 (P = 0.0001). The correlation coefficient with a bootstrapped confidence interval at 95% was between 0.620 and 0.924.
In the Bale Zone alone, there are 3,124,305 domestic animals, of which about 51%, 25%, and 12% are cattle, goats, and sheep, respectively (Figure 7). Despite the fact that the amount of livestock in the study area is, more or less, increasing, interestingly, conversion of grassland to farmland is also increasing.

3.3. Carbon Stock Removed as a Result of Deforestation

The difference in forest cover between 1985 and 2015 was estimated at about 123,751 ha. The estimated carbon stock removed from the area as a result of deforestation was, therefore, about 24.6 million tons, with an average annual removal of about 794,123 tons. The total area of shrubland cleared during the study period was about 92,577 ha, corresponding to an average annual removal of about 3.1 million tons of carbon stock.

4. Discussion

In this study, three research questions were addressed, i.e., (i) Which LULC type either gained or lost most as a result of the observed LULC changes? (ii) What were the major drivers of the LULC change/deforestation? and (iii) What was the approximate amount of carbon stock removed as a result of deforestation during the study period?

4.1. Gain or Loss of LULC Types in Area Coverage Due to LULCC

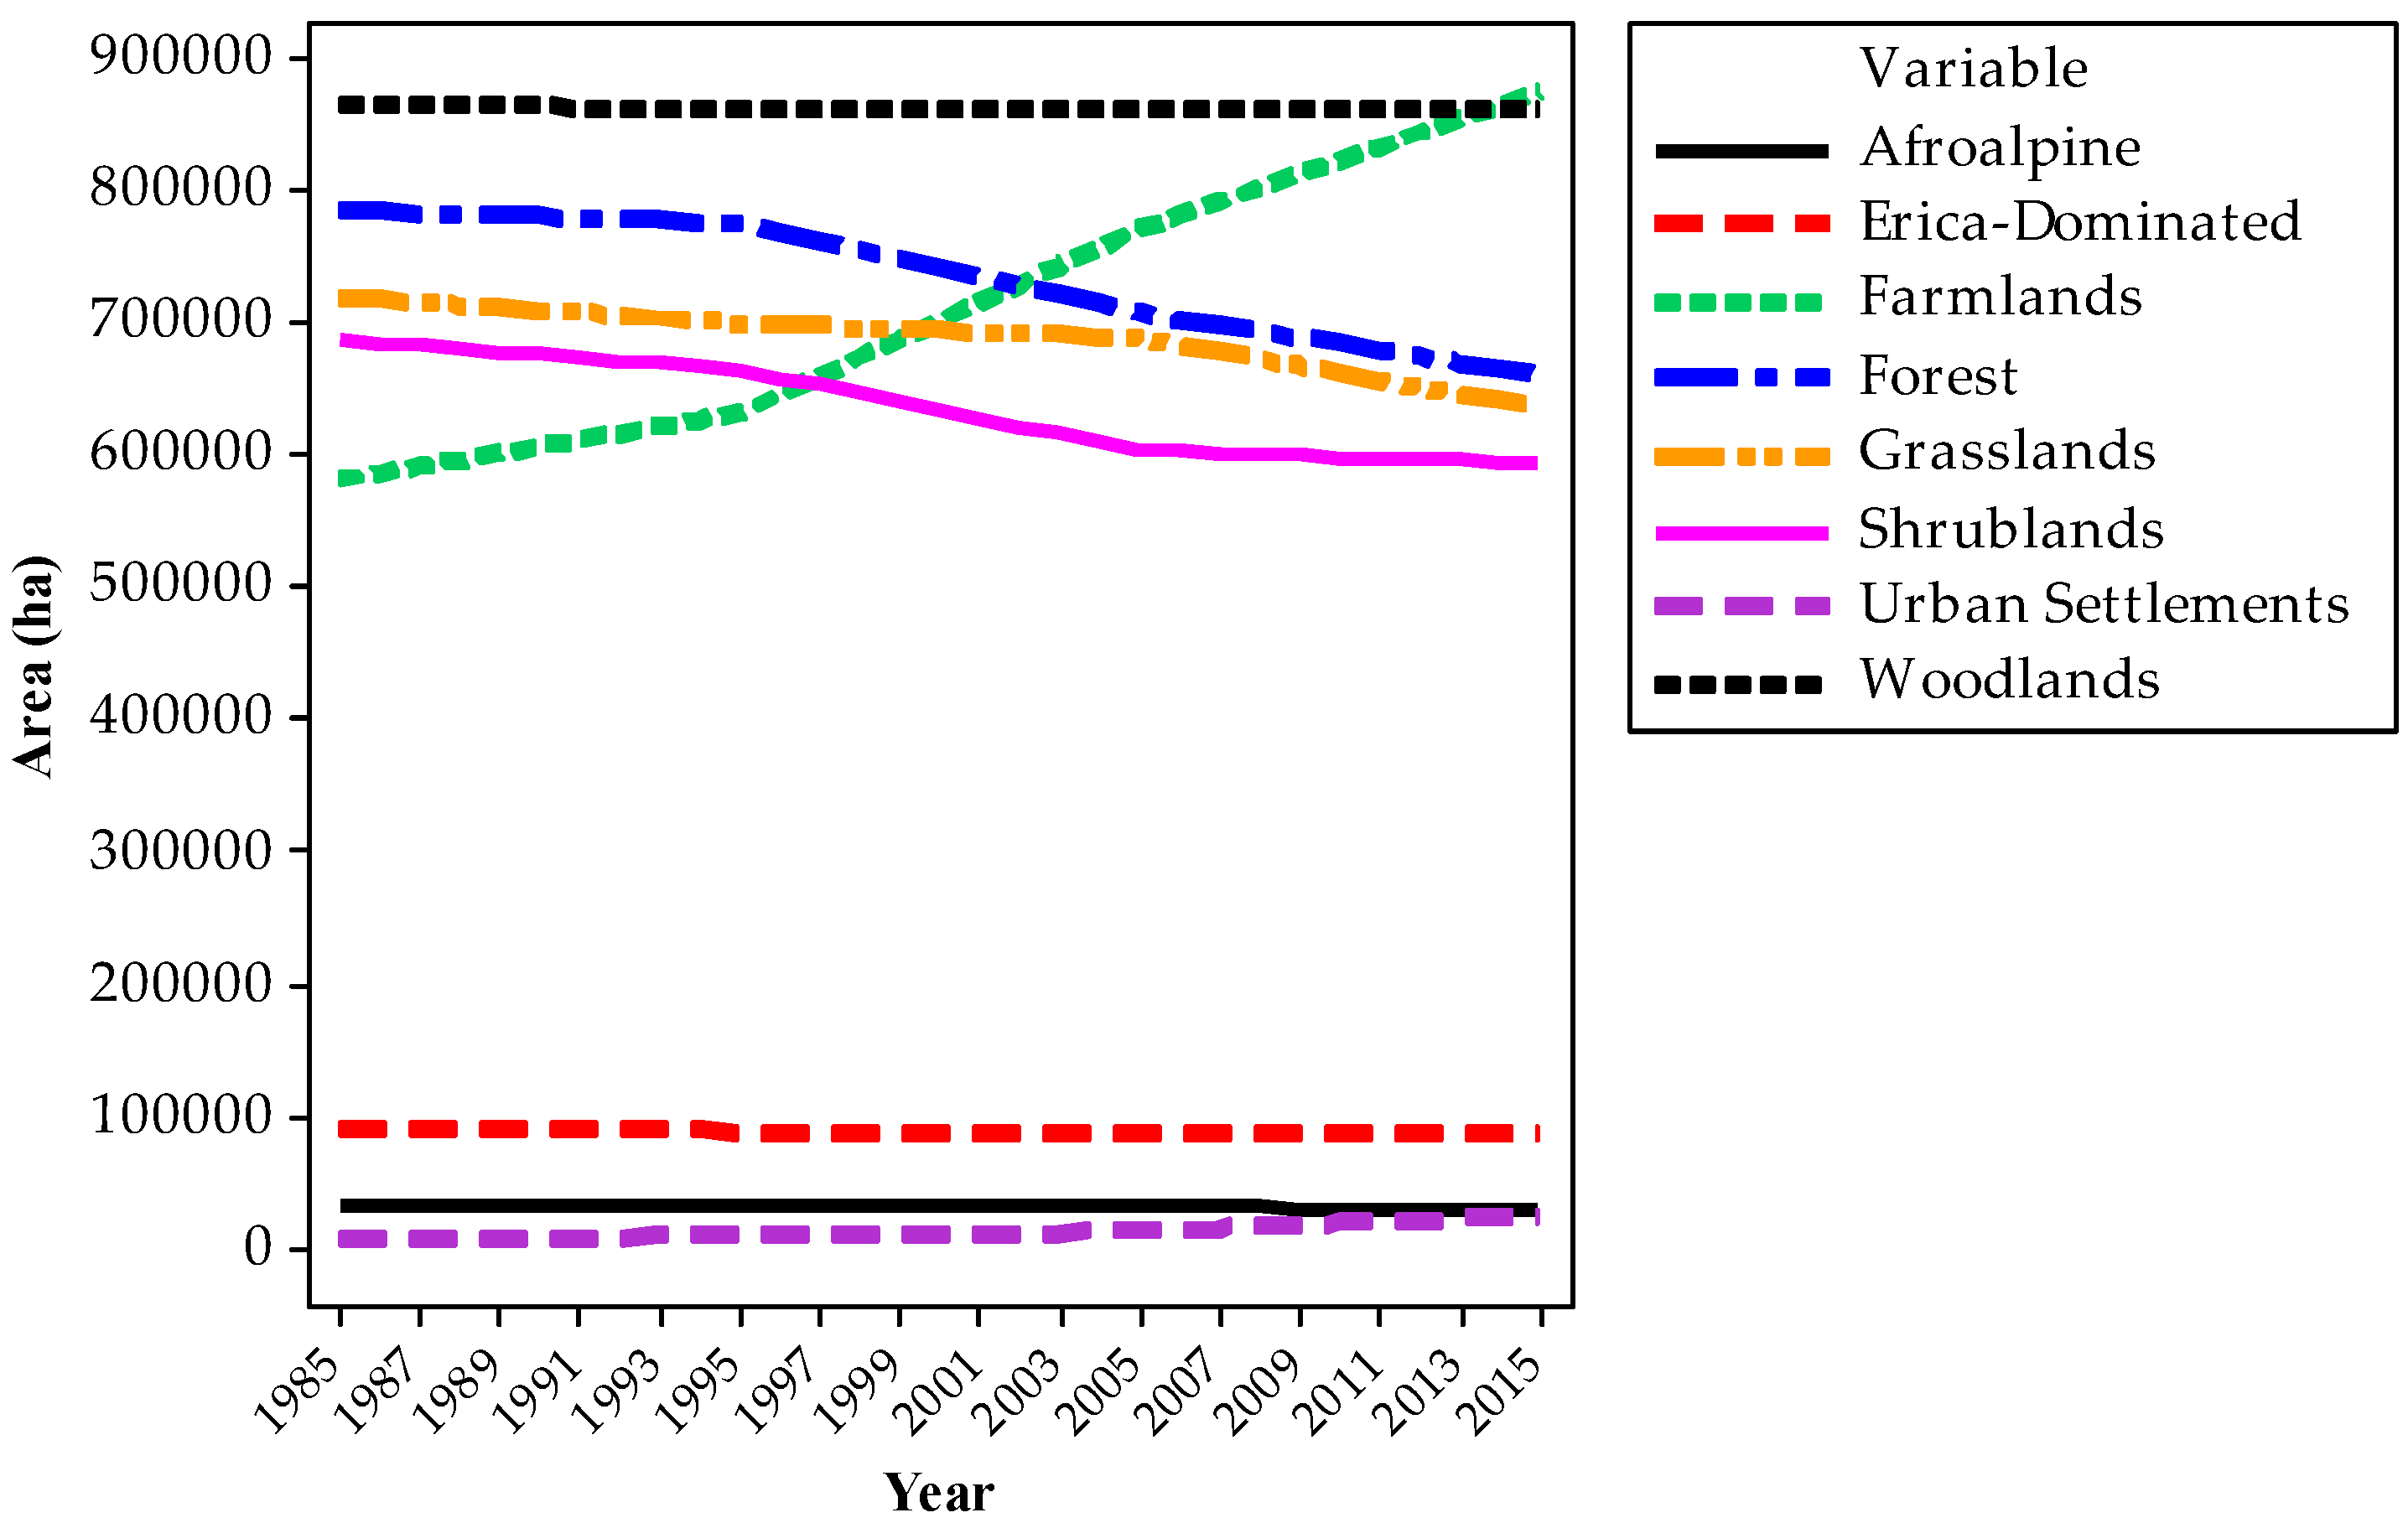
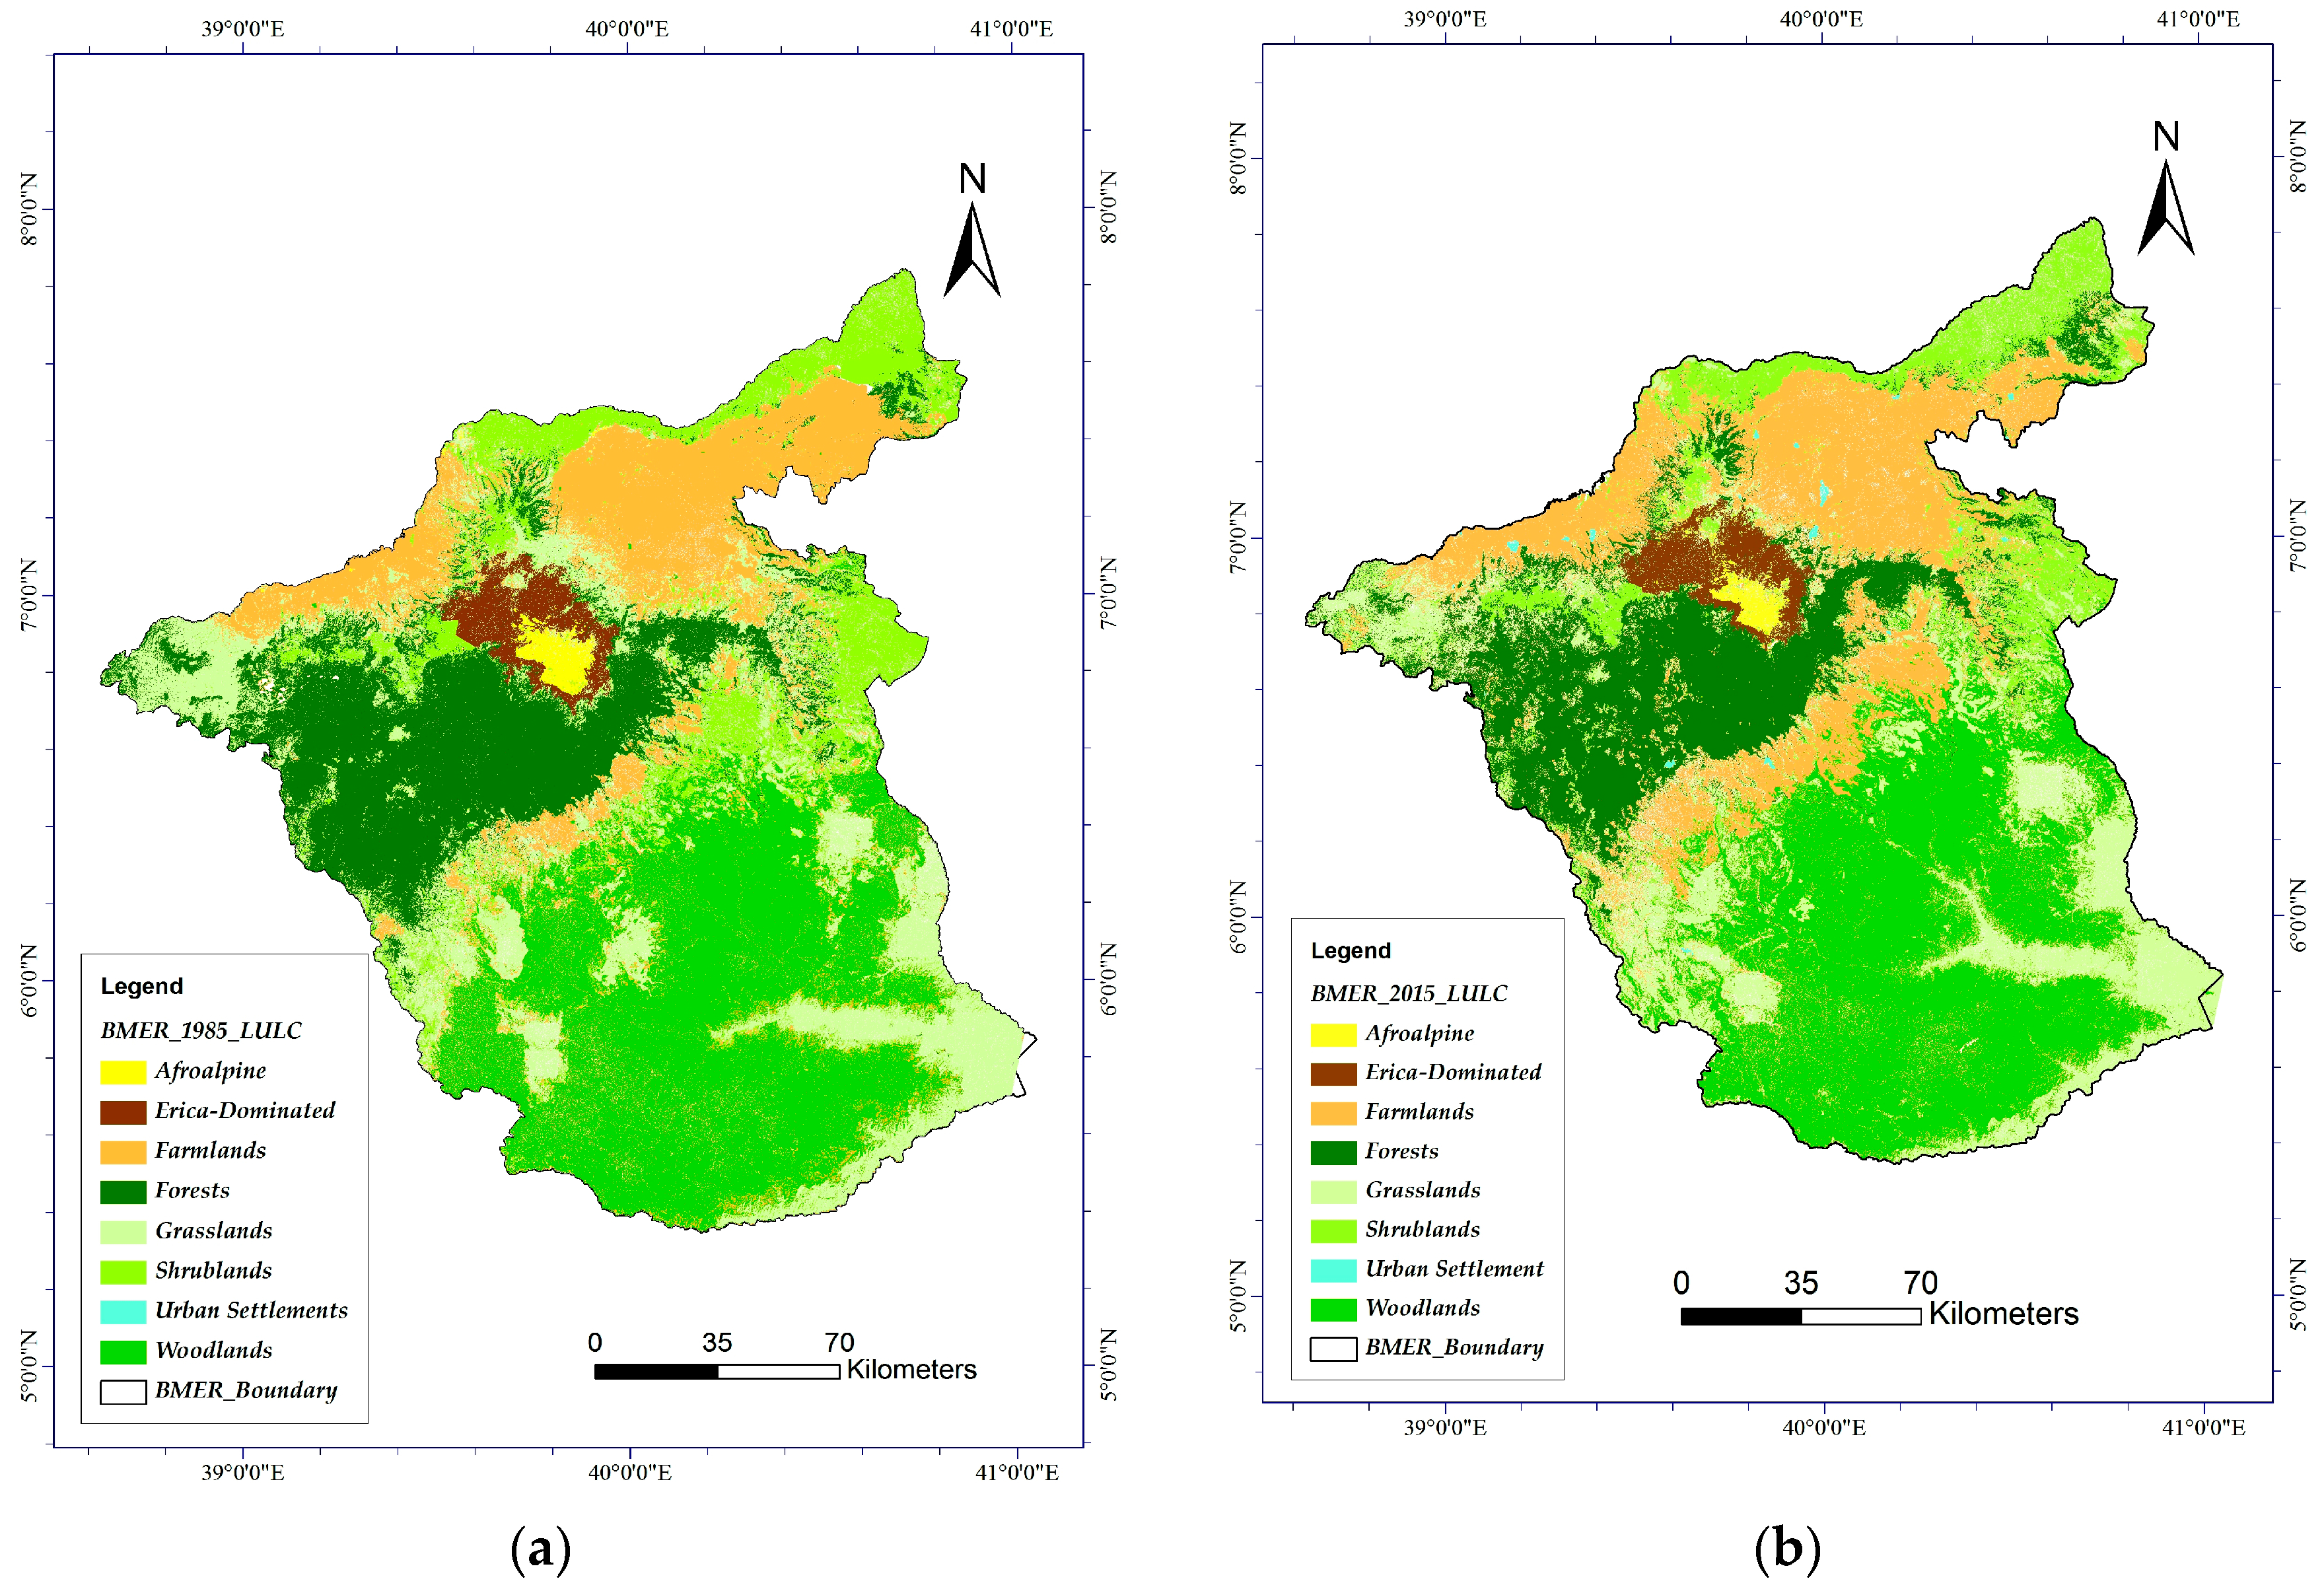
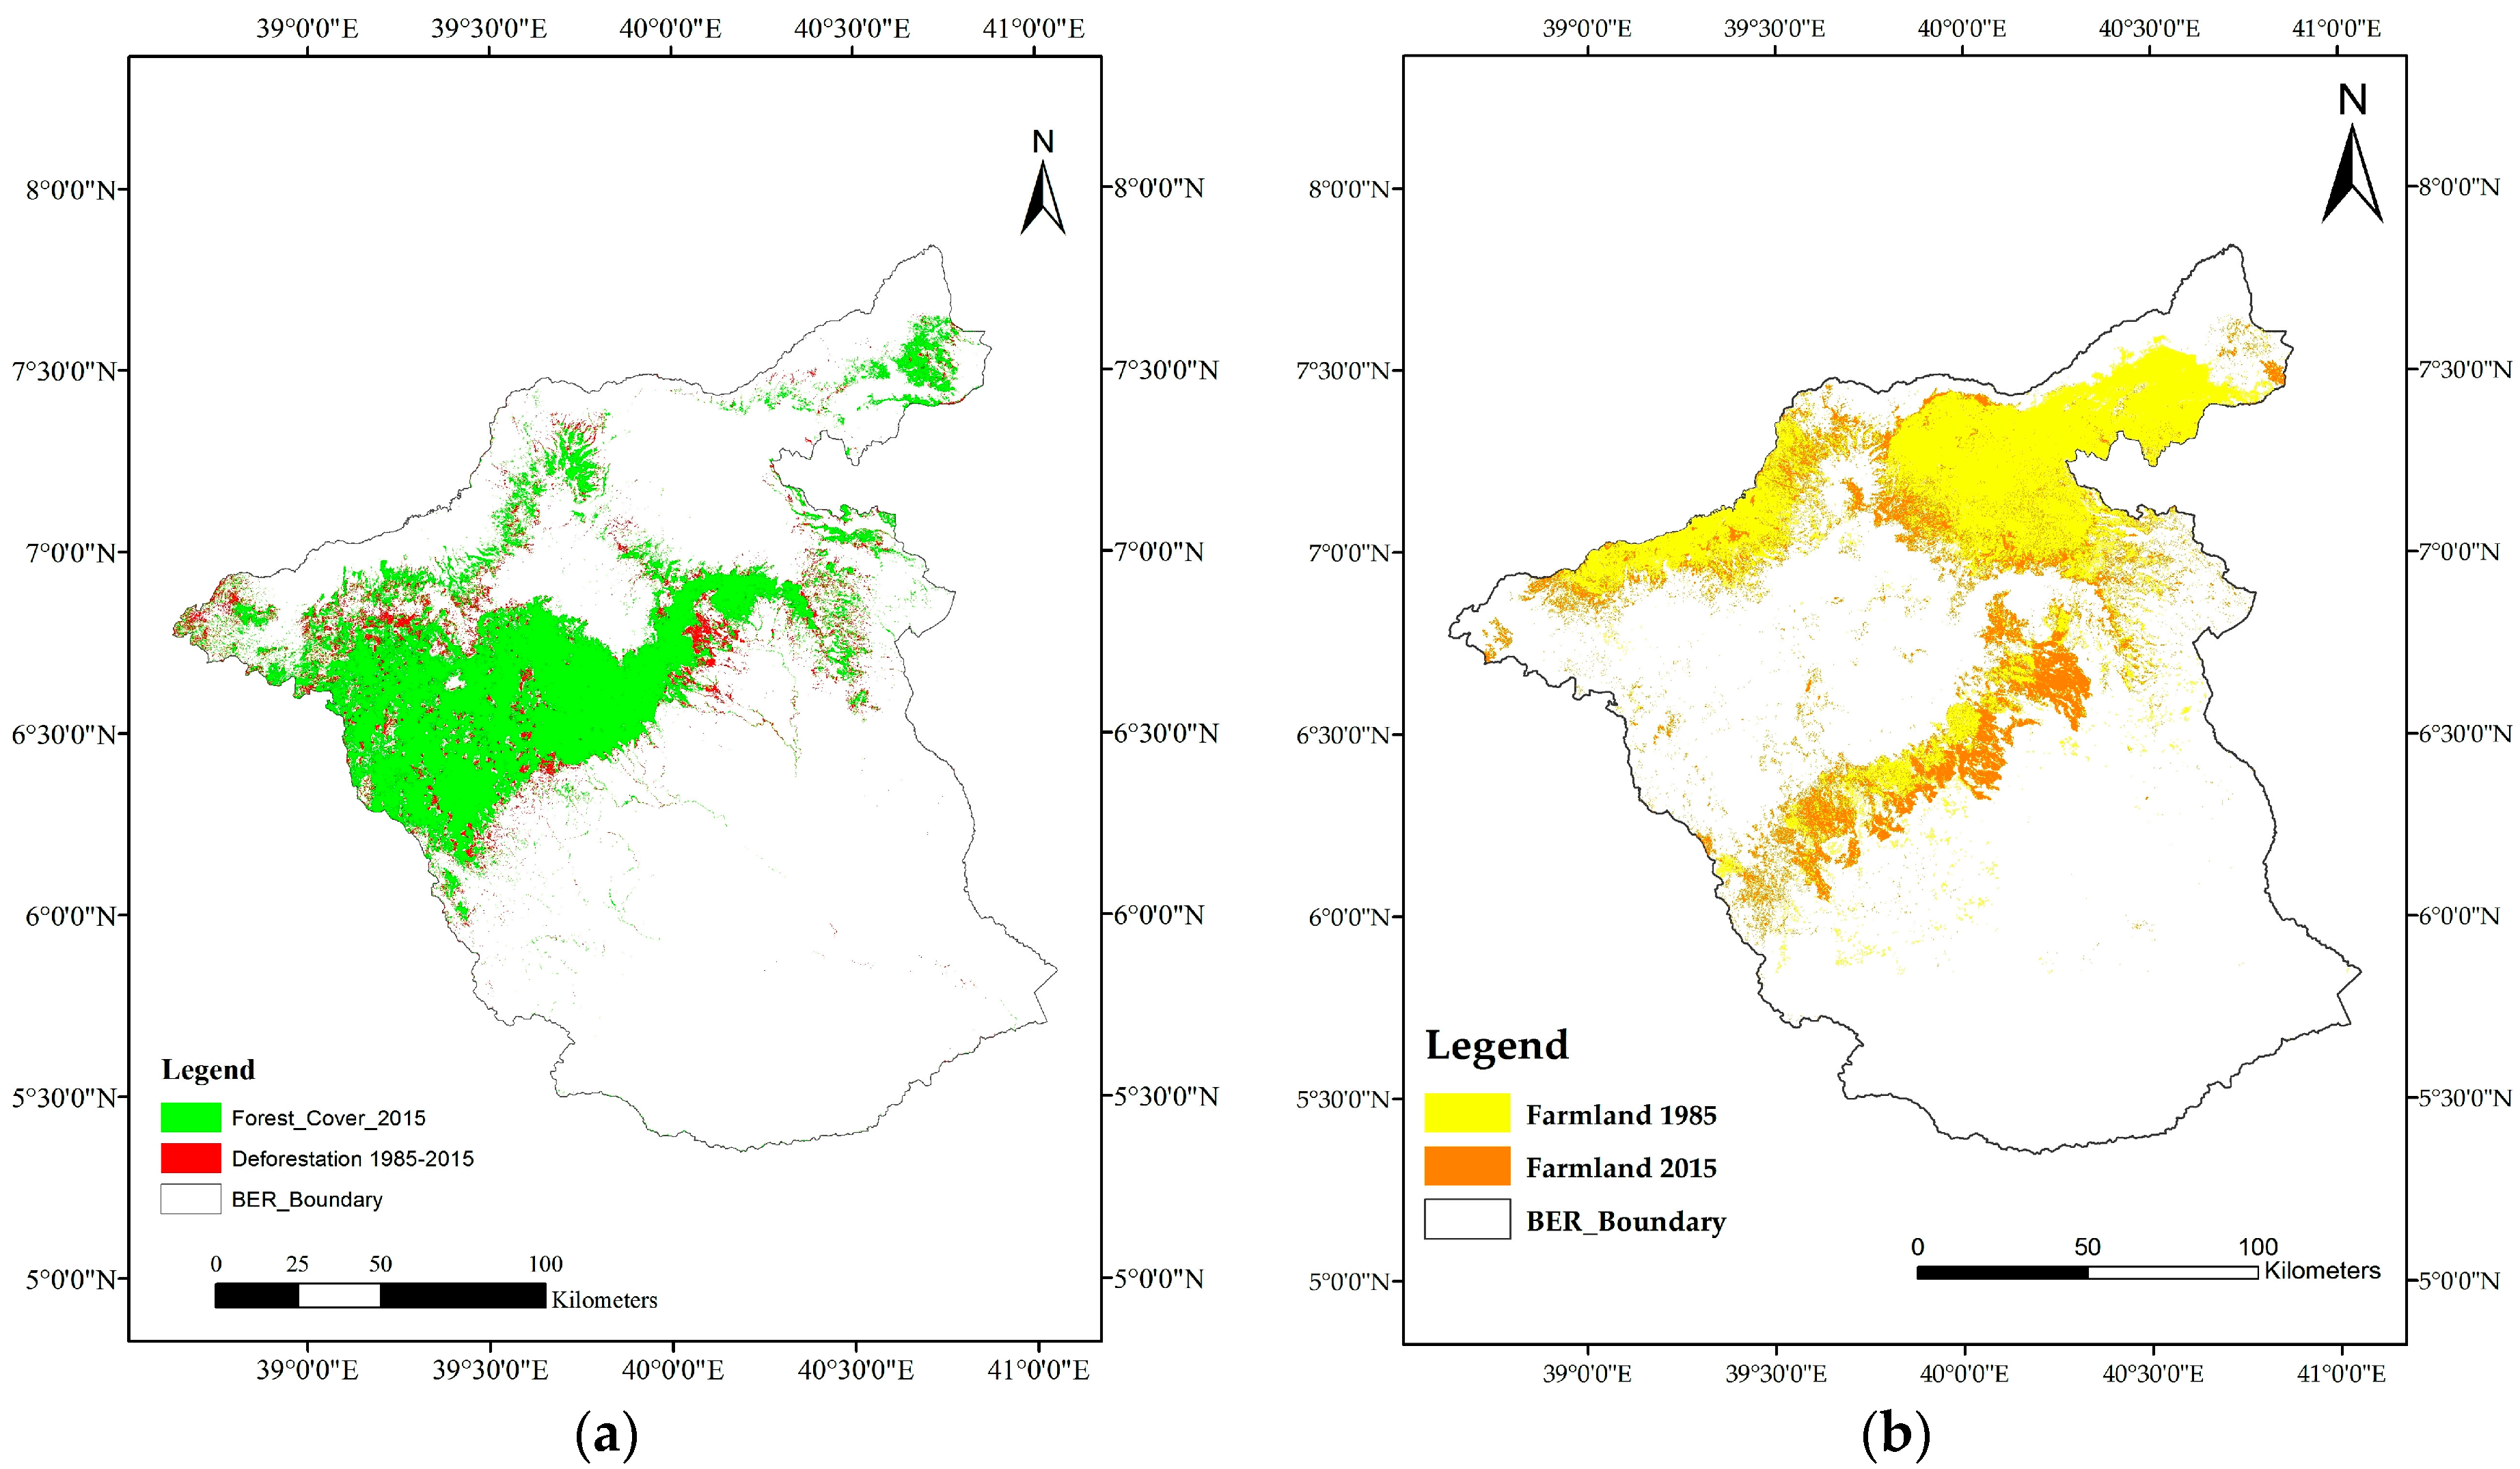
The results revealed that farmland gained the most in area compared to other LULC types during the study period (1985–2015). On the contrary, forests lost substantial area (most) during the study period with an annual average deforestation rate of 4661 ha. The forest area decreased from 20.8 to 17.5% while farmland increased from 15.4 to 23.2% during the same period. The other two affected LULC types were shrubland and grassland. The shrubland decreased from 18.2% to 15.8%. Likewise, grassland lost 2.2% within the study period. Urban settlement gained 0.68%. In general, our study is in agreement with previous studies carried out in the area. All of the studies conducted in BMER revealed the expansion of farmland, while forest area exhibited a decreasing trend.
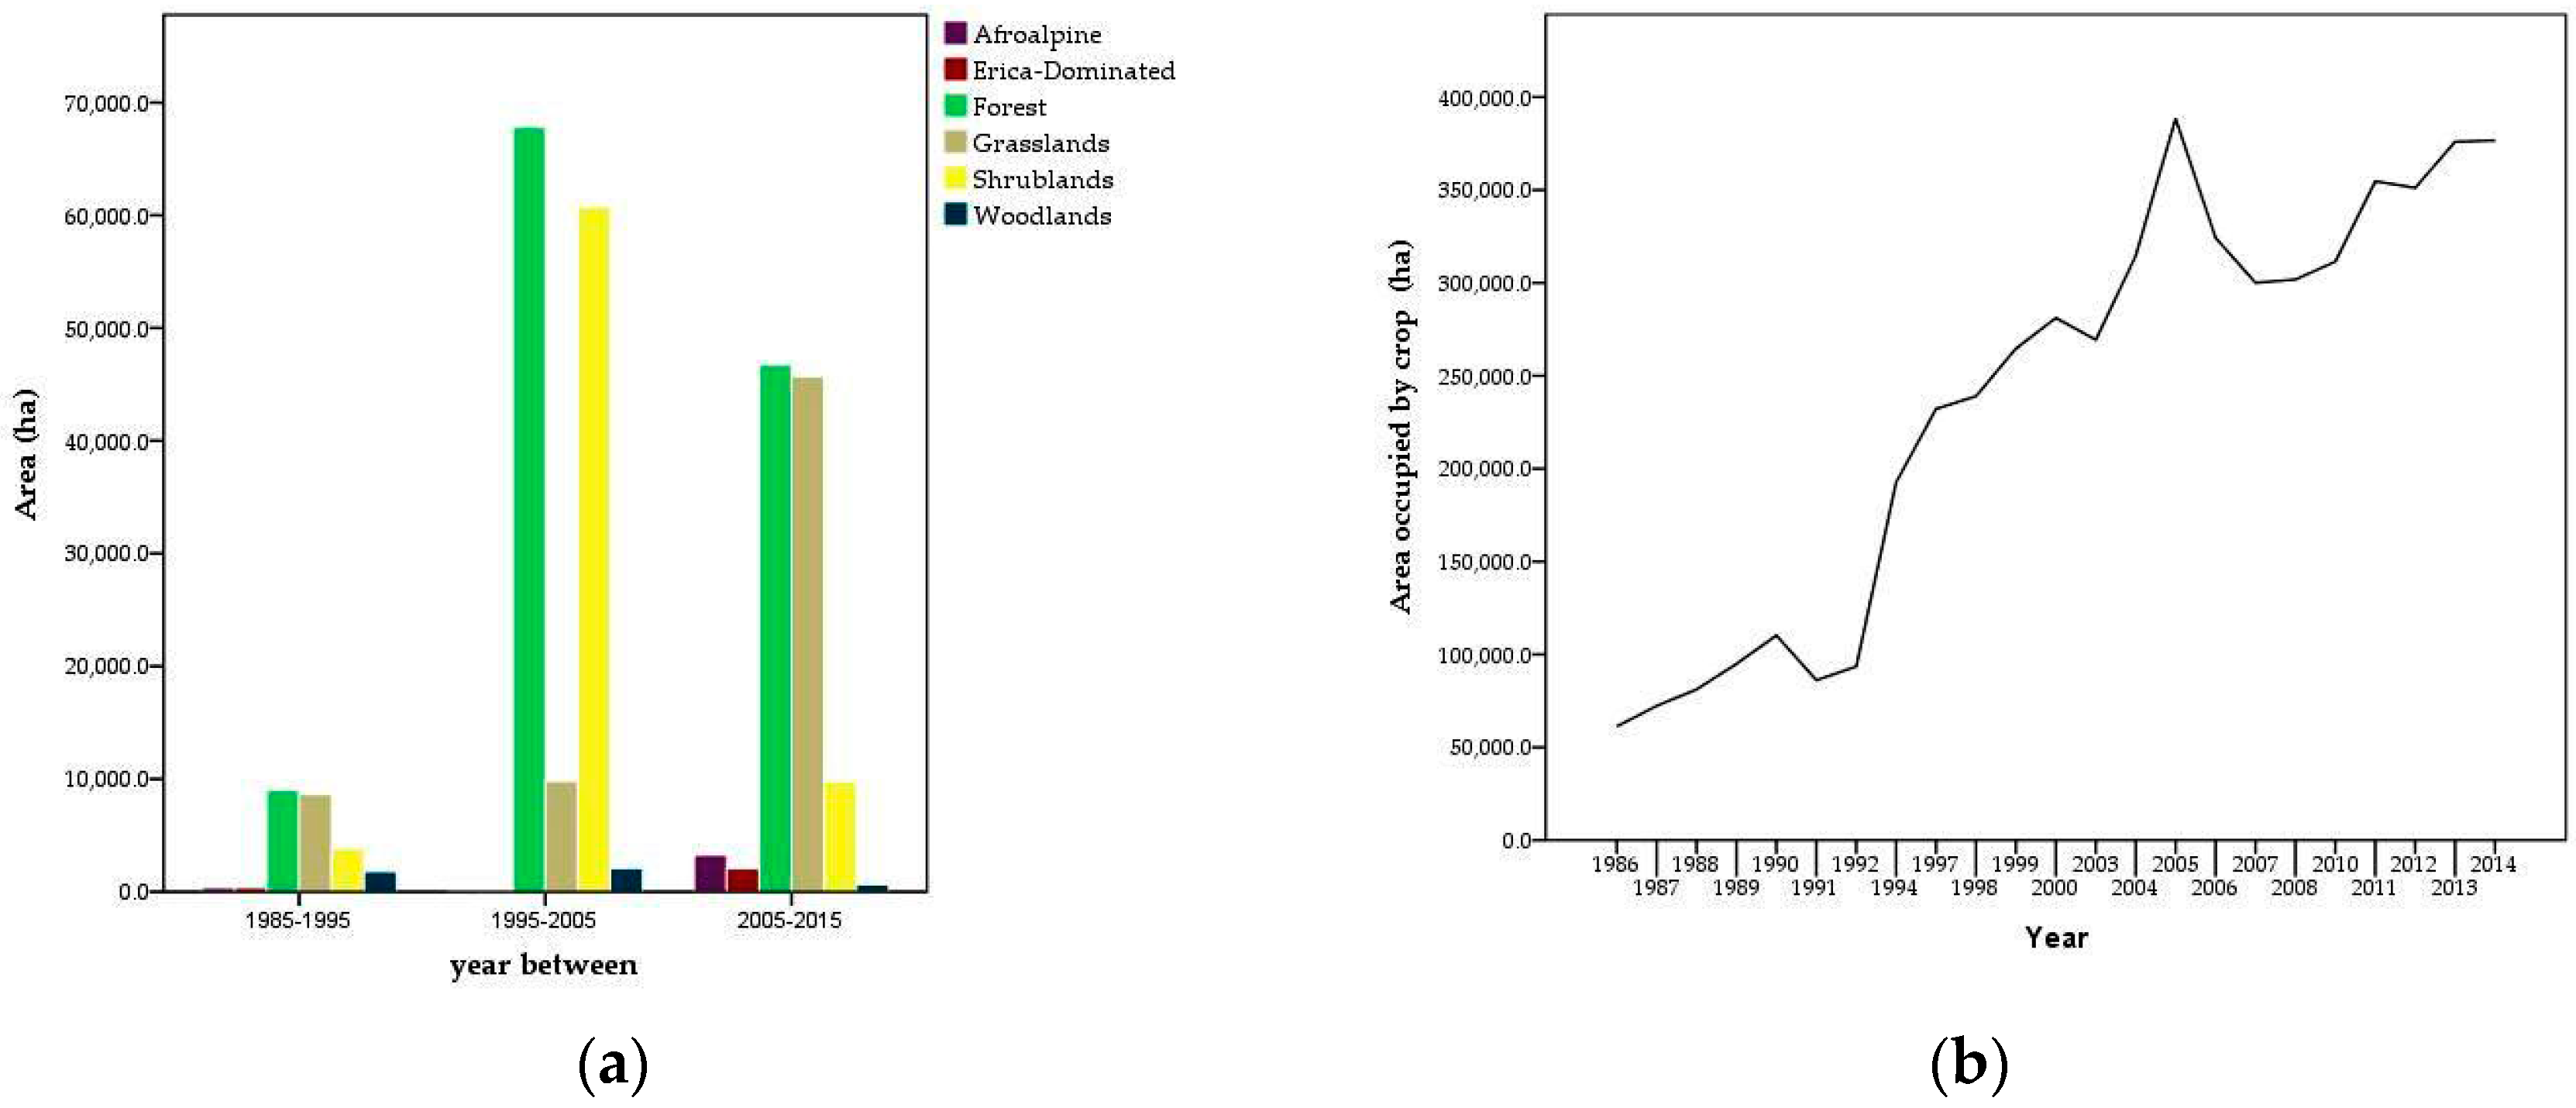
Between 1985 and 1995, an estimated area of 50,271 ha was converted to farmland from the other LULC types. Of this, 37.6%, 35.9%, and 16% represented areas lost from the forest, grassland, and shrubland LULC types, respectively. In the following 10 years (up to 2005), about 48% and 43% of the farmland was gained from forests and shrubland, respectively. Of the total farmland gained between 2005 and 2015, shrubland, forests, and grassland contributed 9%, 43.2%, and 42.3%, respectively.
Gibbs et al. [44] confirmed that substantial amounts of new cropland in East Africa and South America were derived from shrubland. Farmland expansion in the BMER has intensified at the expense of three main LULC types and, to some extent, through conversion of the Erica-dominated and woodland LULC types. Demand for food for the growing population seems the probable driving force, among others, of farmland expansion from 1985 to 2015. This is justified by the correlation results indicated above. As discussed above, in the eco-region, an area of about 10,575 ha was annually added to farmland, mainly from the removal of forests. This finding is in line with the findings of Foley et al. [45], who reported that agriculture is expanding in the tropics, and 80% of the area needed for this expansion comes from forests.
The extent of deforestation may vary from one year to another depending on various factors. Sometimes government policies tend to favor food security projects or programs that may intensify the rate of deforestation. For example, Wakjira et al. [46] showed that local administrators in Harena Buluk District of BMER encouraged inward migration and settlements in the forests and other natural vegetation areas to increase the population of the district. Elections in Ethiopia were conducted during the years 1995, 2000, 2005, 2010, and 2015. The study made by Pailler [47] demonstrated the presence of a relationship between elections and deforestation via different forms of payoffs, i.e., (i) allocating ‘underdeveloped’ land such as forest to landless individuals to settle and farm; (ii) allowing (legal or illegal) deforestation activities of large-scale agriculture firms; and (iii) increasing agricultural credit for farmers so that they can expand their agriculture land into forest areas. Drought forces many local people to migrate from drought-stricken areas to forest regions where better water, foraging opportunities, and irrigation for agriculture are found. Even though it was not well documented, many people from such areas have migrated and settled in the BMER since the mid-1990s [46]. This has resulted in deforestation to create land for crop production.
The growth of farmland at the expense of other LULC types in the study area, especially forests, shrubland, and woodland, may be a manifestation of the weak or inappropriate institutional arrangements in the study area [48]. The weak integration or coordination between and among various sectors that have interest in the landscape, lack of common planning tools capable of monitoring and evaluating the losses and gains of area coverage by the different LULC types and informing stakeholders accordingly, and giving priority to agriculture are among the major factors that have contributed to the observed undesirable losses in the area coverage of the different LULC types, especially forests.

4.2. Major Drivers of LULCC/Deforestation

LULCCs have been widely investigated in different parts of the world, e.g., in the USA and Europe [49], South America [44,50], Australia [51], Asia, and Africa [44], including Ethiopia [22,23,26,30,40]. These studies have shown that the expansion of agricultural land, both for commercial and subsistence crop production, is the main driver of LULCC [52]. The rate of cropland expansion worldwide is increasing [44,49] at the expense of forests, grassland, shrubland, and other lands. For example, 27% of the tropical forest biome and 70% of the grassland worldwide have been converted to agricultural land [45]. In East Africa, shrubland accounted for 8% of agricultural land [38]. The results from this study revealed that the major driver for LULCC is expansion of cropland. This finding is in agreement with results from previous studies [19,30,31,40,50,53].
Geist and Lambin [54] confirmed that expansion of cropland and pasture (grazing in this study) accounted for 96% of the cases causing deforestation. They have emphasized that agricultural expansion is the most important proximate source of tropical deforestation. Underlying factors, e.g., poverty, and proximate factors, such as wood extraction and infrastructure development, discussed by Geist and Lambin [54], were not assessed in the present study. However, OFWE et al. [32] reported that weak law enforcement and population growth are underlying drivers of deforestation. Agricultural expansion was identified as a key driver of deforestation by OFWE et al. [32].
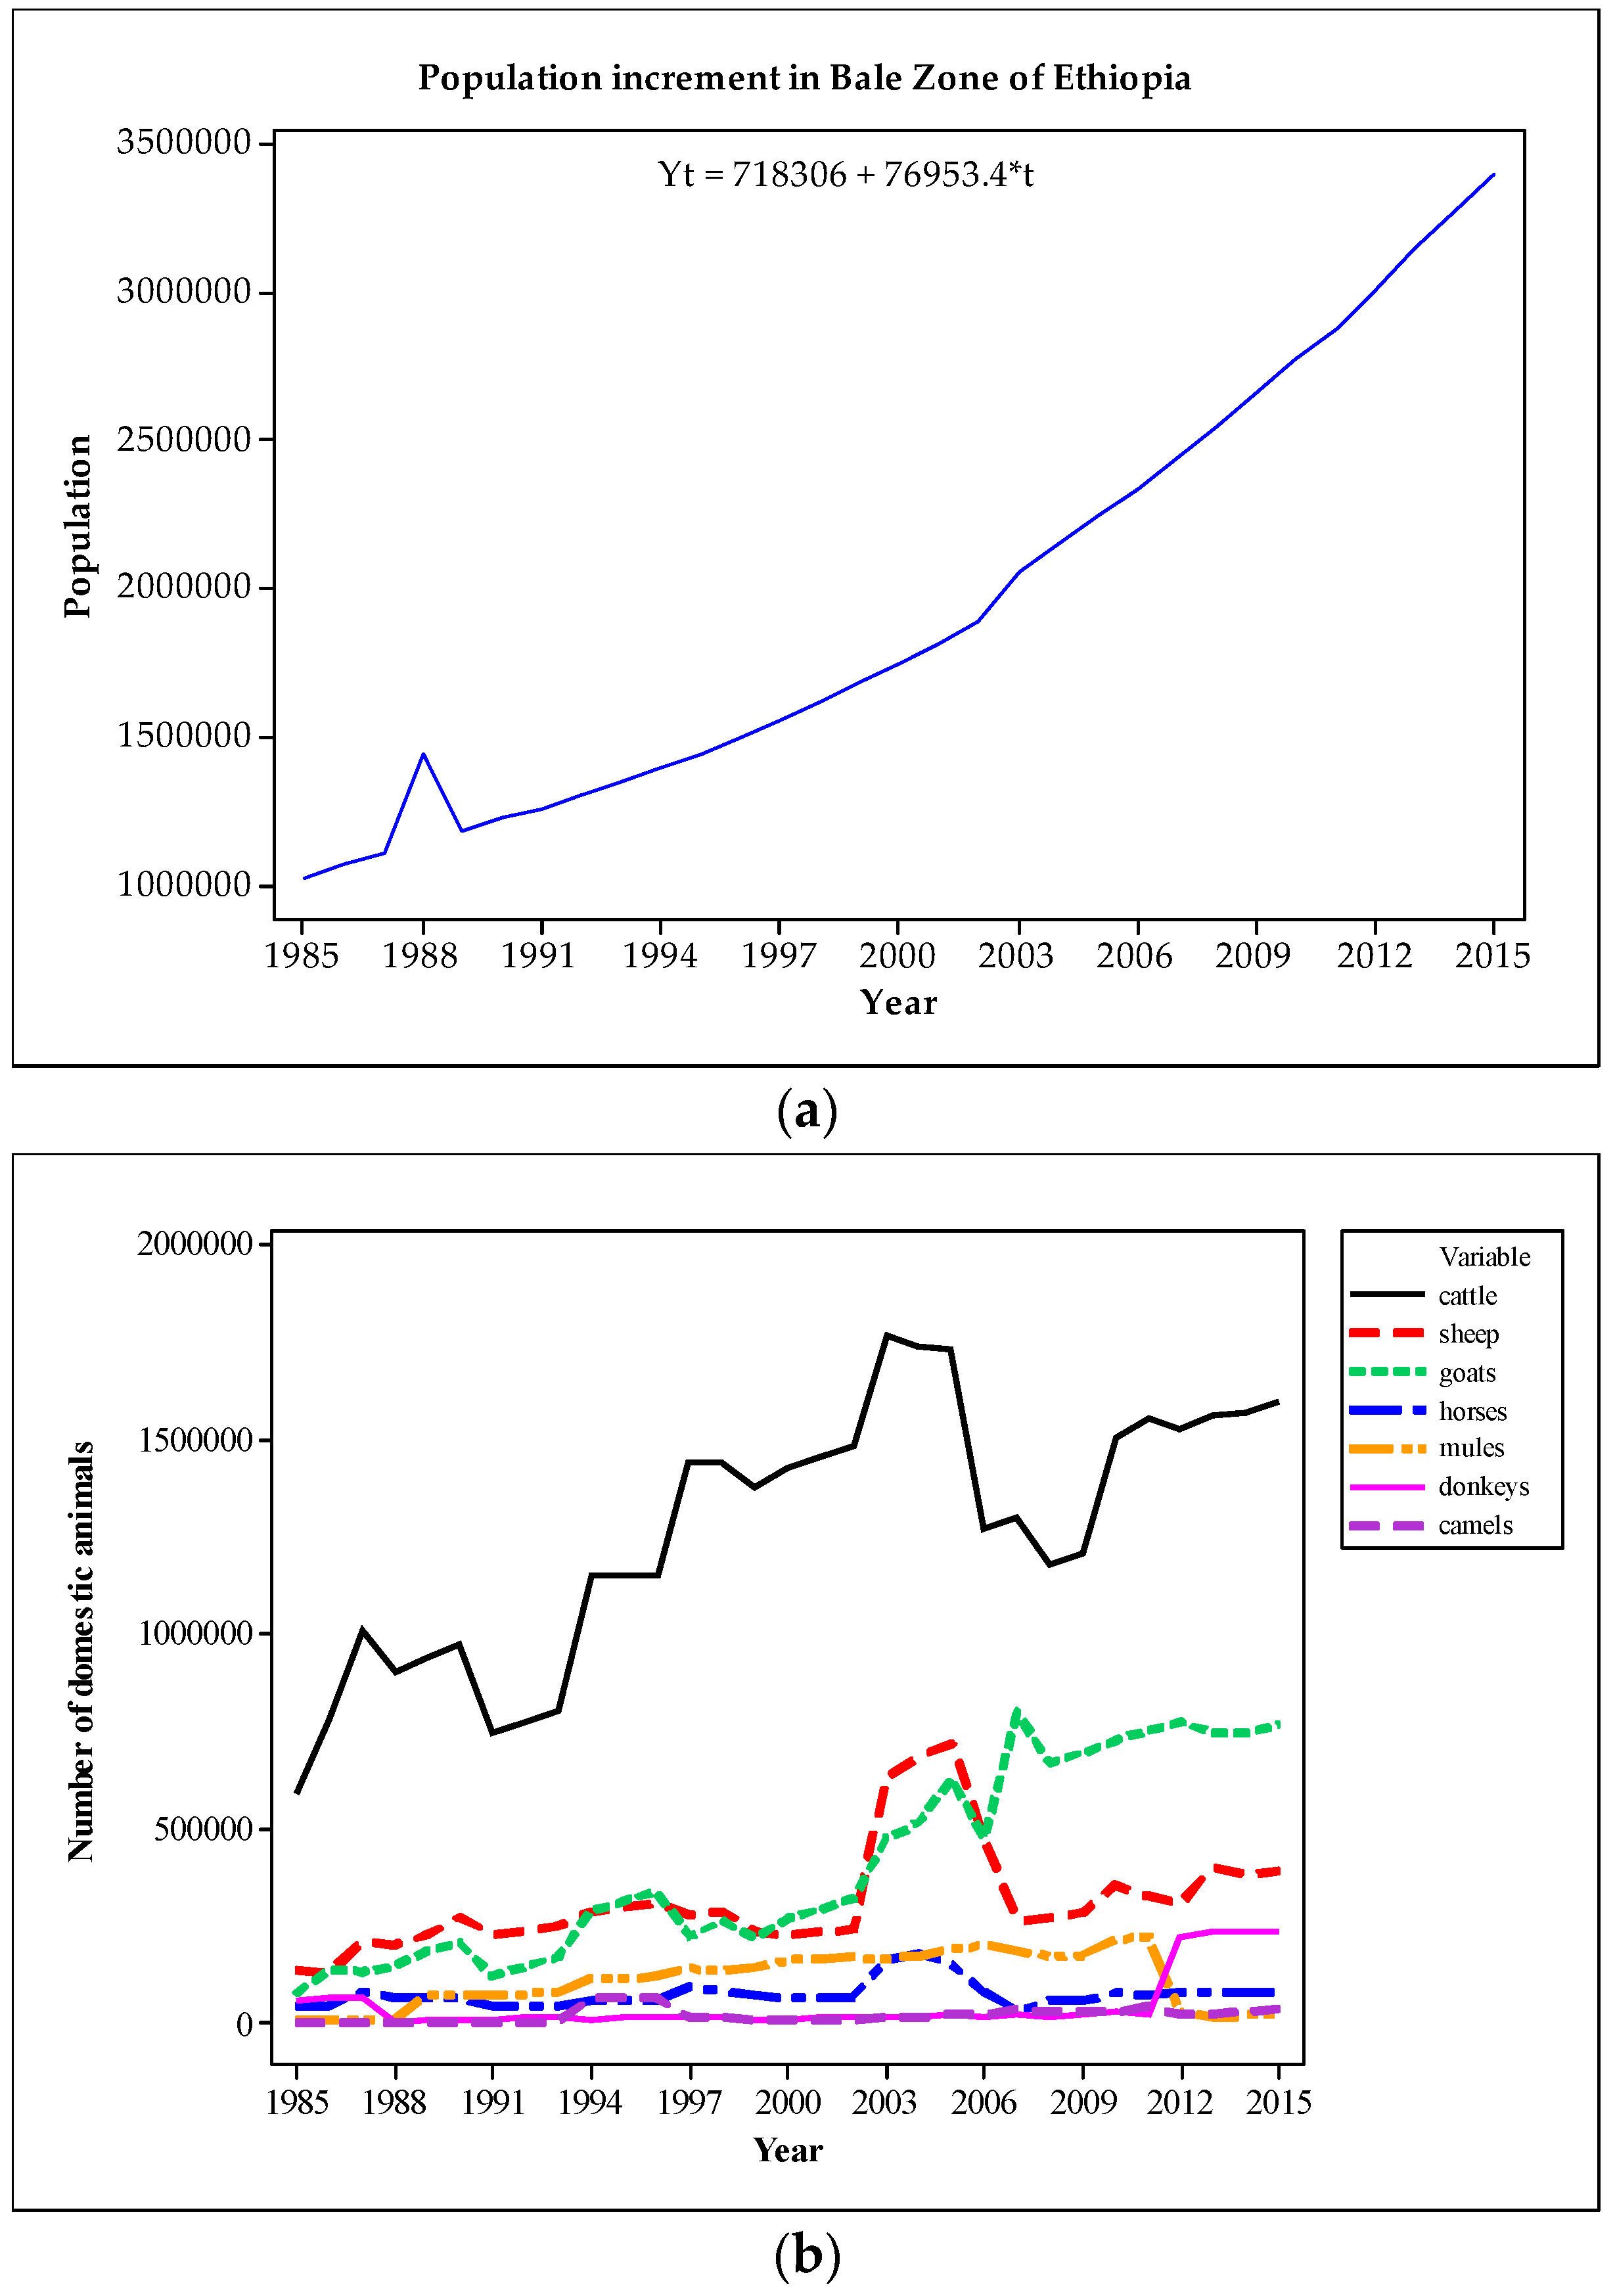
Population growth has contributed to LULCC. For example, the results of a survey carried out by Geist and Lambin [54] showed that 61% of deforestation was related to human population dynamics. This study also showed that farmland expansion is linked to population growth. A strong correlation was found between population growth and cropland expansion. Therefore, it can be concluded that population growth has driven the expansion of cropland in the area at the expense of grassland, forests, and shrubland. The human population inside the BMNP increased from 2500 in 1998 [50] to >40,000 in 2003 [28]. The knock-on effect of population growth on the Ethiopian wolf (Canis simensis) in the Afromontane parts of the study area has been extensively documented by Randall et al. [55]. One of the documented challenges, among others, has been genetic erosion of the Ethiopian wolf as a result of uncontrolled breeding with domestic dogs [55].
Another driving force for expansion of farmland is, probably, government policy [54]. Hillman [56] has reported how the grazing areas used by pastoralists were converted to farmlands to grow crops. As a result, even in the 1980s, a shortage of grazing land for domestic livestock was witnessed, especially during cropping seasons [56]. Hillman [56] revealed that the northwestern, northern, and eastern parts of the BMNP or BMER were extensively used by pastoralists. Later on, extensive parts of these areas were allocated for large-scale production of wheat and other crops because of government policy. The pastoralists were forced to settle down through the “villag-ization” program [56]. According to Teshome et al. [53], the BMNP lost 12,000 ha of montane forest within 32 years and pastureland expanded at the rate of 2800 ha annually. These reports should not be surprising since the grassland has already been converted to farmland. Farmers had no choice but to use the Erica-dominated and Afroalpine LULC types for grazing their animals. The use of these LULC types for grazing may, subsequently, affect existing water systems and soil formation processes, endangering the sustainable flow of the major rivers (at least four) that spring from the plateau [56] and serve several Eastern African countries. It can, therefore, be concluded that government policy has played a significant role in LULC dynamics in and around the BMNP.
Despite the fact that PFM and a Protected Area Management System exist in the BMER, encroachment and expansion of farmland to forests and grassland is still a major concern. Observing cattle and other domestic animals in the Erica-dominated and Afroalpine vegetation zones is common. Geist and Lambin [54] reported that in-migration of farmers into forest zones to expand cropland and pasture was found to be a driver of deforestation in 47% of all the cases studied.
FAO [6] and other studies (e.g., [44]) are predicting the need for more food by 2050 because of growth in human populations around the world. The population in Ethiopia is ever-increasing and represents the second largest population in Africa. The annual population growth in the major part of the study area, the Bale Zone, is estimated at 77,000 (see the results section and Figure 7). Therefore, to feed the growing population, obviously, increasing the area of cropland or farmland overrides other interests. However, when this is done in the absence of proper land use planning, and also when institutions are too weak to enforce the available laws/bylaws developed by user groups, such as Participatory Forest Management (PFM) User Groups [48], the expansion of farmland becomes unsustainable. It cannot provide the solutions recommended by the FAO and other studies. The world needs a sustainable increase in food production (also consumption). Unsustainable expansion of farmland affects biodiversity (fauna, flora, and micro-organisms) and other ecosystem services, such as the water budget of an area; exposes landscapes to pests and diseases; leads to degradation of land [57,45]; and leaves forest-dependent people more vulnerable to poverty. Nune et al. [58] reported that a significant portion of the household income in BMER comes from forest resources. For example, forests contributed 40.2% and 18.8% to the household income in Harenna Buluk and Nansebo Districts, respectively. A recent publication on land degradation [59] concluded that people living in and around degraded lands are actually poorer than those in areas that are not degraded.

4.3. Amount of Carbon Stock Removed due to Deforestation

In Africa in general, and Ethiopia in particular, LULCC has been the main driver of GHG emissions [7,44,60]. In 2011, the Ethiopian government declared its intention to reduce GHG emissions to the 2010 level while the growth trajectory would stay in the double digits to make Ethiopia a middle-income country by 2025. One of the mechanisms to reach that stated target is through conservation of forest resources, application of climate-smart agriculture, livestock, and feed management, and the use of renewable energy [12]. However, even today, emissions from deforestation are being witnessed. As a result of past and present anthropogenic factors as well as problems associated with inappropriate policy and institutional arrangements [58], substantial amounts of GHGs are released, resulting in other negative impacts on the environment [44,45,61]. About 30%–35% of global GHG emissions come from deforestation as well as methane and nitrous oxide emissions as a result of agricultural practices [45]. Conservatively, about 24.6 million tons of carbon were removed from forest resources in BMER within the study period. Similarly, from shrubland alone, over 3 million tons of carbon were removed.
OFWE et al. [32] used an allometric equation developed by Chave et al. [62] and considered diameter at breast height (dbh) to determine the wood stock/volume in the BMER. Estimating wood stock in natural forests based on dbh alone may underestimate the wood stock or volume since the structure and composition of the forests vary depending on edaphic and other factors. The recommended approach for determining wood stock or volume is the measurement of the length of merchantable logs and diameters at the bottom, middle, and top of the logs. Newton’s formula is the most accurate method to determine the volume of a tree given the proper skill and instruments (such as a Spiegel relaskop to take the three measurements) are available [63]. Once volume per ha is estimated, carbon stock using Biomass Expansion Factor could be estimated using the method developed by Brown [64]. Therefore, the estimate made in this study can be improved if the abovementioned approach has been followed. Nevertheless, the estimate made by OFWE et al. [32] still exceeds the estimate made by the Ethiopian Ministry of Environment, Forest and Climate Change. Very recently, the ministry has reported carbon stocks of 98.9 t of C·ha−1 and 57.7 t of C·ha−1 for Ethiopia in reference to moist and dry Afromontane forests, respectively [65], whereas OFWE et al. [32] estimated 191.28 and 126.71 t of C·ha−1 from similar forests, respectively, in BMER. The difference may be due to the approaches used in the estimation of carbon stocks. Also, BMER is a small area compared with the forest lands found in Ethiopia though the sampling intensity used by OFWE et al. [32] was higher. In general, the method employed by OFWE et al. [32] provides better results compared with the Tier 1 approach where default values are subject to a wide margin of error since the data are based on certain specific areas (tend to be biased) and biomes (very coarse) [7].
Other losses associated with LULCC are GDP and ecosystem service values (ESVs). In the deforested regions of Ethiopia, the topsoil has already been substantially degraded, causing the soil depth to drop to less than 10 cm [66]. In this region, especially in the highlands, it is estimated that 30,000 ha of productive lands are lost annually as a result of soil erosion. For example, the annual production lost due to soil erosion in the Amhara National Regional State alone is nearly 10,000 tons [27]. The annual loss of GDP from the agriculture sector in the country has been estimated at 2.3% due to land degradation [67]. Land degradation is linked to food insecurity, vulnerability to climate change, and poverty [59]. Hence, land degradation and poverty are becoming inseparable problems for the rural poor. The loss of ESVs due to LULCC has not been investigated in this study. However, it has been shown that in Nenjiang River Basin, Northeast China, all of the ESVs declined from 1980 to 2005 [68]. The total decline of $2.43 billion was mainly due to the cultivation of grassland (14.34% of the area in 1980) and wetlands (4.62% of the area in 1980) in the downstream plain. Similarly, a study focusing on the analyses of four decades of LULCC in the Munessa-Shashemene landscape, Ethiopia, revealed a loss of ESVs equivalent to $19.3–45.9 million [69]. It is important to note that the value differs depending on the type of coefficient employed. Given the fact that the BMER ecosystem is one of the most unique ecosystems in the world, the ESVs lost would be unimaginably high. The loss of these EVSs in the BMER, thus, requires urgent investigation.
The unique genetic resources of BMER are under pressure. According to Vial et al. [64], the population of livestock grazing in the Sanetti Plateau of the Bale Mountains has increased. Also, the production system is leading to the degradation of the habitat of the endemic Ethiopian wolf. This animal species depends on the giant mole-rat (Tachyoryctes macrocephalus) for food. Both the Ethiopian wolf and giant mole-rat are already on the IUCN list of endangered species [70] since their populations are declining. The habitat of the giant mole-rat has been highly degraded through trampling by domestic animals. The Ethiopian wolf has been under threat from domestic dogs, which also have the potential to transmit diseases [71].
In general, the current drivers of LULCC in BMER are anthropogenic. Intervention in family planning, amongst other things, is required to maintain population growth commensurate to the carrying capacity of the area to ensure environmental sustainability. Equally, creating green jobs that can absorb the available labor force in the rural area to reduce or prevent further LULCC should be on the agenda for action in the future. Furthermore, transdisciplinary policies that equitably address social, economic, and environmental issues in the BMER are required.
Land allocation to different uses in the study area should be made based on principles of land use planning or spatial planning categories. There is a need to match the capability of the land with social needs, economic benefits, and ecological sustainability, and to prioritize interventions in such a way that benefits to present and future generations are ensured. This entails the active engagement of spatial planners [58]. Failure to engage in such interventions would accelerate the ongoing trends of LULCC with undesirable consequences for the cover of forests, shrubland, and grasslands, and the associated deforestation and degradation of natural resources. This, in turn, would make the achievement of Sustainable Development Goals (SDGs, particularly 15.1, 15.2, 15.4, and 15.5) difficult for Ethiopia (see Box 1 for description of SGDs mentioned in this article). Therefore, a paradigm shift is required towards availing and implementing proper land use policies and dedicated institutions. Moreover, interventions that ensure the sustainable use of environmental resources in the study area need to be designed. Optimum rather than maximum utilization needs to be sought.
Box 1. Sustainable Development Goal 15 and Its Targets (Source: [72]).
SDGTargets
15.1By 2020, ensure the conservation, restoration, and sustainable use of terrestrial and inland freshwater ecosystems and their services, in particular forests, wetlands, mountains, and drylands, in line with obligations under international agreements.
15.2By 2020, promote the implementation of sustainable management of all types of forests, halt deforestation, restore degraded forests, and substantially increase afforestation and reforestation globally.
15.4By 2030, ensure the conservation of mountain ecosystems, including their biodiversity, in order to enhance their capacity to provide benefits that are essential for sustainable development.
15.5Take urgent and significant action to reduce the degradation of natural habitats, halt the loss of biodiversity, and, by 2020, protect and prevent the extinction of threatened species.
15.9By 2020, integrate ecosystem and biodiversity values into national and local planning, development processes, poverty reduction strategies, and accounts.

5. Conclusions

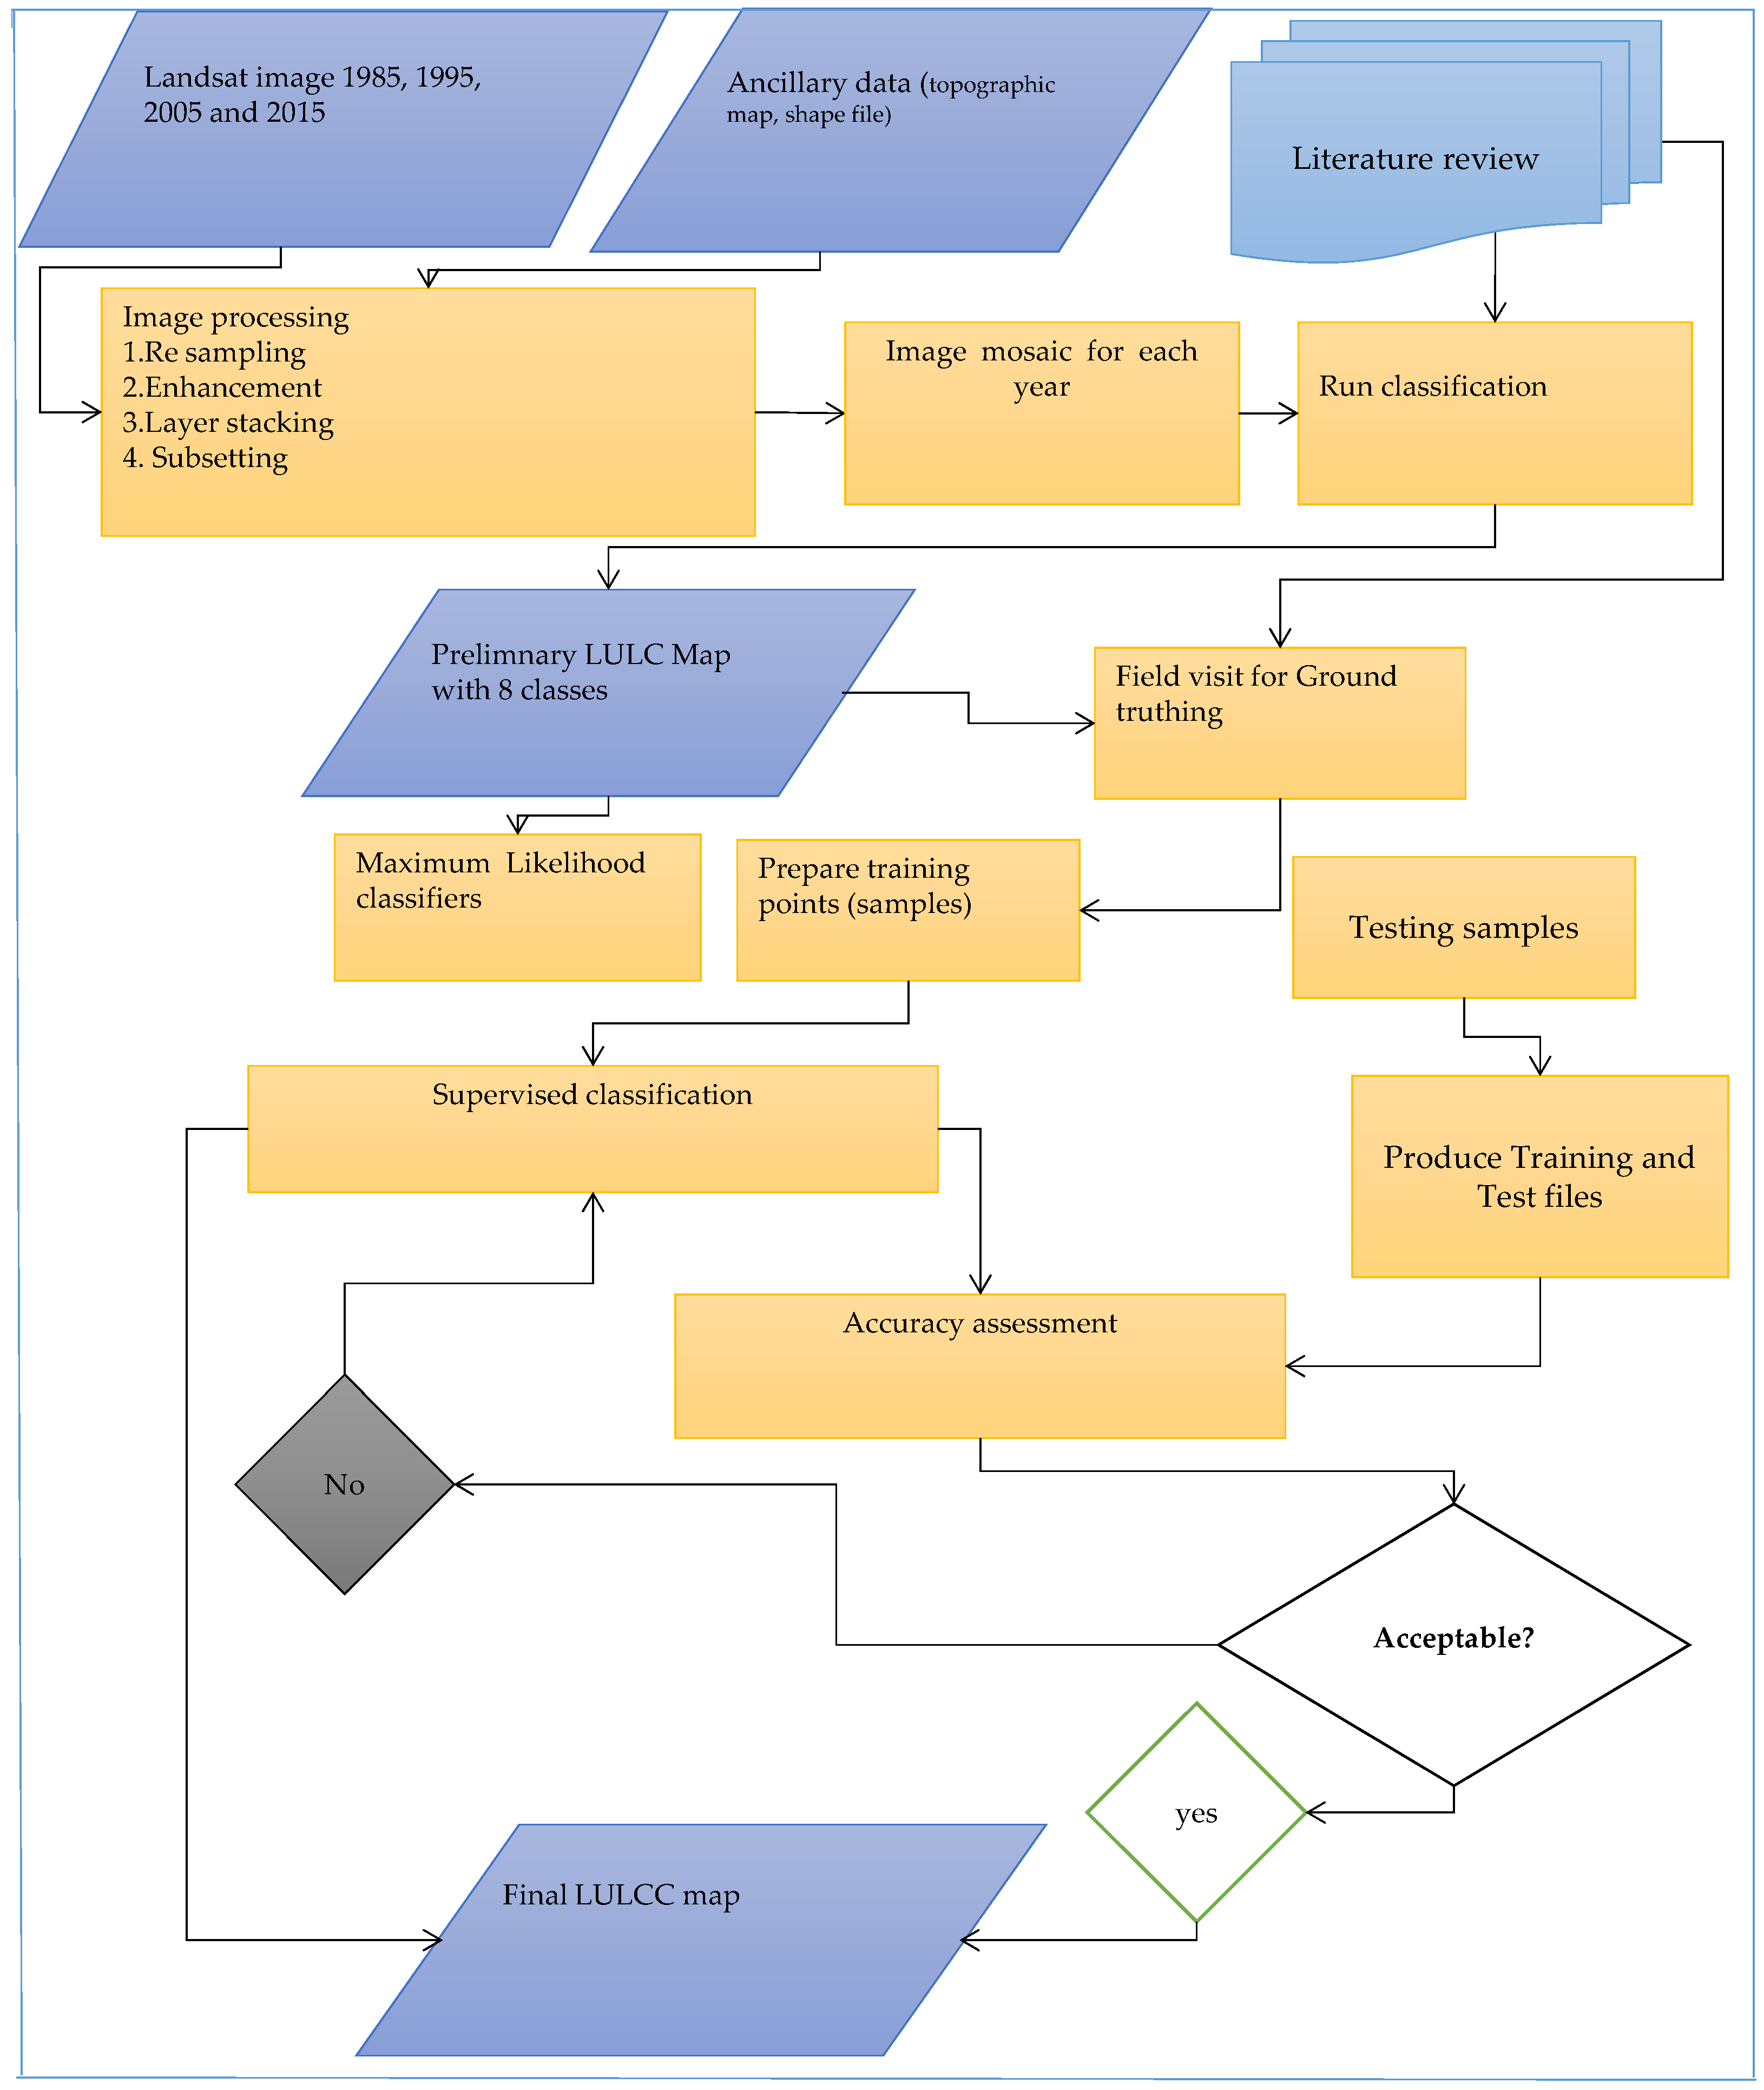
Remote sensing and GIS are beneficial tools for monitoring and evaluating temporal and spatial LULCC. Analyses of LULCC over three decades using these tools revealed trends and also which LULC types were affected, either positively or negatively. Landsat imageries are medium-scale remote sensing tools that are ideal for LULCC analyses [36] of such scales as BMER. Eight major land use and land cover types were identified, and their extent in terms of coverage (ha) was assessed between 1985 and 2015. Finally, although the assessment of classification accuracy was not a simple task [39], the overall accuracies of these classifications were 85.2%, 87.2%, 76.9%, and 87.9% for 1985, 1995, 2005, and 2015, respectively. BMER encompasses a very large area, and diverse soil types, topography, altitudinal variation, and vegetation density exist. In such situations, classification becomes difficult as a particular land cover, for example grassland, may depict different spectral signatures in the featured space, which is influenced by the agro-ecology in which the particular land cover is found [36].
In total, 123,751 ha of forest, 93,078 ha of shrubland, 83,158 ha of grassland, 2473 ha of Erica-dominated land, 3601 ha of woodland, and 3455 ha of Afroalpine vegetation were lost during 1985–2015. The forest LULC type lost the most while farmland gained at the same magnitude. The capacity of forests to provide ecosystem services may be significantly constrained, which, directly and indirectly, may have impacts on the 12 million people living within and around the eco-region as well as Northern Somalia and Kenya due to the negative impact on rivers originating from the BMER.
The major driving force behind all these changes is farming. A strong correlation between the areas of farmland and cropland expansion was observed.
A strong correlation between population growth and cropland expansion was also observed. Some indications, such as local elections, may have an effect on LULCC, especially deforestation, but this needs further investigation. Government policy also contributed to LULCC where most grazing lands were converted to farmland. Weak institutional arrangements and weak law enforcement are other factors contributing to LULCC.
More than 24 million tons of carbon have been removed from the forest ecosystem during 1985–2015 in BMER. The majority of this carbon has, probably, been released into the atmosphere in the form of GHG. The potential of the forest ecosystem to absorb CO2 from the atmosphere has also been reduced. At this rate, achieving the goal set by the Government of Ethiopia of reaching middle-income country status by 2025 while maintaining GHG emission at the 2010 level may be difficult.
In the future, allocation of land to different uses needs to be based on land use policies. Tagging values for each land cover as per the SDG 15.9, which recommends integrating ecosystem and biodiversity values into national and local planning, etc., may be one mechanism for limiting the unplanned expansion of one LULC type at the expense of another.
In the future, further investigations are recommended on the impacts of economic forces, from local up to global levels; infrastructure development, such as roads; and poverty on LULCC in the BMER.

Acknowledgments

We would like to acknowledge the Royal Norwegian Embassy in Addis Ababa for the financial and other material support provided during the study. We thank PhD candidates Berhanu Kebede and Alemnew Berhanu of Addis Ababa University for their support in gathering socioeconomic data from the Central Statistics Agency in Ethiopia. We are also grateful to Merga Diyessa for his assistance in remote sensing and GIS. Finally, we would like to thank the University of Bergen for giving us access to peer-reviewed journals through its digital library.

Author Contributions

Sisay Nune Hailemariam conceived and designed the methods, selected materials, assembled and analyzed the data, and prepared the article. Teshome Soromessa and Demel Teketay critically reviewed each chapter and provided comments and input. Additionally, Demel Teketay and Teshome Soromessa provided extensive advice on the arrangement and structure of the article as well as its contents.

Conflicts of Interest

The authors declare no conflict of interest.

References

  1. Ellis, E. Land-Use and Land-Cover Change. The Encyclopedia of Earth, Environmental Information Coalition, National Council for Science and Environment. 17 July 2006. Available online: http://www.aughty.org/pdf/landuse_landcover.pdf (accessed on 9 November 2016).
  2. World Resources Institute (WRI) 2000–2001. People and Ecosystems: The Frying Web of Life; WRI: Washington, DC, USA, 2001. [Google Scholar]
  3. Global Environment Facility. Land Use, Land-Use Change, and Forestry (LULUCF) Activities; GEF: Washington, DC, USA, 2012. [Google Scholar]
  4. Lawler, J.J.; Lewis, D.J.; Nelson, E.; Plantinga, A.J.; Polasky, S.; Withey, J.C.; Helmers, D.P.; Martinuzzi, S.; Pennington, D.; Radeloff, V.C. Projected land-use change impacts on ecosystem services in the United States. Proc. Natl. Acad. Sci. USA 2014, 111, 7492–7497. [Google Scholar] [CrossRef] [PubMed]
  5. United States Environmental Protection Agency (USEPA). Climate Change: Global Greenhouse Gas Emissions Data. Available online: https://www3.epa.gov/climatechange/ghgemissions/global.html (accessed on 24 February 2016).
  6. FAO. How to Feed the World in 2050. Available online: http://www.fao.org/fileadmin/templates/wsfs/docs/Issues_papers/HLEF2050_Global_Agriculture.pdf (accessed on 22 November 2015).
  7. Gibbs, H.K.; Brown, S.; Niles, J.O.; Foley, J.A. Monitoring and estimating tropical forest carbon stocks: Making REDD a reality. Environ. Res. Lett. 2007, 2. [Google Scholar] [CrossRef]
  8. Forestry and Wildlife Conservation and Development Authority (FaWCDA). Forestry for Development; FaWCDA: Addis Ababa, Ethiopia, 1982; p. 108. [Google Scholar]
  9. FAO. Global Forest Resources Assessment 2015: Desk Reference; Food and Agriculture Organisation of the United Nations: Rome, Italy, 2015; Available online: http://www.fao.org/3/a-i4808e.pdf (accessed on 21 September 2016).
  10. Wright, C. Ethiopian Highland Reclamation Study. In An Assessment of the Causes, Severity, Extent and Probable Consequences of Degradation in the Ethiopian Highlands; Ministry of Agriculture: Addis Ababa, Ethiopia, 1984; p. 60. [Google Scholar]
  11. FDRE. Ethiopia’s Climate-Resilient Green Economy Green Economy Strategy; Environmental Protection Authority: Addis Ababa, Ethiopia, 2011; p. 188.
  12. FDRE. Ethiopia’s Climate-Resilient Green Economy: Climate Resilient Strategy Water and Energy; Ministry of Water, Irrigation and Energy: Addis Ababa, Ethiopia, Undated; p. 64.
  13. FDRE. Ethiopia’s Climate Resilient Green Economy: Climate Resilience Strategy Agriculture and Forestry; Ministry of Agriculture: Addis Ababa, Ethiopia, Undated; p. 70.
  14. Mideksa, T.K. Economic and distributional impacts of climate change: The case of Ethiopia. Glob. Environ. Chang. 2010, 20, 278–286. [Google Scholar] [CrossRef]
  15. Yitzhaki, S.; Schechtman, E. More than a dozen alternative ways of spelling Gini. In The Gini Methodology: A Primer on a Statistical Methodology; Springer Science+Business Media: New York, NY, USA, 2013; pp. 11–31. [Google Scholar]
  16. Van Uffelen, J.-G. From disaster response to predictable food security interventions: Structural change or structural reproduction? In Food Security, Safety Net and Social Protection in Ethiopia; Rahmato, D., Pankhurst, A., van Uffelen, J.-G., Eds.; Forum for Social Study: Addis Ababa, Ethiopia, 2013; pp. 147–176. [Google Scholar]
  17. Devereux, S. Famine in the Twentieth Century; IDS Working Paper 105; IDS: Brighton, UK, 2000; Available online: https://www.ids.ac.uk/files/dmfile/wp105.pdf (accessed on 1 April 2016).
  18. Office of Prime Minister. The National Population Policy of Ethiopia. Available online: http://www.phe-ethiopia.org/pdf/Population_Policy_of_Ethiopia.pdf (accessed on 2 April 2016).
  19. Iqbal, M.F.; Khan, I.A. Spatiotemporal land use land cover change analysis and erosion risk mapping of Azad Jammu and Kashmir, Pakistan. Egypt. J. Remote Sens. Space Sci. 2014, 17, 209–229. [Google Scholar] [CrossRef]
  20. Teferi, E.; Bewket, W.; Uhlenbrook, S.; Wenninger, J. Understanding recent land use and land cover dynamics in the source region of the upper Blue Nile, Ethiopia: Spatially explicit statistical modelling of systematic transitions. Agric. Ecosyst. Environ. 2013, 165, 98–117. [Google Scholar] [CrossRef]
  21. Teferi, E.; Bewket, W.; Simane, B. Effect of land use land cover on selected soil quality indicators in the headwater area of the Blue Nile basin of Ethiopia. Environ. Monit. Assess. 2016, 188, 1–12. [Google Scholar] [CrossRef] [PubMed]
  22. Biazin, B.; Sterk, G. Drought vulnerability drives land-use and land cover changes in the Rift Valley dry lands of Ethiopia. Agric. Ecosyst. Environ. 2012, 64, 100–113. [Google Scholar] [CrossRef]
  23. Mengistu, D.A.; Waktola, K.D. Monitoring land use/land cover change impacts on soils in data scarce environments: A case of south-central Ethiopia. J. Land Use Sci. 2016, 11, 98–112. [Google Scholar] [CrossRef]
  24. Tsegaye, D.; Moe, S.R.; Vedeld, P.; Aynekulu, E. Land-use/cover dynamics in Northern Afar rangelands, Ethiopia. Agric. Ecosyst. Environ. 2010, 139, 174–180. [Google Scholar] [CrossRef]
  25. Desalegn, T.; Cruz, F.; Kindu, M.; Turrion, M.B.; Gonzalo, J. Land-use/land-cover change and socioeconomic conditions of local community in the central highlands of Ethiopia. Int. J. Sustain. Dev. World Ecol. 2014, 21, 406–413. [Google Scholar] [CrossRef]
  26. Bewket, W.; Abebe, S. Land-use and land-cover change and its environmental implications in a tropical highland watershed. Int. J. Environ. Stud. 2013, 70, 126–139. [Google Scholar] [CrossRef]
  27. Woody Biomass Inventory and Strategic Planning Project (WBISPP). A National Strategic Plan for the Biomass Energy Sector: Final Report; Ministry of Agriculture and Rural Development: Addis Ababa, Ethiopia, 2005; p. 201.
  28. Frankfurt Zoological Society (FZS). Bale Mountains National Park General Management Plan 2007–2017; Frankfurt Zoological Society: Addis Ababa, Ethiopia, undated; p. 222.
  29. Desta, W.A. Assessment of Land Use Land Cover Dynamics at Bale Mountains National Park Using GIS and Remote Sensing. M.Sc. Thesis, Addis Ababa University, Addis Ababa, Ethiopia, 2007. [Google Scholar]
  30. Kidane, Y.; Stahlmann, R.; Beirkuhnein, C. Vegetation dynamics, and land use and land cover change in the Bale Mountains, Ethiopia. Environ. Monit. Assess. 2012, 184, 7473–7489. [Google Scholar] [CrossRef] [PubMed]
  31. Warra, H.H.; Mohammed, A.A.; Nicolau, M.D. Spatio-Temporal Impact of Socio-economic practices on land use land cover in the Kasso Catchment, Bale Mountains, Ethiopia. Univ. Iasi-Geogr. Ser. 2013, 59, 1. Available online: http://www.analegeo.uaic.ro/index.php/SciGeo/article/view/214 (accessed on 2 April 2016). [Google Scholar]
  32. Oromia Forest and Wildlife Enterprise (OFWE); FARM Africa and SOS Sahel Ethiopia. Bale Mountains Eco-region Reduction of Emission from Deforestation and Forest Degradation (REDD+) Project-Ethiopia; FARM Africa and SOS Sahel: Addis Ababa, Ethiopia, 2014. [Google Scholar]
  33. Woldu, Z.; Feoli, E.; Nigatu, L. Partitioning an elevation gradient of vegetation from southeastern Ethiopia by probabilistic methods. Vegetatio 1989, 81, 189–198. [Google Scholar] [CrossRef]
  34. Friis, I.; Demissew, S.; van Breugel, P. Atlas of the Potential Vegetation of Ethiopia; Addis Ababa University Press & Shama Books: Addis Ababa, Ethiopia, 2011; p. 307. [Google Scholar]
  35. Central Statistics Agency (CSA). Area and Production of Major Crops: Private Peasant Holdings, Meher Season; Statistical Bulletin, CSA: Addis Ababa, Ethiopia, 2014.
  36. Bakker, W.H.; Gorte, B.G.H.; Janssen, L.L.E.; Pohl, C.; Prakash, A.; Reeves, C.V.; Weir, M.J.C.; Woldai, T. Principles of Remote Sensing; ITC: Enschede, The Netherlands, 2001; p. 180. [Google Scholar]
  37. ITC. ILWIS 3.0 Academic: User Guide; ITC: Enschede, The Netherlands, 2001; p. 530. [Google Scholar]
  38. Thomas, I.L.; Benning, V.M.; Ching, N.P. Classification of Remotely Sensed Images; IOP Publishing Limited: Bristol, UK, 1987; p. 268. [Google Scholar]
  39. Foody, G.M. Status of land cover classification accuracy assessment. Remote Sens. Environ. 2002, 80, 185–201. [Google Scholar] [CrossRef]
  40. Kindu, M.; Schneider, T.; Teketay, D.; Knoke, T. Land Use/Land Cover Change Analysis Using Object-Based Classification Approach in Munessa-Shashemene Landscape of the Ethiopian Highlands. Remote Sens. 2013, 5, 2411–2435. [Google Scholar] [CrossRef]
  41. Chen, X. Using remote sensing and GIS to analyse landcover change and its impacts on the regional sustainable development. Int. J. Remote Sens. 2010, 23, 107–124. [Google Scholar]
  42. Lu, D.; Mausel, P.; Brondizion, E.; Moran, E. Change detection techniques. Int. J. Remote Sens. 2003, 25, 2365–2407. [Google Scholar] [CrossRef]
  43. Nune, S.; Menale, K.; Mungatana, E. Forest Resource Accounts for Ethiopia. In The Implementing Environmental Accounts; Hassan, R.M., Mungatana, E.D., Eds.; Springer Science+Business Media: Dordrecht, The Netherlands, 2013; Volume 28, pp. 103–142. [Google Scholar]
  44. Gibbs, H.K.; Ruesch, A.S.; Achard, F.; Clayton, M.K.; Holmgren, P.; Ramankutty, N.; Foley, J.A. Tropical forests were the primary sources of new agricultural land in the 1980s and 1990s. Proc. Natl. Acad. Sci. USA 2010, 107, 16732–16737. [Google Scholar] [CrossRef] [PubMed]
  45. Foley, J.A.; Ramankutty, N.; Brauman, K.A.; Cassidy, E.S.; Gerber, J.S.; Johnston, M.; Mueller, N.D.; O’Connell, C.; Ray, D.K.; West, P.C.; et al. Solutions for a cultivated planet. Nature 2011, 478, 337–342. [Google Scholar] [CrossRef] [PubMed]
  46. Wakjira, D.T.; D’Udine, F.; Crawford, A. Migration and Conservation in Bale Mountains Ecosystem. 2015. Available online: https://www.iisd.org/sites/default/files/publications/migration-conservation-bale-mountains-ecosystem-report.pdf (accessed on 13 July 2016).
  47. Pailler, S. Local Policies and Deforestation in the Brazilian Amazone. Ph.D. Dissertation, Clark University, Worcester, MA, USA, 2016. [Google Scholar]
  48. Nune, S.; Soromessa, T.; Teketay, D. Institutional arrangements and management of environmental resources in Ethiopia. Environ. Nat. Resour. Res. 2016, 6, 67–87. [Google Scholar] [CrossRef]
  49. Molders, N. Land-Use and Land-Cover Changes: Impact on Climate and Air Quality; Springer Science+Business Media: Dordrecht, The Netherlands, 2012; Volume 44, p. 197. [Google Scholar]
  50. Lee, J.-E.; Lintner, B.R.; Boyce, C.K.; Lawrence, P.J. Land use change exacerbates tropical South American drought by sea surface temperature variability. Geophys. Res. Lett. 2011, 38, 1–6. [Google Scholar] [CrossRef]
  51. Deo, R.C.; Syktus, J.I.; McAlpine, C.A.; Lawrence, P.J.; McGowan, H.A.; Phinn, S.R. Impact of historical land cover change on daily indices of climate extremes including droughts in eastern Australia. Geophys. Res. Lett. 2009, 36, 1–5. [Google Scholar] [CrossRef]
  52. Hosonuma, N.; Herold, M.; De Sy, V.; De Fries, R.; Brockhaus, M.; Verchot, L.; Angelsen, A.; Romijn, E. An Assessment of deforestation and forest degradation drivers in developing countries. Environ. Res. Lett. 2012, 7, 1–12. [Google Scholar] [CrossRef]
  53. Teshome, E.; Randall, D.; Kinahan, A. The changing faces of the Bale Mountain National Park over 32 years: A study of land cover change. J. Ethiop. Wildl. Nat. Hist. Soc. 2011, Walia Special Edition. 118–130. [Google Scholar]
  54. Geist, H.J.; Lambin, E.F. What Drives Tropical Deforestation?. A Meta-Analysis of Proximate and Underlying Causes of Deforestation Based on Subnational Case Study Evidence; LULCC Report Series No. 4; CIACO: Louvain-la-Neuve, Belgium, 2001; pp. 1–116. [Google Scholar]
  55. Randall, D.; Thirgood, S.; Kinahan, A. (Eds.) Walia-Special Edition on the Bale Mountains. J. Ethiop. Wildl. Nat. Hist. Soc. 2011, Walia Special Edition. 350.
  56. Hillman, J.C. The Bale Mountains National Park Area, Southeast Ethiopia, and its management. Mountain Res. Dev. 1988, 8, 253–258. [Google Scholar] [CrossRef]
  57. Power, A.G. Ecosystem services and agriculture: Tradeoffs and synergies. Phil. Trans. R. Soc. B 2010, 365, 2959–2971. [Google Scholar] [CrossRef] [PubMed]
  58. Nune, S.; Soromessa, T.; Teketay, D. Non-carbon benefits for effective implementation of REDD+: The case of Bale Mountains Eco-Region, Southeastern Ethiopian. Afr. J. Environ. Sci. Technol. 2015, 9, 747–764. [Google Scholar] [CrossRef]
  59. Barbier, E.B.; Hochard, J.P. Does land degradation increase poverty in developing countries? PLoS ONE 2016, 11, 1–12. [Google Scholar] [CrossRef] [PubMed]
  60. DeFries, R.; Rosenzweig, C. Towards a whole-landscape approach for sustainable land use in the tropics. Proc. Natl. Acad. Sci. USA 2010, 107, 19627–19632. [Google Scholar] [CrossRef] [PubMed]
  61. Ramankutty, N.; Evan, A.T.; Monfreda, C.; Foley, J.A. Farming the Planet: 1. Geographic distribution of global agricultural lands in the year 2000. Glob. Biogeochem. Cy. 2008, 22, 1–19. [Google Scholar] [CrossRef]
  62. Chave, J.; Andalo, C.; Brown, S.; Cairns, M.A.; Chambers, J.Q.; Eamus, D.; Fölster, H.; Fromard, F.; Higuchi, N.; Kira, T.; et al. Tree allometry and improved estimation of carbon stocks and balance in tropical forests. Oecologia 2005, 145, 87–99. [Google Scholar] [CrossRef] [PubMed]
  63. Loetsch, F.; Haller, K.E. Forest Inventory; BLV Verlagsgesellschaft: Munich, Germany, 1973; Vol. 2, pp. 1–469. [Google Scholar]
  64. Brown, S. Estimating Biomass and Biomass Change of Tropical Forests: A Primer; Forestry Paper 134; FAO: Rome, Italy, 1997. [Google Scholar]
  65. Moges, Y.; Ethiopian Forest Reference Level Submission to UNFCCC; Addis Ababa, Ethiopia. Personal Communication, 10 October 2016.
  66. European Union Delegation to Ethiopia (EUDE). Assessing the root causes of recurring food insecurity in Ethiopia; EUDE: Addis Ababa, Ethiopia, 2016. [Google Scholar]
  67. Ministry of Agriculture and Rural Development (MoARD). Ethiopian Strategic Investment Framework for Sustainable Land Management; MoARD: Addis Ababa, Ethiopia, 2010; p. 158.
  68. Wang, Z.; Wang, Z.; Zhang, B.; Lu, C.; Ren, C. Impact of land use/land cover changes on ecosystem services in the Nenjiang River Basin, Northern China. Ecol. Process. 2015, 4, 11. [Google Scholar] [CrossRef]
  69. Kindu, M.; Schneider, T.; Teketay, D.; Knoke, T. Changes of ecosystem service values in response to land use/land cover dynamics in Munessa-Shashemene landscape of the Ethiopian Highlands. Sci. Total Environ. 2015, 547, 137–147. [Google Scholar] [CrossRef] [PubMed]
  70. The IUCN Red List of Threatened Species. Available online: http://www.iucnredlist.org/ (accessed on 24 June 2016).
  71. Vial, F.; Sillero-Zubiri, C.; Marino, J.; Haydon, D.T.; Macdonald, D.W. An analysis of long-term trends in the abundance of domestic livestock and free-roaming dogs in the Bale Mountains National Park, Ethiopia. Afr. J. Ecol. 2010, 49, 91–102. [Google Scholar] [CrossRef]
  72. Sustainable Development Knowledge Platform. Sustainable Development Goal 15, UN-DESA. 2015. Available online: https://sustainabledevelopment.un.org/sdg15 (accessed on 30 August 2016).
Figure 1. Map of Ethiopia showing the location of the study area.
Land 05 00041 g001
Figure 2. Flowchart showing the procedures employed to arrive at the final LULCC map.
Land 05 00041 g002
Figure 3. LULC changes in BMER during 1985–2015.
Land 05 00041 g003
Figure 4. A comparative map showing the actual LULCC in BMER in 1985 (a) and 2015 (b).
Land 05 00041 g004
Figure 5. Deforestation (a) and farmland expansion (b) in BMER between 1985 and 2015.
Land 05 00041 g005
Figure 6. LULC types changed to farmland (a) in BMER and area occupied by crops in Bale Zone (b).
Land 05 00041 g006
Figure 7. Human (a) and livestock (b) population growth in the Bale Zone. Data are from the Central Statistics Agency of Ethiopia.
Land 05 00041 g007
Table 1. Annual deforestation in Ethiopia from 1955–1979. Source: [8].
YearAnnual Average Deforestation (ha)
1955–1967697,000
1967–1976293,000
1976–1979205,000
Table 2. Error matrix with derived errors and accuracies for the years 1985 (a) and 2015 (b) in percentages.
(a) Reference Data
    ClassErica-DominatedFarmlandGrasslandShrublandUrbanWoodlandsAfroalpineForestTotal
Erica-dominated90.00.00.00.00.00.00.00.04.6
 Farmland0.095.00.05.00.00.00.00.010.2
 Grassland0.00.070.010.09.60.00.013.313.7
Shrubland10.00.010.080.01.95.00.04.411.7
 Urban0.00.015.05.071.20.00.08.922.8
Woodlands0.00.00.00.00.095.00.00.09.6
 Afroalpine0.00.00.00.03.90.0100.00.06.1
 Forest0.05.05.00.013.50.00.073.321.3
 Total100100100100100100100100100
Class% Commission%OmissionProd. Acc. (%)User Acc. (%)
 Erica0.010.090.0100.0
 Farmland5.05.095.095.0
 Grassland48.230.070.051.9
 Shrubland30.420.080.069.6
 Urban17.828.971.282.2
Woodlands0.05.095.0100.0
 Afroalpine16.70.0100.083.3
 Forest21.426.773.378.6
Overall Accuracy = 85.2%; Kappa Coefficient = 0.8150
(b) Reference Data
 ClassErica-DominatedFarmlandAfroalpineForestGrasslandShrublandUrbanWoodlandTotal
Erica-dominated96.82.00.00.02.94.40.00.06.3
Farmland0.098.00.00.00.00.00.00.024.3
 Afroalpine0.00.097.20.81.00.00.00.06.1
 Forest0.00.00.075.01.02.21.70.015.9
 Grassland3.20.00.010.589.26.56.71.818.7
Shrubland0.00.00.06.52.073.96.73.68.3
Urban0.00.00.07.31.04.483.31.810.4
Woodlands0.00.00.00.02.08.70.092.79.4
 Total100100100100100100100100100
   Class% Commission% OmissionProd. Acc. %User Acc. %
Erica-dominated21.13.296.879.0
Farmland0.02.098.0100.0
 Afroalpine5.42.897.294.6
 Forest3.125.075.096.9
 Grassland19.510.889.280.5
Shrubland32.026.173.968.0
Urban20.616.783.379.4
Woodland10.57.392.789.5
Overall Accuracy = 87.9%; Kappa Coefficient = 0.8567
Table 3. Area and proportion of LULC in BMER in 1985, 1995, 2005, and 2015.
LULCC Type1985199520052015
Area (ha)Proportion (%)Area (ha)Proportion (%)Area (ha)Proportion (%)Area (ha)Proportion (%)
Afroalpine33,2700.933,1760.933,0600.929,8160.8
Erica-Dominated90,4272.490,0662.489,9932.487,9552.3
Farmland581,37715.4631,64816.8770,35220.5873,67223.2
Forest784,42020.8775,25320.6707,42718.8660,66917.5
Grassland718,80219.1699,54618.6688,08118.3635,64416.9
Shrubland686,76218.2664,72617.6603,91116.0593,68315.8
Urban Settlements93420.0210,8460.114,5280.126,5640.7
Woodland863,02222.9862,16222.9860,07222.8859,42122.8
Total3,767,4221003,767,4221003,767,4221003,767,422100
Table 4. Extent of LULCC (area in ha) during 1985–2015.
LULC Type1985–19951995–20052005–2015
Afroalpine−94−116−3245
Erica-dominated−362−73−2038
Farmland50,271138,703103,320
Forest−9167−67,827−46,757
Grassland−19,256−11,465−52,437
Shrubland−22,036−60,815−10,227
Urban Settlements1504368312,036
Woodlands−860−2090−651
Table 5. Change matrix of LULCC types between 1985 and 2015.
LULC TypeInitial Area (ha) (1985) of LULCC Type
Final state (2015)AfroalpineErica-DominatedFarmlandForestGrasslandShrublandUrban SettlementWoodland
Afroalpine29,8160000000
Erica-Dominated087,955000000
Farmland34552473292,294123,75174,24692,57703601
Forest000660,6690000
Grasslands0000635,644000
Shrub lands000130593,683015
Urban settlements0078070891250117,2220
Woodlands0000000859,420
Total29,81687,955873,671660,669635,644593,68326,564859,420
Total 198533,27090,427581,377784,420718,802686,7629342863,022

