Original Article
, Volume: 13( 5)Land Use/Land Cover Dynamics and Its Impact on Biodiversity Resources in the Abijata Shalla National Park, Central Rift Valley Lakes Region, Ethiopia
- *Correspondence:
- Yohannes H, College of Agriculture, Natural Resource Management department, Debre Berhan University, Ethiopia, Tel: +251 0913043223; E-mail: hamerenew@gmail.com
Received: September 29, 2017; Accepted: October 12, 2017; Published: October 17, 2017
Citation: Yohannes H, Mohammed A, Elias E. Land Use/Land Cover Dynamics and Its Impact on Biodiversity Resources in the Abijata Shalla National Park, Central Rift Valley Lakes Region, Ethiopia . Environ Sci Ind J. 2017;13(5):152.
Abstract
Land use and land cover (LULC) dynamics have been among the most important visible changes that have taken place everywhere in the Ethiopian landscape. Such changes are severely affecting ecosystem health including degradation of nature reserves and wild animal sanctuaries. One such nature reserve in Ethiopia is the Abijata-Shala National Park (ASNP). A digital LULC detection technique was applied by using multi-temporal satellite imagery interpretation in order to understand the landscape dynamics in the ASNP. In order to assess the state of the environment over time, four timelines associated with biodiversity loss were considered: 1973, 1994, 2000 and 2016. Supervised classifications in ERDAS imagine 2014 software and post-classification in Arc GIS software was performed. The image was classified into five major land use classes namely water bodies, grazing land, cultivated land, Acacia dominated wood land and bare land. It was observed that water bodies decreased in the first period (1973-1994) and increase in the second period (1994-2000) but fallen drastically afterwards in the third period (2000-2016). This is a pattern opposite to what we see in the cultivated land. The overall trend shows that grazing and cultivated land increase by 14% and 15% respectively while, the water bodies decreased by about 16%. The reduction of woodlands and water bodies means loss of habitat for large number of aquatic and terrestrial species of animals including endemic and migratory birds. Bare land trend shows that decrease by 1.02% in first period, increase by 0.56% in second period and decrease in third period by 4.17%. We conclude that in the park there is substantial change in LULC which could affect the biodiversity of the park.
Keywords
Abijata Shalla Lakes National Park; Arc GIS; Biodiversity loss; ERDAS imagine; Land use/cover change
Introduction
In the 1960s formal wildlife resource management in Ethiopia was initiated in the form of protected areas, sanctuaries, and agro-biodiversity reserves. Currently, there are many protected areas throughout the country designated as National Parks, Wildlife Reserves, High Priority Forest Areas (HPFA), Biosphere Reserves and Community Conservation Areas. These not only act as biodiversity ‘banks’, but also provide important ecosystem services such as provisioning, supporting, regulating and cultural values [1]. The direct economic benefits include revenues from tourism and carbon trading through clean development mechanism [2].
Abijata Shalla Lakes National park (ASLNP) is one of Ethiopia’s protected areas, established in 1970 but has not yet been gazetted [3] although there are recent efforts to re-demarcate the park’s core reserve area [4], The park comprises a large number of aquatic and terrestrial ecosystems covering a surface area of 887 km2 [5,6]. In total, there are 453 bird species and 6 are endemic to Ethiopia due to the proximity of numerous and diverse aquatic and terrestrial habitats in the area [7]. The aquatic and terrestrial ecosystems account for 482 km2 and 405 km2, respectively. The park is mainly established to protect aquatic birds such as Flamingo lesser, Great White Pelican, phytoplankton, zooplankton, and fish as well as several terrestrial species Grant’s gazelles, Oribi warthog and the Golden Jackal are spotted mammals [8]. This large species diversity in the area makes the park one of biodiversity hotspot and Ramsar site for resident and migratory birds [2].
However, Ethiopia’s protected areas are increasingly being threatened by various internal and external pressures and land use changes including settlement by the ever-increasing population, expansion of cultivation and commercial farming, overgrazing and related competing claims from the surrounding communities.
Statement of the problem
The Abjitata Shala national park area, is very much threatened by overgrazing and deforestation for fuel wood production and illegal settlements and ethnic conflict [9]. The population density of the settlers in the park is 19 people per km2 that are spontaneously migrated from densely populated highlands that surround the rift valley lakes region. Official statistics indicate that migrants originated from Arsi Negele district (31,545 people) persons Shalla district (7246 people) and Adami Tulu district (4684 people) quite often resulting conflict among different groups. Over the last three decades, not only human population increased but also the livestock population inside the park has increased from 30,410 in 1971 to 202,644 in 2010 [3]. Therefore, population pressure during the last three decades has resulted in the conversion of natural vegetation, into cultivated and bare lands through overgrazing of natural grasslands, removal of natural shrub for fire wood, and clearing of forests for construction materials and charcoal making. As result of these changes in land use/cover, vulnerable sloping areas in the area face increased erosion and depletion of nutrients required for vegetative growth [10].
Further, lack of enforcement of environmental laws and rapid intensification of upstream agricultural activities have led to overexploitation of the water resources thereby threatening of aquatic and terrestrial biodiversity resources of the park. The unique bird species discussed above have now become endangered as a result of different habitat disturbance factors [11]. In addition, the soda ash factory which is established at the shore of Lake Abijata is threatening the park and existing Park functions [1]. Though, the park provides substantial ecosystem goods and services including Food and medicinal resources, fresh water, raw material, and erosion control etc. [1].
This clear that, the park is facing high pressure from human induced factor which definitely change land use system of the park. There are some studies focusing land use land cover change in great Ethiopian rift valley [12]. Policies and strategies need to be in place to curb the ever-increasing environmental degradation that is taking place inside the core reserve areas. However, spatially explicit land use land cover change data has been lacking and no in-depth study was previously conducted to generate such empirical data in support of policy decision to rescue the threated environment. Against this background, the study reported in this paper was initiated with the overall objective of proper understanding of the land use land cover dynamics and socio-economic drivers that are threatening the ASLNP area.
Specific objectives and research questions
1)Analyzing land use land cover change in the park over four periods taking 1973 as benchmark;
2)Assessing the impact of land use land cover change on the aquatic and terrestrial biodiversity resources and wildlifehabitat;
3)Propose management strategies to rehabilitate and sustainably manage the park area.
The study poses the central research question, “what are land use and land cover change patterns in the ASLNP area and how is it affecting the natural resources of the park”. The sub questions are:
• What is the land use land cover pattern of the ASLNP area over time starting the benchmark year of 1973?
• How does such change affect the aquatic and terrestrial ecosystem of the park area?
• What are the socio-economic drivers that brought about the land use changes around the park?
• What would be the policy strategies to address the competing claims to reconcile human actions with ecosystemsustainability?
Methods of the Study
Description of the study area
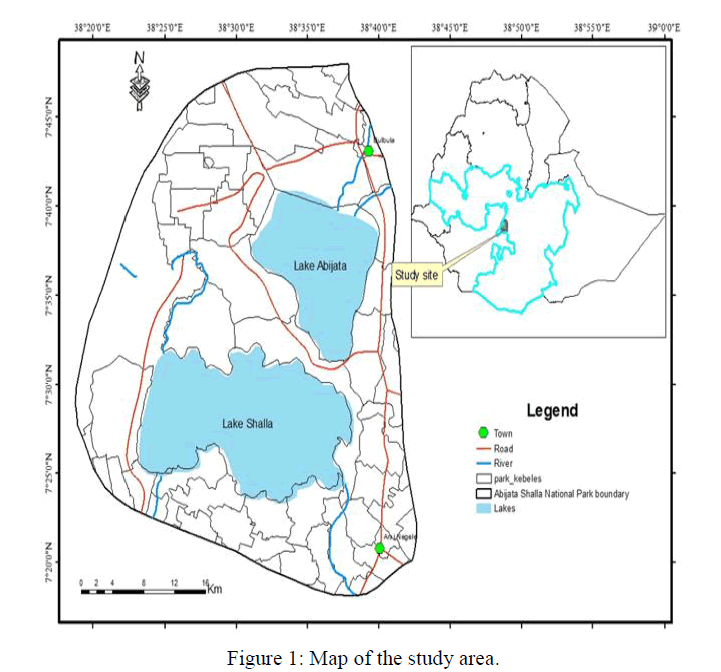
The Central Rift Valley (CRV) encompasses four hydrologically interconnected lakes, namely, Ziway, Abijata, Langano and Shalla. Lake Abijata and Lake Shalla are important nature reserves and they form core area of the Abijata Shalla Lakes National Park. The site is 200 kilometers south of Addis Ababa geographically situated at 7°15?– 7°45?N and 38°30?–38°45?E coordinates (Figure 1). The park area covers three districts: Arsi Negele (north east and in the south), Shalla (in the south west), and Adami Tullu Jido Kombolcha (in the north). Administratively, the area shares fall between the east Shewa and west Arsi zones of the Oromiya regional national state.
The climate of the ASLNP is semiarid for most of the year, with the rainy season between June and September and the dry season from October to February and the small rainy season in between. It receives an annual rainfall ranging between 500 (weather station at Lake Langano) and 700 mm (weather station at Lake Ziway) with mean annual temperature of 20°C. The altitude of the park ranges from 1540 m to 2075 m, the highest peak being Mount Fike, which is situated between the two lakes.
There are 31 species of mammals (including Grant’s gazelle, warthog, Anubis baboon, grivet, and colobus Monkeys, oribi, klipspringer, black-backed and common Jackal, greater kudu and 299 bird’s species and six are endemic [2].
The vegetation in the central rift valley of Ethiopia is characterized by Acacia open woodland, hence characterized as acacia woodland ecosystem. Livestock-based agro-pastoralism is central to the livelihoods of many rural households around the Rift Valley even though it is progressively encroached by subsistence agriculture. Therefore, Livestock and crop production are the main sources of livelihoods. Greater dependence of residents on resources from the park to generate their livelihoods, which can be regarded as direct economic benefits, and state objectives in protecting the park as conservation area has increased instability and conflict in the area [1,13].
Source and Type of Data
Data source
The research involved two elements – extensive desk review of published works and GIS-supported land use land cover change analysis over 4 periods. The land use land cover data were generated through satellite imagery interpretation in GIS environment.
Landsat images of the area for the year 1973, 1986, 1994 and 2016 were obtained from United States Geographical Society (USGS) website (http://earthexplorer.usgs.gov) (Table 1). The year 1973 was selected as reference year of a base line because it represents the pre-revolutionary period (i.e., the Feudal regime). The 1994 represent the period in the aftermath of the fall of the Dergue regime and the after the fall of Dergue regime in 1991 and Ethiopia People Revolution Democratic Front (EPRDF) become empowered. The year 2000 selected to represent a year after land registration and policy was drawn, and 2016 represent simply the latest year of our observation.
| Satellite image | No of band | Ground resolution | Acquisition date | Path/row |
|---|---|---|---|---|
| Landsat MSS (Multispectral Sensor) | 4 | 57m x 57m | 20/1/1973 | 181/055 |
| Landsat TM (Thematic Mapper) | 7 | 28.5m x 28.5m | 14/1/1994 | 168/055 |
| Landsat Enhanced TM+ | 7 | 28.5m x 28.5m | 23/1/2000and 28/1/2016 | 168/055 168/055 |
Table 1: Satellite images acquired.
The data were imported in ERDAS imagine 2014 software. The layer stack option in image interpreter tool box was used to generate false colour composites for the study areas. AOI (Area of Interest) were created for each class and imagery before the actual classification was done. To strength the classification, the vegetation index (Normalized Differences Vegetation Index) (NDVI) was calculated in ERDAS imagine.
Land Use /Land Cover Detection and Analysis
Image processing and classification
Computer assisted digital image processing was conducted to extract information that involves image classification and accuracy assessment. Before the image actually classified, Image preprocessing was performed. Image pre-processing is the initial processing of the raw data and normally involves processes like geometric corrections, image enhancement, noise removal and topographic corrections. Geometric and radiometric errors were corrected for each satellite image. After error correction image enhancement was done to improve the visual interpretation. Band combination and NDVI were the major image enhancement method used in this study. Band combination of 4,3,2 false color combination for band red, green, and blue, respectively was converted to 3,2,1 true color combination with similar color order as specified above to interpret the image properly. Both supervised and unsupervised digital image classifications were employed to detect the land use land cover changes in ERDAS and GIS environment with the help of online Google Earth. Five land use types were considered – woodland, cultivated area, grazing land, degraded land, and water bodies to detect land use change dynamic over time (Table 2).
| LULC class | Description |
|---|---|
| Water bodies | Includes the lake, ponds, and other areas with shallow water |
| Wood land | Areas covered by woody plants mainly Acacia-dominated areas |
| Cultivated land | Areas of land used for growing crops including homestead |
| Grazing land | Areas covered with natural pasture dominated by grasses and this may also include small shrubs |
| Bare land | Sloppy rocks and bare lands either due to over grazing and erosion |
Table 2: Assigned land use and land cover classes analyzed.
Accuracy assessment
Accuracy assessment for individual classification is essential to correct and efficient analysis of Land use land cover change. Thus, the error matrix was used to assess the mapping accuracy. Accuracy assessment indicates the degree of deference between classified images and reference data.
Land use land cover change detection
After classification, the data were imported in Arc GIS software for post-classification overlay, to map the patterns and extent of land use and land cover in the study area. A pixel-based comparison was used to produce change information on pixel basis and thus, interpret the changes more efficiently. The digital data obtained from the satellite images was processed and supplemented with data from published works conducted in the park area and in the central rift valley area in general.
Normalized vegetation value index generation to support LULC change classification
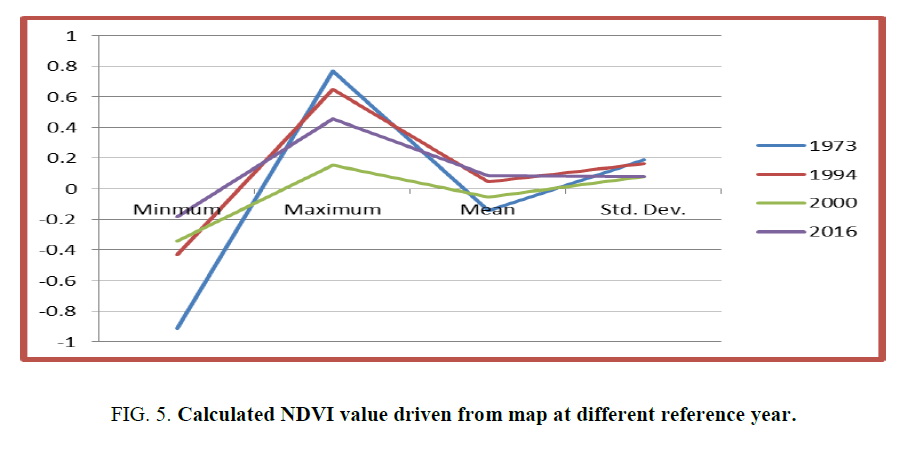
The Normalized Difference Vegetation Index (NDVI) map and value was performed to support the classification because this vegetation index is successful to show the vegetation health and their abundance and distribution, degradation status and coverage [14]. It has been widely employed to describe the spatiotemporal characteristics of land use land cover, including percent vegetation coverage [15].
We produced a map in ERDAS imagine by using NDVI tool which used the above formula to produce the output, then we imported the map into Arc GIS software for further calculation of mean, standard deviation, maximum and minimum value.
According to Rouse et al., [16], NDVI value calculated by simple mathematical combination of two bands namely near infrared and visible band of the image was used. the formula of NDVI expressed as follow;
NDVI = (NIR – VIS) / (NIR + VIS) …………………………………………. (eq.1)
Where: NDVI = Normalized Difference Vegetation Index
NIR = near infrared band
VIS = visible (red) band
Results and Discussion
Land use land cover dynamics detection
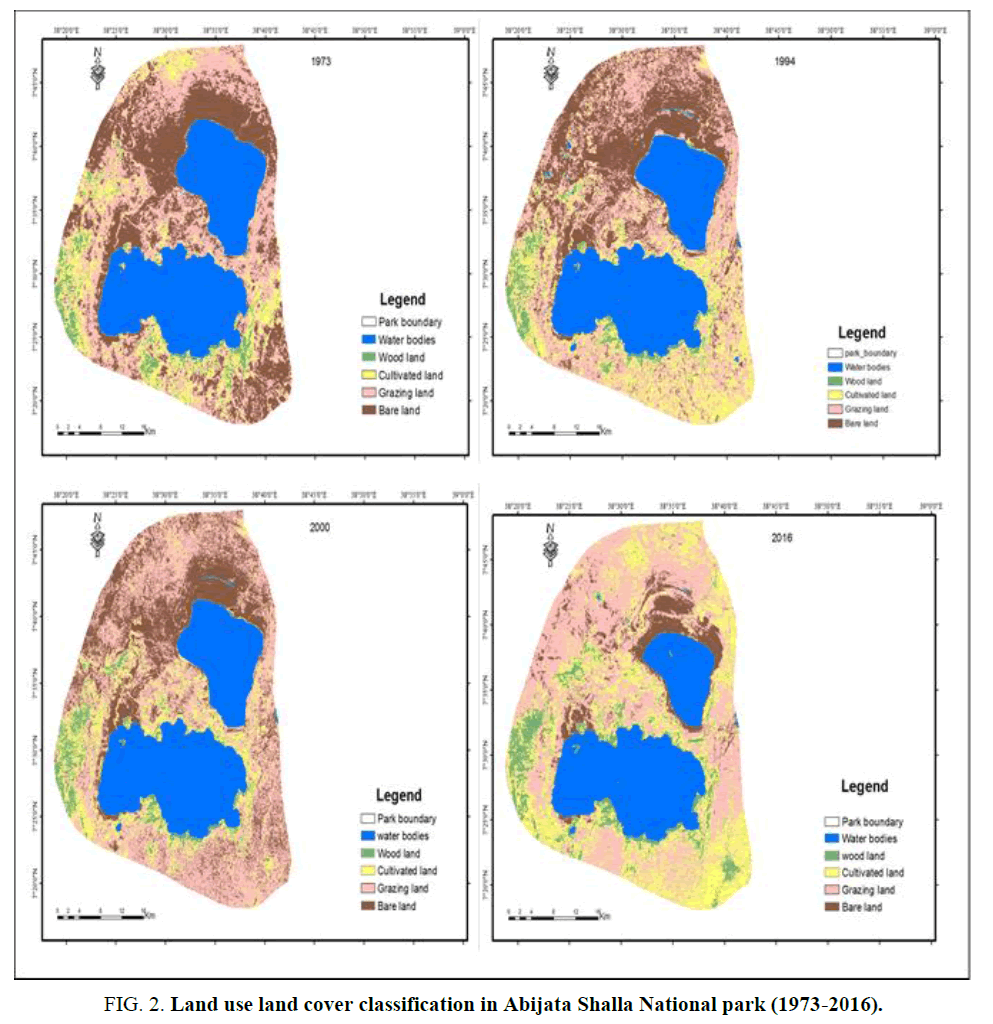
The spatial and temporal land use and land cover change detected for the time lines considered are presented in Table 3 and 4 and Figure 2. During the first period of assessment (i.e., 1973-1994), the largest portion of the park was covered by water bodies with the percentage of 32%, 39% respectively, but in the second period (2000-2016) the largest portion is s taken by grazing land (31%) followed by water bodies (22%). The area of the Acacia woodland in all period, wood land occupied the lowest part of the park as compared to the other LULC classes by 11% in 1973, 8% in 1994,4% in 2000 and 2% in 2016 (Table 3 and Figure 2).
| Land use class | 1973 | 1994 | 2000 | 2016 | ||||
|---|---|---|---|---|---|---|---|---|
| km2 | % | km2 | % | km2 | % | km2 | % | |
| Water bodies | 665 | 37 | 570 | 32 | 699 | 39 | 387 | 22 |
| Wood land | 199 | 11 | 137 | 8 | 81 | 4 | 40 | 2 |
| Cultivated land | 199 | 11 | 295 | 16 | 134 | 7 | 466 | 26 |
| Grazing land | 301 | 17 | 380 | 21 | 458 | 26 | 554 | 31 |
| Bare land | 429 | 24 | 410 | 23 | 420 | 23 | 345 | 19 |
| Total | 1793 | 100 | 1793 | 100 | 1793 | 100 | 1793 | 100 |
Table 3: Change in land use types over time (area in sq. km and percentage).
Table 4 below, revealed that the negative and positive change of each classes in three periods (1973-1994 (first period), 1994-2000(second period) and 2000-2016(third period). In the first period, water bodies, wood land and bare land decrease by 5.29%, 3.46% and 1.02% respectively, while cultivated land and grazing land increase by 5.35% and 4.42%. In the second period, water bodies, grazing land and bare land increase by 7.19%, 4.35% and 0.56% respectively. On the other hand, wood land and cultivated land decrease by 3.15% and 8.96% respectively. In the third period, water bodies, wood land and bare land decrease by 17.4%, 2.24% and 4.17%, Whereas, cultivated land and grazing land increase by 18.51% and 5.32%, respectively.
| Class Name | Change (%) | ||
|---|---|---|---|
| 1973-1994 | 1994-2000 | 2000-2016 | |
| Water bodies | -5.29 | 7.19 | -17.4 |
| Wood land | -3.46 | -3.15 | -2.24 |
| Cultivated land | 5.35 | -8.96 | 18.51 |
| Grazing land | 4.42 | 4.35 | 5.32 |
| Bare land | -1.02 | 0.56 | -4.17 |
Table 4: Trend of land use land cover change in different period.
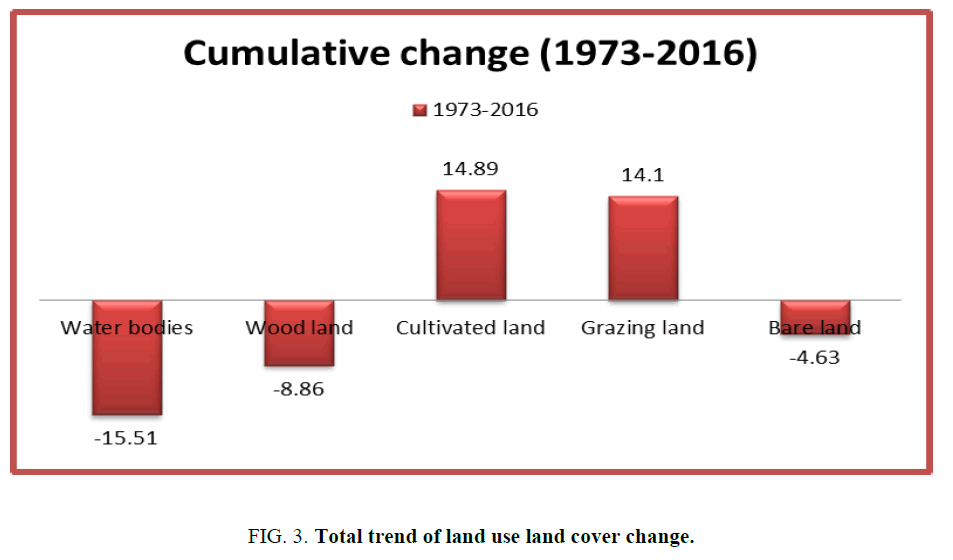
The cumulative change trend from 1973 to 2016 shows that cultivate land and grazing land increase by 14.89% and 14.1% respectively, while water bodies and the acacia wood land areas decreased by 15.51% and 8.86% respectively (Figure 3).
Normalized difference vegetation index map and calculated value
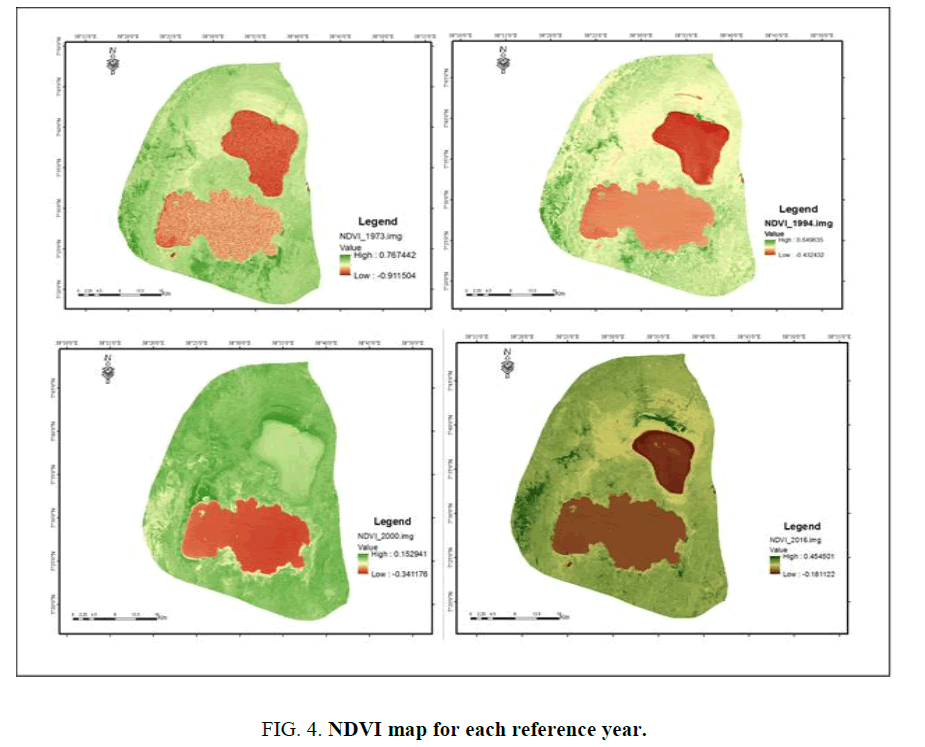
As shown in Figure 5 below, the calculated NDVI value revealed that in 1973, the maximum value for vegetation cover was 76%, which is the highest value from other reference year and in 2000, the maximum canopy coverage was 15%, which is the lowest value from the reference year Similarly, in Figure 4 below revealed that in 2000 map, the park is really under severe degradation, even the water body reflection is changed (lake Abijata) and differ from lake Shalla.
Discussion
Land use land cover and its dynamics
The decreasing trend of water bodies during much of the first and third periods might be due to several factors. First, water abstraction by soda ash factory, NACID [17] indicated that the factory abstracts 5 million m3 of water annually, which is 1% of the amount of water lost from the lake due to natural evaporation. A clear evidence of the effect of this factory on the lake started to be seen since 1985, when the lake began to decline in depth, level, volume, and surface area. According to Gemechu [18], the inflow from lake Ziway reduced mainly since 1994. The increment (7.19%) is might be due to high erosion in the surrounding as a result of vegetation cover reduction. This result supported by Temesgen et al. [9]; Muzein [12].
Secondly, there has been tremendous reduction in the inflow of Bulbula River due to wide intensified irrigation farming by the horticulture and floriculture project installed on the Ziway lake, which is the source of River Bulbula. There was proliferation of the green house floriculture companies and horticulture associations on the banks of Lake Ziway and Bulbula river over the past decade which was very much encouraged as source of employment and foreign currency earner. Among other environmental pollution effects such as pesticides and heavy metal contamination for the water bodies, it severely affected the water volume of the terminal Lake Abijata. To this can be added increasing demands for water by ever increasing livestock population and intermittent drought and climate change that are the characteristic feature of the semi-arid ecology of the rift valley. According Gemechu [18], Abijata soda Ash Factory, inflow from Lake Ziway has diminished from 220 mcm (million cubic meter) to 60 million cm resulting in reduced inflows to the lake in 1994 and the year that followed.
In the same manner, the area of the acacia dominated woodland has decreased from 11.1% in 1973 to 2.25% in 2016. The causal factors for the loss of the woodland area are related to clearance for cultivation (shifting cultivation) and charcoal making, Previous study in the area suggested that woody vegetation decreased sharply between 1986 and 2000, in the Great Rift Valley lakes region in general, strongly [19]. This is a period when the large army of the military government was disbanded following the fall of the socialist regime and charcoal making was seen as easy means for making a living for disbanded soldiers. During the last days of the Dergue regime, and for some time afterwards, large numbers of nomads took advantage of the weakened central authority and moved into the Park to set up residence with their livestock. This was part of the bitterness and resentment of the communities against the government who initially dispossessed the prime grazing lands of the agro-pastoral populations in the area without proper consultation or compensation. In resentment, the communities cleared, much of the Acacia woodland surrounding Lake Abijata has for charcoal production.
On the contrary, cultivated land area increased considerably during the timelines under investigation. The peak increase was during 2016, the reasons are clear as highlight above and include settled cultivation of within the core park area by migrant communities as well as resenting nearby communities particularly following the fall of the Dergue regime (i.e., 1994-2000). This increase might be due to the expansion of farming practice in the park. Similar report presented by Gemechu [18], Shift their livelihood system from animal husbandry to crop production. Tafesse [1], also prove the expansion of farm land in the park. Decreasing cultivation practice might be the degradation of the land in that period.
In the same vein, grazing area expanded from 1973 to 2016 during in all periods, grazing land increases. Again, this is reflection of settlement of farmers and agro-pastoralists with their cattle inside the park area. Currently, there are about 181,168 during the dry season and 134,584 during the wet season livestock grazing in the core park area [20]. This may be due to increasing cattle rearing to support increasing population and decrease productivity of land for cultivation. Tafesse [1], pointed out that grazing diminishes the biodiversity in the park. According to Gemechu [18], the productivity of the land reduced from time to time. Therefore, community depends on animal husbandry. Grazing animals influence species composition, change in biomass and distribution of biodiversity. Despite this, the overuse by grazing of protected areas could result in irreversible vegetation changes [21].
Bare land decreases in first and third period by 1. 02% and 4.14% respectively, and increased in the second period by 0.56%. The decreasing trend might be due to an expansion of settlement and cultivation. The increasing trend might be due to increasing runoff result more bare and degraded land in this period.
The cumulative result revealed that the park is highly encroached by cultivation and grazing and the water bodies are extremely reduced in the past decades. These total significant changes might be due to illegal settlement and population pressure which related with increasing deforestation, overgrazing, charcoal making, industrial activities inside the park and change in administrative power which result in policy gap. Before Dergue regime, there was only low interaction between people and the park. Few landlords owned the land and it was their responsibility to regulate resources usage. When the military government came to power, they forced strict exclusion of people from the park area, which created levels of resentment that are still running high. In fact, this administration policy was driven more by political imperatives than by biodiversity conservation objectives. The current federal system has no clear policy on administration and management of protected lands [12].
The impact of land use land cover dynamics on biodiversity
Different studies reported that there is significant human intervention which result in changes land use land cover over the past decades in Central Ethiopia Rift Valley [8,22,23]. This change in turn, results in loss of biodiversity in the park. According to IBA [11], the park is one of IBAs (Important Bird and Biodiversity Areas) in danger sites, which are priority sites for immediate action Among the globally threatened species known from the park are: Aquila heliaca (a rare passage migrant); Falco naumanni (an uncommon passage migrant with a few wintering); Circus macrourus (fairly common passage migrant, with a few wintering); and Acrocephalus griseldis (status unknown). In addition, the park historically known abundant species including Oryx, Swayne’s Hartebeest, Buffalo, Water buck, Giraffe, and lion have been exterminated and are replaced by other species like Grant’s gazelle, colobus monkey, warthog, great kudu, klipspringer, oribi and Jackal [5]. These species are rare nowadays and there are only exceptional sights if one ever sees them at all. Kumssa and Bekele [20], also reported that the biodiversity of the park is decline.
According to Reaugh-Flower [3], the main issues with regard to biodiversity include: mammal population decline with local extinction, decline bird population, fish population close to zero, and diminished tree cover. Fish population and diversity reduced due to reduced downstream flow from Meki river, to Lake Ziway and finally to Lake Abijata. Apparently, the number of pelican birds is decreasing because of decreasing the fish population at Lake Abijata, affected by Soda Ash factory, which is situated at the shore. The lake water is polluted causing loss of algae on which fish feeds. As a result, the Pelicans that feed on the fish migrated.
In general, the park land use land cover dynamics indicate that there are different human induced factors which affect the status of the biodiversity in the park. Similar result was reported in Awash national park [24] and Nech Sar national park [25].
Conclusion
The land use is continually changing, leading to expansion of cultivated and grazing lands and reduction of water body in the core park area due to different anthropogenic interventions such as illegal settlement, water abstraction for industrial activity. Currently, the lakes are also changing not only in volume but also in quality as result of chemical pollution produced by the irrigated commercial agriculture. The contamination and reduction of the water bodies is resulting in the changes in physico-chemical and biological variables have changed and even some organisms have vanished. After 2000, the level of Lake Abijata is lowering at unprecedented manner. As a result, both aquatic and terrestrial biodiversity is declining such as vegetation, animal, birds, and fishes. All these and other problems clearly indicate the necessity for collaborative management of the park and its resources especially Abijata and Shalla Lakes and their tributaries. Therefore, the park calls critical attention otherwise it may dry out like lake Alamaya.
Recommendations
Since, there are dynamics of land use, which seriously affect the park, there, should be proper management strategy such as proper demarcation and avoid human interference, improve the livelihood of the community, shifting to green economy and implementation to rehabilitate. Awareness creation Training and capacity building is also important for Park staffs to create an understanding about the role of communities and stakeholder involvement in park management that increases stewardship by the community. Involvement of local people in the planning and implementing integrated water, grazing, and forest management and monitoring programs. Strengthen the capacity of institutions involving in park management by directing the revenue from the tourist industry to the wildlife/tourism authority and park management. Conducting environmental impact assessment (EIA) for development activities inside or outside the national park and monitoring and follow up for the implementation of the recommendations.
Abbreviations
EIA: Environmental Impact Assessment
GIS: Geographic Information System
IBAs: Important Bird and Biodiversity Areas
LULC: Land Use and Land Cover
NDVI: Normalized Difference Vegetation Index
USGS: United States Geographical Society
Declarations
The authors declare that they have no competing interests.
Acknowledgement
We would like to acknowledge Dr. Eyasu Elias for his technical support.
References
- Tafesse KE. Integrated assessment of ecosystem services and stakeholder analysis of Abijata-Shalla Lakes National Park, Ethiopia. MSc Thesis, Wageningen University. 2008.
- Young J. Ethiopian Protected Areas A ‘Snapshot’. A reference guide future strategic planning and project funding. 2012.
- Reaugh-Flower K. Abijata-Shalla Lakes National Park. Assessment of factors driving environmental change for management decision-making. Report to the Ethiopian wildlife conservation authority’s sustainable development of the protected area system of Ethiopia program 81. 2011.
- Gebremedehin S, Mequanint F. Contribution of local community for Ecotourism Development in and around Abijata Shalla Lakes National Park with emphasis to women’s role, Ethiopia. Australas J Soc Sci. 2015;1(1):1-19.
- Fekadu T, Rezenom A. Conservation and management issues of Abijata-Shalla Lakes National Park. Unpublished park office document. Oromia natural resource conservation and environmental protection. 2002
- Hengsdijk H, Jansen H. Agricultural development in the Central Ethiopian Rift valley: A desk-study on water-related issues and knowledge to support a policy dialogue, Plant Research International B.V., Wageningen. 2006;22:28-36.
- EWNHS (Ethiopian Wildlife Natural History Society). Important bird areas of Ethiopia. Addis Ababa, Ethiopia: Ethiopian Wildlife Conservation Society. 2002.
- Abdi M. The impact of human activity on the Abijata Shalla Lakes National Park Ecosystem. MSc. Thesis, Agricultural University of Norway, Oslo, 1:1-75. 1993.
- Temesgen H, Nyssen J, Zenebe A, et al. Ecological succession, and land use changes in a lake retreat area (Main Ethiopian Rift Valley). J Arid Environ. 2013;91:53-60.
- Ayenew T. Environmental implications of changes in the levels of lakes in the Ethiopian Rift since 1970. Reg Environ Change. 2004;4(4):192-204.
- Bird Life International. Conserving nature, improving lives: Lessons Learnt from Bird Life International’s Improving Livelihood Projects. Bird Life International Africa Partnership. 2012.
- Muzein BS. Remote Sensing & GIS for Land Cover/ Land Use Change Detection and Analysis in the Semi Natural Ecosystems and Agriculture Landscapes of the Central Ethiopian Rift Valley. PhD Thesis, Institute of Photogrammetry and Remote Sensing, Technology University of Dresden, Dresden. 180 p. 2006.
- Fekadu T, Fekadu B. Indigenous claims and conflicts in managing the Abijata Shalla Lakes National Park, Ethiopia. Int J Biodiver Sci. 2014;10(3): 216-27.
- Pettorelli N, Vik JO, Mysterud A, et al. Using the satellite-derived NDVI to assess ecological responses to environmental change. Trends Ecol Evol. 2006;20(1): 1-11.
- Kaufmann RK, Zhou LM, Myneni RB, et al. The effect of vegetation on surface temperature: A Statistical analysis of NDVI and climate data. Geophys. Res Lett. 2003;30(22):21-47.
- Rouse JW, Haas RH, Schell JA, et al. Monitoring the vernal advancements and retrogradation (greenwave effect) of nature vegetation. NASA/GSFC, Final Report. Greenbelt, MD, NASA. 1974.
- NACID-Nazareth children Center and Integrated Development. Program for wetland management in Abijiata-shalla Lakes area. 2005.
- Gemechu BD. The Challenges and Opportunities of Wetlands Management in Ethiopia: The case of Abijiata Lake Wetlands. MSc thesis, Addis Ababa University. Unpblished. 2010
- Habtamu H, Nyssen J, Zenebe A, et al. Ecological succession, and land use changes in a lake retreat area (Main Ethiopian Rift Valley). J Arid Environ. 2013;91:53-60.
- Kumssa T, Bekele A. Attitude and perceptions of local residents toward the protected area of Abijata-Shalla Lakes National Park (ASLNP), Ethiopia. J Ecosys Ecograph 2014;4(1):138.
- Van de Koppel JM, Rietkerk F, Van Langevelde L, et al. Spatial heterogeneity, and irreversible vegetation change in semi-arid grazing systems. J Am Nat. 2002;159(2):209-18.
- Senbeta F, Tefrea F. Environmental crises in Abijata Shalla Lakes National Park. Walia. 2002;22:28-36.
- Mengesha G, Sahale K, Bekle M, et al. Alternative approaches to managing conflict over the natural resources. The case of Abijata-Shalla Lakes National Park. In: Tolera M, Lemenih M, Ellis FJ, edtors. Development–Oriented Interdisciplinary Thematic Action Research (DOIT-AR). Hawassa University, Wondo Genet College, Wondo Genet.1-48 p. 2009.
- Belay S, Amsalu A, Abebe E. Land Use and Land Cover Changes in Awash National Park, Ethiopia: Impact of Decentralization on the Use and Management of Resources. Open J Ecol. 2014;4(15):950-60.
- Fetene A, Hilker T, Yeshitela K, et al. Detecting Trends in Land use and Landcover Change of NechSar National Park, Ethiopia. J Environ Manage. 2016;57(1):137-47.
