The Silver Tsunami: Which Areas will be Flooded with Homes once Boomers Start Leaving Them?
Over the next 20 years, more than a quarter (27.4 percent) of the nation’s currently owner-occupied homes are likely to hit the market.

Over the next 20 years, more than a quarter (27.4 percent) of the nation’s currently owner-occupied homes are likely to hit the market.
The massive Baby Boomer generation has already begun aging into retirement, and will begin passing away in large numbers in coming decades – releasing a flood of currently owner-occupied homes that could hit the market. That could help end the last few years’ inventory drought, as well as a more fundamental shortage of homes in certain places.
This Silver Tsunami of homes coming to market could be a good substitute for new home construction, which has been in short supply for the past decade in large part because of difficult-to-overcome challenges faced by builders.
Currently, 33.9 percent of owner-occupied U.S. homes are owned by residents aged 60 or older, and 55.2 percent by residents aged 50 or older. As these households age and begin vacating housing, that could represent upwards of 20 million homes hitting the market through the mid-2030s.
But while virtually all areas will feel the effects to some degree, this wave won’t hit all at once and won’t strike all markets equally. Certain markets will be more impacted than others, as will certain kinds of areas within a given market.
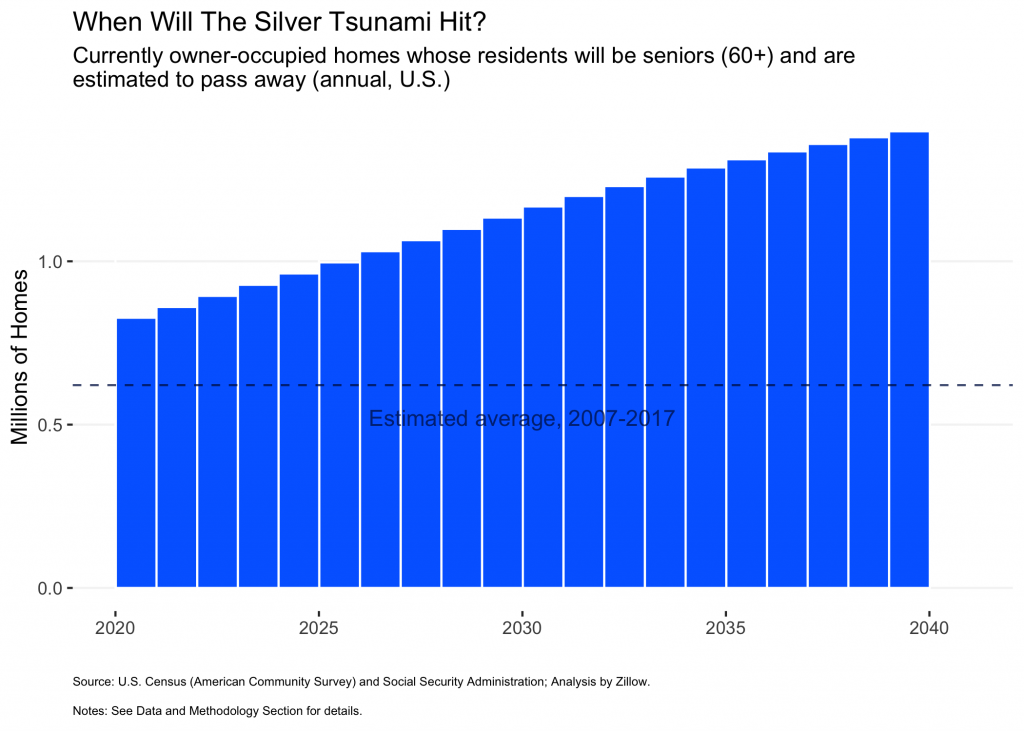
An estimate based on mortality data suggests that the Silver Tsunami will hit in earnest as the number of seniors aged 60 or older who pass away each year rises during the 2020s and 2030s. An alternate estimate using data on recent homeownership trends by age and cohort suggests that homes released by 2027 will comprise about one-in-eight (12 percent) of today’s owner-occupied housing stock,[1] and that by 2037 that share will more than double to 27.4 percent.
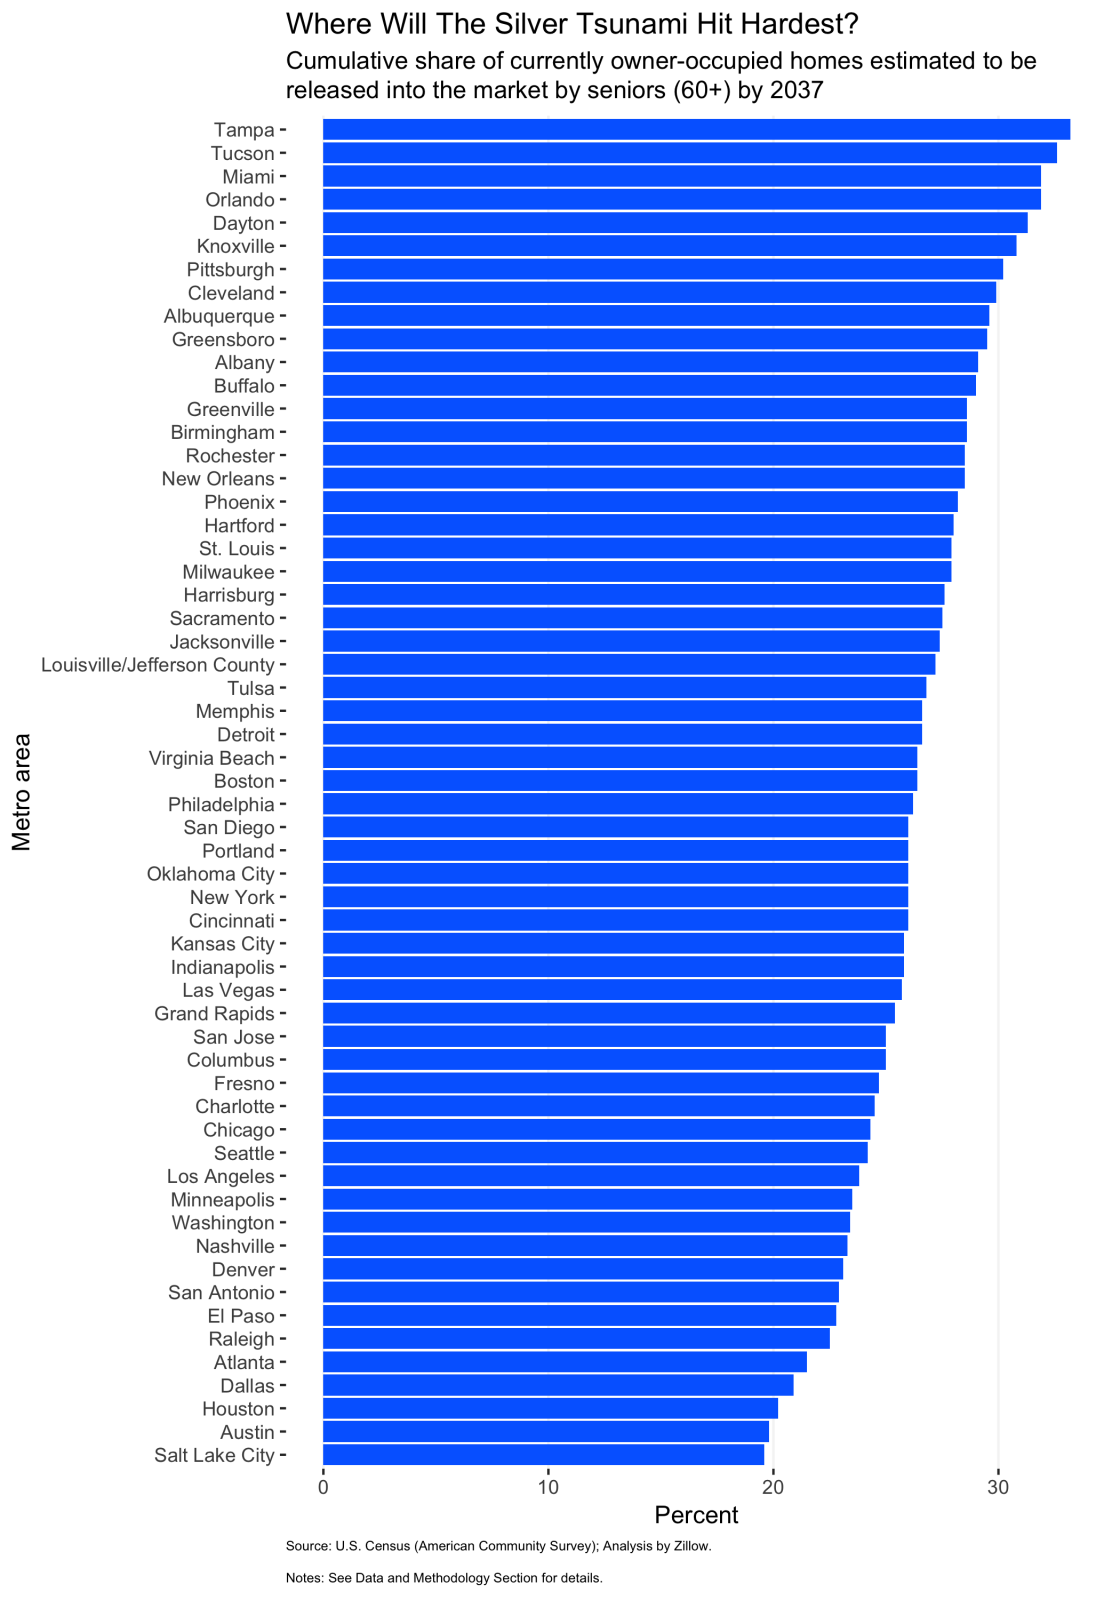
The Silver Tsunami will strike nationwide, impacting between one-fifth and one-third of the current owner-occupied housing stock in every metro analyzed.
Well-known retirement destinations, including Miami, Orlando, Tampa and Tucson, will experience the most housing turnover in the wake of the Silver Tsunami. If the number of future retirees choosing to make these places home during their golden years fails to match generations past and local housing demand fades, these areas may end up with excess housing.
Download the metro area statistics here
Regions including Cleveland, Dayton, Knoxville and Pittsburgh are also more likely to see bigger effects from the Silver Tsunami. Younger residents have tended to leave these areas in recent decades, in many cases pursuing better job opportunities elsewhere, leaving older generations to make up a larger share of those who remain.
And some regions will see smaller-than-typical shares of the owner-occupied housing stock released. These include Salt Lake City (where fewer than one-in-five householders (18%) is 55 or older, compared to 28% nationwide), Atlanta, Austin, Dallas and Houston – all of which tend to be fast-growing and relatively affordable. Because they are both economically vibrant and largely willing and able to expand their developed footprints, these metros offer an affordable alternative to expensive coastal cities. The expensive coastal cities are also attractive to many residents, but they impose burdensome housing costs – especially to younger residents just starting out. In contrast, cheap but vibrant areas generally tend to attract the young and have a younger age distribution as a result, reducing their exposure to the Silver Tsunami.
Select a metro area:
Download the local area statistics as well as their national and metro-specific rankings here
Still, the differences in the share of homes released by seniors between metros are small compared to the differences within them. The most-impacted areas within a given region often contain formally-defined or informal-but-de-facto retirement communities, typically on the fringes of larger metro areas in locations rich with second homes (and former second homes turned primary residence in retirement). Examples include Palm Springs, east of Los Angeles; The Hamptons, at the far eastern end of Long Island in New York; and the island of Nantucket off the coast of Cape Cod, southeast of Boston.
But in many cases, the most-impacted areas appear to be pricey, relatively exclusive enclaves of older residents within otherwise mixed surroundings, including the Upper East Side in Manhattan and the Lafayette-Orinda-Walnut Creek area east of San Francisco. These areas have been more affluent and expensive compared to their surroundings for decades, which has made them less affordable to the young. Younger, more-affordable neighborhoods are likely to have a younger mix of residents and can therefore expect to be less impacted by the Silver Tsunami.
Unlike popular retirement communities that may suffer from a dearth of housing demand down the line, these older, long-affluent enclaves may see more demand pour in from neighboring areas and more residents churn when the Silver Tsunami brings more homes on the market.
The release of older residents’ homes into the market adds net supply to the market, similar to new construction (most existing home sales involve a seller who is almost simultaneously also a buyer, contributing to both the supply and demand for housing).[2] That is important because new construction has failed to return to its historical production levels in the years following the Great Recession, and home builders face challenges that are likely to endure for a long period. These include construction labor issues and difficulties accessing capital, as well as issues related to the shift in demand towards locations closer to the metropolitan core – where vacant lots are scarce and re-development is more constrained than ever.
New home construction activity skews towards the metropolitan periphery. But much of the existing housing set to be released by seniors in coming decades is better-located to meet growing demand for living closer to the center.
Finally, more homes coming onto the market in high-demand areas – if combined with local changes to land-use policy that allow for more density – could spur more construction of small- and mid-sized multi-unit properties by providing developers more opportunities to acquire lots (and by making it easier to assemble them into larger ones).
In the decade from 2007 to 2017, roughly 730,000 U.S. homes were released into the market each year by seniors aged 60 or older. From 2017 to 2027 and from 2027 to 2037 that number is set to rise to 920,000 and 1.17 million per year, respectively, an addition of about 440,000 homes annually by the second decade.
There is no doubt the Silver Tsunami will substantially boost the supply of housing. But will that be enough to counteract rates of new construction that are currently low in historical terms? New homes peaked at 1.28 million sales per year in 2005 and hit bottom in 2011 at 310,000 new homes sold, a difference of almost 1 million per year (in 2018, it clocked in at 620,000 – double recent lows, but still well off peak levels). A swing of that magnitude is larger than the Silver Tsunami’s boost of 440,000 homes per year.
But because the Silver Tsunami’s boost to the housing supply will be sustained over the course of several decades, rather than the sometimes-sharp year-to-year fluctuations in new home construction, it makes more sense to compare longer time periods. From 2000-2009, spanning the last decade’s housing boom and the early years of the subsequent bust, an average of 900,000 new homes were sold each year. Between 2009 and 2018, spanning the bulk of the bust and most of the sluggish recovery that followed, there were only 450,000 new home sales per year, on average. The difference of 450,000 new home sales per year is comparable in magnitude to the Silver Tsunami’s boost.
The Silver Tsunami will boost the supply of housing on a magnitude comparable to the fluctuations that new home construction experienced in the 2000s boom-bust cycle. Of course, whether that means there will be a glut or a continued shortage of housing depends on how new construction fares and, crucially, on future demand for housing. Whether housing released by the Silver Tsunami is appropriately located, priced and to meet future demand could be an important issue as well.
What seems most likely amid all the uncertainty is that, in the coming two decades, the construction industry will need to place a greater emphasis than before on updating existing properties, in addition to building new ones. The construction industry may be bracing for a tsunami of old-new housing supply that crowds out new development, but renovation could be where the real silver is at.
Notes:
[1] The year 2027 was chosen because it is one decade on from the most recent owner-occupied housing number available from the 2017 American Community Survey.
[2] The sale of older residents’ homes as well as newly-built ones also have a disproportionate, positive effect on the volume of home sales, because they set off vacancy chains in which their buyer often turns around to sell their old home, whose buyer does the same. Estimates with respect to new construction indicate that on average every new home built corresponds to 2.43 home sales, i.e. the new home plus 1.43 existing home sales of those moving along the chain. Houses released by seniors are likely to do the same.
Data and methodology:
The number of owner-occupied homes whose residents will be over 60 and pass each year is estimated using a mortality-based approach:
The number of owner-occupied homes to be released into the market by residents aged 60 or more is estimated with an owner-occupancy retention-based approach:
Both approaches are conservative in that they assign households’ death hazards (mortality-based approach) or cohort (owner-occupancy retention-based approach) based on the member with the longest expected remaining lifespan or the youngest member (over age 25), respectively. Both these assignments are both likely to influence the resulting estimates. Inasmuch as the householder tends to be the oldest member of the household, these choices are likely to reduce estimates. Whether a home is in fact likelier have its residents pass and/or be released into the market when the oldest adult—typically the householder—or the youngest adult—typically the spouse—passes, is unclear. Using the householder’s age is no more and no less correct than the alternative assignment used here. The matter becomes more complex when the youngest adult is not the householder or their spouse, but a member of another generation. In such cases, the family relationship between household members and their choices after inheritance, for example, are also not clear.
Metro-level estimates of the cumulative number of owner-occupied homes whose residents will be over 60 and pass by 2037 using the mortality-based approach and metro-level estimates of the cumulative number homes released into the market by residents aged 60 or more by 2037 using the owner-occupancy retention-based approach differ. The former tends to be lower than the latter because households often exit owner-occupancy prior to passing. However, the estimates are very similar in terms of the ranking of metro areas, having a correlation of 0.87.
The metro areas referenced in estimates and maps are Combined Statistical Areas (CSAs) where applicable, and Core-Based Statistical Areas (CBSAs) elsewhere. The list of metro areas is limited to those with population greater than 1 million as of the 2010 Census.
New home sale numbers are drawn from the U.S. Census’ new residential sales series (C25), obtained via Moody’s economy.com service.
