

Abstract
In much of the industrialised world, policy interventions to address the challenges of wide-spread air pollution as resulting from development and economic progress in the 2nd half of the 20th century have overall led to reductions in air pollution levels and related health effects since the 1970s. While overall improvements towards reducing health effects from ambient air pollution are recorded, comprehensive and consistent assessments of the long-term impact of policy interventions are still scarce. In this paper, we conduct a model assessment over a 40 year period of air pollution in the UK. In order to correct for the short and longer term variability of meteorological factors contributing to trends in ambient concentrations of priority air pollutants (nitrogen dioxide, sulphur dioxide, fine particulate matter and ozone), we use a fixed meteorological year for all model simulations. Hence, the modelled changes in air pollutant concentrations and related health effects are solely a function of the changes in emissions since 1970. These changes in emissions are primarily driven by policy interventions, ranging from phasing out of specific fuels or substances, to regulating the use of chemicals and driving the development of cleaner, more efficient technologies. Over the 40 year period, UK attributable mortality due to exposure to PM2.5 and NO2 have declined by 56% and 44% respectively, while ozone attributable respiratory mortality increased by 17% over the same period (however, with a slight decrease by 14% between 2000 and 2010).
Export citation and abstract BibTeX RIS

Original content from this work may be used under the terms of the Creative Commons Attribution 3.0 licence. Any further distribution of this work must maintain attribution to the author(s) and the title of the work, journal citation and DOI.
1. Introduction
1.1. Rationale for this paper
Outdoor air pollution presents a major challenge for public health and ranks among the main causes of adverse health effects globally (Lim et al 2012, Cohen et al 2017, Landrigan et al 2017). It is estimated to account for about 4.2 million deaths and to rank 5th worldwide among all risk factors (HEI 2017). Long-term exposure to air pollution reduces life expectancy, mainly due to an increased risk of cardiovascular and respiratory disease and lung cancer, while short-term exposure can as well aggravate respiratory and cardiovascular illness and trigger asthma attacks (RCP 2016). The World Health Organization (WHO) has classified outdoor air pollution as carcinogenic (Loomis et al 2013), and there is emerging evidence of possible links of air pollution with diabetes, obesity, cognitive decline, dementia, and adverse birth outcomes (RCP 2016).
In most industrialised countries, concentrations of air pollutants substantially increased in the first half of the 20th century because of the rise of fossil fuel combustion to satisfy the fast-growing needs for energy and mobility. This was in particular the case for sulphur dioxide (SO2), nitrogen dioxide (NO2), carbon monoxide (CO), particulate matter (both in the form of 'soot', and as defined by PM2.5, the mass concentration of particles with an aerodynamic diameter of <2.5 μm) and non-methane volatile organic compounds (NMVOCs). During recent decades, however, increasingly stringent air pollution control policies, and improved fuels and pollution abatement technology (e.g. introduction of three-way catalytic convertors in cars), have generally resulted in declines in emissions in high-income countries. Consequently, there has been a decline in the concentrations of these air pollutants in most high-income countries. However, for some pollutants the situation is more complex. For example, emissions of NOx and NO2 concentrations did rise with the increase of road transport, until catalytic converters and increasingly stringent emissions standards led to a decoupling of emission trends from transport development. In parallel, concentrations of ground-level ozone (O3), a secondary pollutant formed from chemical reactions between NOx and NMVOCs, have continued rising in many areas. Also, emissions of ammonia (NH3), mainly originating from agriculture, have not been declining substantially and more recently showed signs of a slight increase. NH3 is a precursor to the formation of secondary inorganic aerosols (SIA), a major component of PM2.5 concentrations.
Long-term trends of air pollution and its effects on human and ecosystem health are usually assessed through analysis of time series of measurements collected through regulatory monitoring networks. However, robust and reliable monitoring data have only been available since the 1970s for some air pollutants, and as late as the 1990s for others. In addition, monitoring networks are typically sparse, which is a challenge when using monitoring sites to represent population exposure (Willocks et al 2012). The emergence of earth observation products provides wider spatial coverage (van Donkelaar et al 2015, Pope et al 2018), but observational air quality data, whether ground-based or from remote sensing can only reveal the combined effect of changes in emissions, land use, and meteorological conditions on the formation, transport and environmental fate of pollutants. Atmospheric chemistry transport models (ACTMs) explicitly consider all of these processes, and can be used to forecast as well as to reconstruct historic scenarios. Most model assessments aim to deliver as realistic as possible representations of air pollutant concentrations for the quantification of health effects, including comparison with observations for evaluation purposes. In many cases, complex steps towards data integration are required, as exemplified by the Global Burden of Disease study (Shaddick et al 2018). As a consequence, it is a challenge to disentangle the size of the effect of emissions reductions (as a result of policy implementation) from the inter-annual variability due to meteorological variability (Pope et al 2014, Huang et al 2017). It is information on the effects of emissions reductions on long-term air pollution trends that gives insight on effectiveness of past policies and helps inform future policy development, as for instance presented by EPA (2011), Matus et al (2008, 2012) and Zhang et al (2018) for the USA and China, as well as WHO (2013a, 2013b) with a focus on Europe. Henneman et al (2016) have made a case for the evaluation of policy effectiveness in their review and developed frameworks for accountability studies more generally.
To address this evidence gap, we modelled the effect of four decades of emission reductions across Europe on UK annual mean concentrations of regulated air pollutants and their health impacts at ten-year time intervals of 1970, 1980, 1990, 2000, and 2010. In order to focus on the impact of emission changes brought about by policy measures, all model runs were conducted using the same meteorological input data, varying only the emissions using available historic emission inventory data. To our knowledge, this presents a novel approach and yields a unique insight into the effectiveness of historic emission control policies, and provides a basis for designing ex-ante assessments of future policy interventions.
1.2. AQ trends and policies—a UK perspective
Although Public Health Acts in 1875 and 1926 contained measures to abate emissions of smoke, the first major modern legislation in the UK to focus on mitigation of the harmful effects of air pollution was the 1956 Clean Air Act, introduced in response to the notorious sulphurous 'smog' episodes in London and elsewhere (Brimblecombe 1987, Malley et al 2016) and their impacts on morbidity and mortality (Anderson 2009). Subsequent concern on the effects of air pollution was then predominantly stimulated by the observation during the 1970s of forest dieback ('Waldsterben') and landscape acidification across much of Europe. The implementation of Europe-wide emission control policies therefore initially targeted SO2 emissions from large combustion plants and resulted in a de-coupling of continuing economic growth and SO2 emissions, with the latter showing a very significant downward trend since the 1980s (Vestreng et al 2007). From that time, substantial evidence has also accumulated for wide-spread public health effects associated with emissions of nitrogen oxides (NOx), including their contribution, in combination with emissions of NMVOCs, to the formation of O3, and to the formation of SIA. Consequently, from the 1990s onwards a range of additional pan-European emission control policies (see below) have led to reductions of NOx and NMVOC (and primary PM) emissions (Vestreng et al 2009).
The current UK approach to air quality management is outlined in its National Air Quality Strategy, first developed in 1997, as an outcome of the 1995 Environment Act. Air quality standards regulations set into UK law objectives for the concentrations of a number of air pollutants that are comparable to (or stricter than) those set out in relevant European Union Ambient Air Quality Directives, the most recent of which is Directive 2008/50/EC which replaced a number of previous Directives. Air pollutants with UK air quality objectives include PM10, PM2.5, NO2, O3, SO2, CO, benzene, 1,3-butadiene, polycyclic aromatic hydrocarbons (PAHs) and a number of metals. These standards are based on expert-group considerations of the epidemiological and toxicological evidence for the harmful effects of these pollutants on human health.
A component part of the UK Air Quality Strategy is Local Air Quality Management whereby local authorities are required to assess the air quality in their area. Areas where air quality objectives are not likely to be achieved must be designated as air quality management areas and an action plan to improve the air quality developed. At the national scale, the UK abides by EU Directives and international protocols that aim to reduce exposure to air pollutants through regulation of pollutant emissions from individual point or sector sources, and through a cap on total national emissions of primary pollutants. Examples of the former regulations include emissions from combustion plants, road and off-road vehicles and machinery, and industrial solvent usage, whilst an example of the latter is the National Emissions Ceilings Directive. Actions taken under these regulations have led to substantial reductions in the largest ambient concentrations of most of the pollutants with air quality objectives, particularly the primary pollutants such as organic compounds, metals, CO and SO2. No local air quality management areas in the UK are currently declared due to concern over meeting air quality objectives for these pollutants.
Instead, the two pollutants currently causing the greatest concern in Europe, and for which UK air quality management areas have been declared, are PM2.5 and NO2 (COMEAP 2009, 2010, WHO 2013a, 2013b, RCP 2016). The corresponding objectives are, for PM2.5, an annual mean of 25 μg m−3 and a target to reduce population-weighted average concentrations by 15% between 2010 and 2020, and, for NO2, an annual mean of 40 μg m−3 and an hourly mean of 200 μg m−3 not to be exceeded for more than 18 h per year. (The objective for PM2.5 is more stringent in Scotland than in the rest of the UK.) The UK Committee on the Medical Effects of Air Pollutants (COMEAP) have recently emphasised the strengthening evidence for mortality effects from long-term (i.e. annual average) exposure to NO2 (COMEAP 2018). NO2 concentrations in many urban areas are declining only slowly because road traffic volume is increasing and the share of diesel vehicles in the UK fleet has been increasing over the past decades. The same expert group has also reported on the health effects from exposure to O3 (COMEAP 2015), which is of particular note given the currently rising levels of urban O3 (where the bulk of the population are exposed) due to the slowly decreasing urban NOx emissions. The exposure reduction target for PM2.5 marks the first appearance in legislation of an aim to improve overall population health burden rather than solely to attain a particular target concentration.
1.3. An overview of this study
In this paper, we focus on NO2, PM2.5, SO2 and O3 as pollutants which have been in the spotlight due to their large environmental and public health effects over time. For NO2 and PM2.5, exceedances of current air quality objectives, respectively of WHO guideline values, remain major policy challenges. The considerably higher than pre-industrial level of O3 is also a concern for public health professionals (WHO 2013a, 2013b, COMEAP 2015). Sulphur dioxide was previously a pollutant of major concern. The spatially-resolved modelled pollutant concentrations produced for this paper reflect the four decades of changes in anthropogenic emissions only (i.e. natural sources such as volcanoes were left unchanged for the purpose of the study); all other model parameters (including meteorology and land use) remain constant throughout the model time series. Linking these concentration maps with population data at each 10 year time step to calculate population weighted concentrations, we assess the changes in public health impact due to the change in emissions and concentrations over this time. As the model calculations are based on a constant meteorology year (2015), the health impacts do not match those estimated in any of the specific years. However, this approach allows for a consistent evaluation of the effects of emission reductions on changes to human exposure and health burden over a 40 year period via the effect of those emissions reductions on ambient concentrations of specific air pollutants.
2. Methods
2.1. Emissions data
In order to assess the effect of policies to reduce air pollution, the model required a consistent set of emission data for the whole period. For the UK, anthropogenic emission data as compiled by the National Atmospheric Emissions Inventory (NAEI 2018) were obtained for each of the modelled years (1970, 1980, 1990, 2000 and 2010) based on the 2015 NAEI release (latest available inventory year at the time of this work). The anthropogenic emissions include domestic aviation (i.e. landing and take-off cycles, as well as airport operations) and shipping, but emissions from natural phenomena (wild fires, dust events, volcanoes etc), NOx releases from soil, and biological/natural VOC were set at the 2015 NAEI values. For non-UK emissions, Centre for Emission Inventories and Projections (CEIP 2018) data was used for each corresponding year. For the UK, the 2012 spatial distribution was used and rescaled with the respective national total emissions for each year because historic spatial distributions of national emissions are not available once recalculated national and sectoral total emissions are released, and at the time of conducting the model runs, was the most up-to-date version available. Since these model calculations were undertaken, updated UK and European emission datasets have been released, with some differences between the emissions used in this paper and recalculated emissions for previous years. This is inevitable, as new findings and corrections of emission factors emerge, which are then used to backcast historic emission time series to provide consistent reporting under different national and international requirements. A key change to emission data is a result of corrections to emission factors of some road vehicles following the 2015 'Dieselgate' scandal, where real world emissions from diesel vehicles were underreported by manufacturers due to manipulated testing procedures (e.g. Brand 2016). However, as these recalculations will typically correct errors and are applied consistently to specific sources and sectors, the relative changes in emissions on which our model results are based should not be subject to substantive changes.
Figure 1 illustrates the changes in the national emission estimates of NH3, SO2, NOx, NMVOC and primary PM2.5 at 10 year intervals between 1970 and 2010. SO2 emissions have declined substantially during this period as a consequence of policy regulations aiming to address acid rain in the UK and Europe. Primary PM2.5 emissions have also been effectively reduced in this period. For NOx emissions, the increase in road transport volume offset reductions in other sectors until the early 1990s, when implementation of increasingly stringent EURO vehicle emission standards yielded declines in total NOx emissions. The NMVOC emissions are observed to have reduced only in the latter part of the time period and, overall, the relatively modest reductions in NMVOC and NOx mean there is still substantial contribution to O3 formation. Reductions in NH3 emissions have been very small because very few regulations to date have addressed agricultural emissions—a key contributor to total NH3 emissions in the UK and in Europe. Latest indications suggest a slight increase in NH3 emissions (EEA 2018).
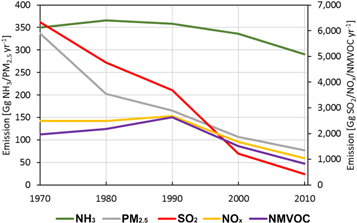
Figure 1. Time series for UK emissions of NH3, SO2, NOx, NMVOC and primary PM2.5 at ten year time steps between 1970 and 2010 as used for ACTM input, from the UK National Atmospheric Emission Inventory (NAEI, naei.beis.gov.uk).
Download figure:
Standard image High-resolution image2.2. Atmospheric chemistry transport modelling
The ACTM EMEP4UK rv4.3 was used for this work and is described in Vieno et al (2016a and 2016b). The EMEP4UK model is a regional application of the EMEP MSC-W model (Simpson et al 2012). The EMEP MSC-W model rv4.3 is freely accessible at https://github.com/metno/emep-ctm/releases/tag/rv4_3. The meteorological data to drive the EMEP4UK ACTM are generated by the Weather and Research Forecast model (WRF). Both the ACTM and WRF model use the same model domain covering Europe at a horizontal resolution of 50 km × 50 km with a nested higher resolution for the UK at a horizontal resolution of 5 km × 5 km.
As described previously, only changes to anthropogenic emissions are incorporated into each historical simulation; all other model parameters, including the meteorological year (2015) for each simulation year, are kept constant. This ensures that changes to modelled concentrations reflect only the trends in anthropogenic emissions. While this does not allow for a direct validation of model outputs against observations, it provides a consistent method to assess the actual changes in ambient modelled concentrations as a function of changes in emission input data.
In-depth information about model setup and validation is provided in suppl. mat. Section S1 is available online at stacks.iop.org/ERL/14/074001/mmedia.
2.3. Health impact assessment
The attributable fraction (AF) of all-cause mortality in the UK associated with PM2.5, NO2 and O3 (AF of respiratory mortality only for O3) for each of the years 1970, 1980, 1990, 2000 and 2010 was calculated as

where RR (relative risk) = β(x/10), β is the concentration-response coefficient for each pollutant (per 10 μg m−3) and x is the population-weighted annual average pollutant concentration. We do not provide an estimate of changes in absolute mortality figures from air pollution, since this would also depend on changes in baseline mortality rates and population sizes over time.
The values of β for estimating the annual attributable mortality from long-term exposure to air pollution used here were based on the UK Committee on the Medical Effects of Air Pollution recommendations. Specifically, the β coefficient for PM2.5 used here was 1.060 (95% CI: 1.04–1.08) (COMEAP 2010), and for NO2 the value of 1.023 (95% CI: 1.008, 1.037) was used (COMEAP 2018). We assumed that there is no threshold for the mortality effects of these two pollutants (i.e. we quantified burdens to zero concentrations).
The mortality estimates presented here are based on quantification using either PM2.5 or NO2 as the primary indicator of the air pollution mixture. The size of the overlap between burdens derived from associations of mortality with NO2 and PM2.5 is unknown, therefore single-pollutant burden estimates, PM2.5 or NO2 in this case, should not be added together as doing so would probably lead to over-estimation of the effects of the air pollution mixture. For O3, despite some evidence for long-term effects, COMEAP do not recommend a β value (COMEAP 2015). Therefore the value used here is the 1.014 (95% CI = 1.005, 1.024) per 10 μg m−3 of the warm season (April–September) average of daily maximum 8 h mean O3 concentration recommended by the WHO Health Risks of Air Pollution in Europe (HRAPIE) project for the effects of long-term exposure to O3 on respiratory mortality, with a cut-off value of 70 μg m−3 (WHO 2013a), although we accept that evidence on the mortality effects associate with long-term exposure to O3 is not conclusive (Atkinson et al 2016).
3. Results
3.1. Trends in air quality 1970–2010
Figure 2 illustrates the modelled concentrations of SO2, NO2, O3 and PM2.5 for the five 10 year snapshots in time. For SO2 and PM2.5, the concentration maps indicate a consistent downward trend over the whole period as observed for emissions of SO2 and primary PM2.5 (figure 1). For NO2, the increase in NOx emissions due to a substantial increase in road transport emissions over the period between 1970 and 1990 is highlighted by a marked increase in NO2 concentrations in urban areas and along the major UK transport corridors. After 1990, NO2 concentrations decline across the whole of the UK. In contrast, concentrations of O3 have seen a steady increase over the 40 year period, with modest increases from 1970 to 1990 but more substantial increases thereafter in the areas where NOx emissions (and consequently NO2 concentrations) decrease most. The modelled trends for O3 are the result of the combination of the emission changes in both NOx and NMVOC, as well as changes in amounts of transboundary transport of O3. The increase in the second half of the study period indicates that in order to achieve a reduction in O3, further substantial reductions in NOx (and NMVOC) emissions would be required across the UK, with O3 formation being increasingly NOx-limited in the UK (i.e. NOx emission control will produce a greater reduction in O3 concentrations, Monks et al 2015).
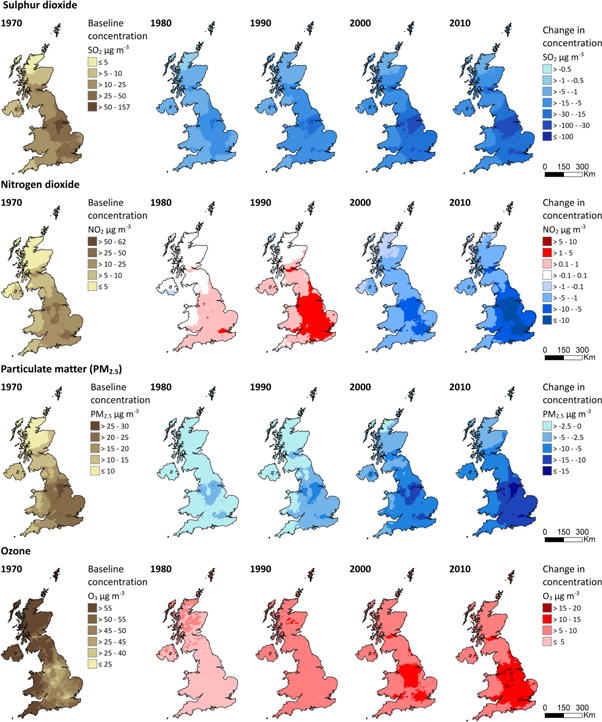
Figure 2. Mapped time series of annual average concentration changes over the study period for SO2, NO2, PM2.5 and O3. The left panel (1970) depicts concentrations in the base year, with the remaining maps in each row illustrating the absolute change in concentrations in μg m−3. Blue indicates decreases and red indicates increases compared to the baseline 1970.
Download figure:
Standard image High-resolution imageThe spatial distribution of concentration changes primarily reflects the main population centres and transport corridors, where emission reductions are predominantly occurring. In the case of PM2.5 concentration changes, the resulting reductions are a combination of UK and European emission reductions, as the formation of SIA (ammonium nitrates and sulphates) over continental Europe has declined due to Europe-wide emission controls over the same period. As a result, advection of secondary PM2.5 to the UK has declined as well, contributing to lower PM2.5 concentrations over the UK. For ground-level ozone, the increase in global background concentrations, in parallel to the reduced destruction of ozone by titration due to decreasing NO2 concentrations act together in showing an increasing trend (Read et al 2008, Yan et al 2018).
Figure 3 illustrates the changes in average, 1st and 99th percentile modelled annual-average concentrations across all model land-based UK grid cells over the study period. For SO2, both high and average annual-average concentrations have substantially declined. High annual-average concentrations of PM2.5 have also consistently declined, with low concentrations showing a slight decrease, and average concentrations having fallen to less than 10 μg m−3 over the period. While average SO2 concentrations show by far the largest reduction at 94%, average PM2.5 concentrations declined by 53%. The situation for NO2 and O3 is more complex, with an increase in 99th percentile annual-average NO2 concentrations until 1990, followed by a steep decline amounting to a total of 48% reduction between 1970 and 2010. 1st and 99th percentiles and annual-average O3 concentrations have increased throughout the period, with the average and high concentrations showing, respectively, a slowing increase and a slight decrease since 1990. Compared to 1970, minimum, average and maximum modelled concentrations of O3 are 72%, 18% and 12% higher in 2010, respectively.

Figure 3. Time series of the average, 1st and 99th percentile modelled annual-average concentrations across all terrestrial cells of the UK for each 10 year time step.
Download figure:
Standard image High-resolution image3.2. Trends in attributable mortality 1970–2010
Figure 4 shows the trends in spatial patterns and magnitudes of population-weighted concentrations for SO2, NO2, PM2.5 and O3 for each 10 year time interval. This illustrates the spatial variability of emission reductions and resulting absolute changes in population weighted concentrations for each pollutant, which provides the base for the assessment of attributable mortality changes over the study period (see suppl. mat. section S2 for a detailed description of the population mapping method applied).
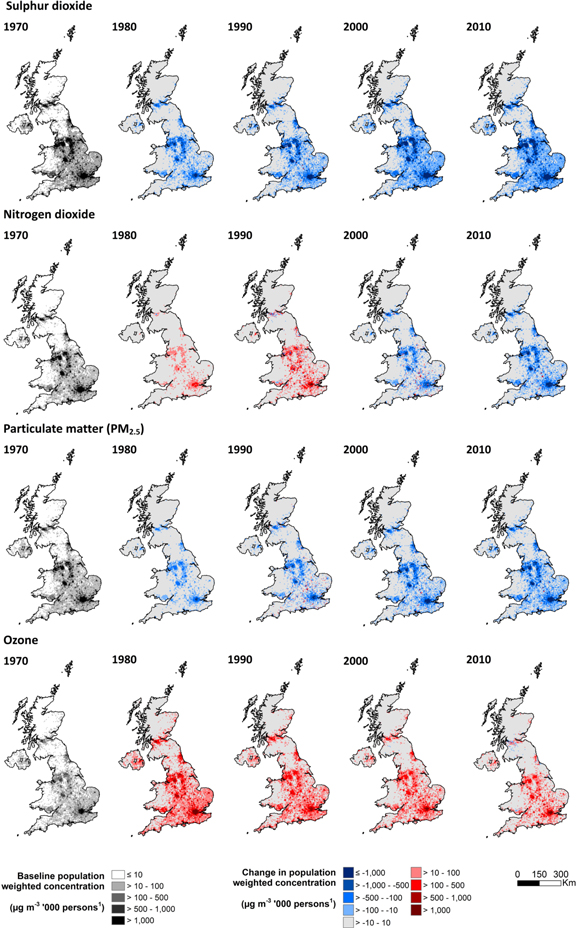
Figure 4. Mapped time series of population-weighted concentration changes over the study period to illustrate changes in population exposure to SO2, NO2, PM2.5 and O3. The left panel (1970) depicts concentrations in the base year, with the remaining maps in each row illustrating the absolute change in concentrations in μg m−3 × 1000 persons. Blue indicates decreases and red indicates increases compared to the baseline 1970. The methodology applied to map Census populations is described in suppl. mat. section S2.
Download figure:
Standard image High-resolution imageEstimates of the UK population-weighted average AF of all-cause mortality for long-term exposure to NO2 and PM2.5 (respiratory mortality for O3) at each time point are shown in table 1 and figure 5. The trends in AF of mortality reflect the spatial integration of the trends in population weighted concentrations shown in figure 4. Over the entire period considered (1970–2010), the population-weighted average AF of mortality for PM2.5 fell by 56%, from 11.83% to 5.21%, and for NO2 it fell by 44%, from 5.32% to 2.96% (table 1). Over the same period, the population-weighted average AF of respiratory mortality due to O3 increased by 17%. However, the AF of mortality for O3 and NO2 effects rose slightly from 1970 to 1990, when they were 2.33% and 5.76%, respectively, and then fell by 2010, with the AF of respiratory mortality for O3 still higher in 2010 than it was in 1970 (figure 5). In contrast, the population-weighted average AF of mortality associated with PM2.5 has declined steadily each 10 year time point, from 11.83% in 1970 to 5.21% in 2010 in the UK.
Table 1. Population-weighted UK average attributable fraction of respiratory mortality associated with long-term exposure to O3, and all-cause mortality associated with long-term exposure to NO2 and PM2.5, for 1970, 1980, 1990, 2000 and 2010.
| AF respiratory mortality (%) | AF all-cause mortality (%) | ||
|---|---|---|---|
| Year | O3 | NO2 | PM2.5 |
| 1970 | 1.51 | 5.32 | 11.83 |
| 1980 | 1.93 | 5.44 | 10.50 |
| 1990 | 2.33 | 5.76 | 9.50 |
| 2000 | 2.06 | 4.19 | 6.90 |
| 2010 | 1.77 | 2.96 | 5.21 |
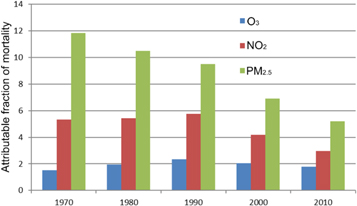
Figure 5. Population-weighted UK average attributable fraction of mortality for O3 (blue), NO2 (red) and PM2.5 (green) for 1970, 1980, 1990, 2000 and 2010.
Download figure:
Standard image High-resolution image4. Discussion
4.1. Implications for policy development
The overarching aim of this study was to simulate how pollutant concentrations, together with an indicator of associated health impacts (AF of mortality), have changed in the UK over the 40 year period 1970–2010 in response to the effect of air quality policies on anthropogenic pollutant emissions. The values and trends presented in section 3 therefore do not represent actual values for a given year because all historical simulations used a common meteorological year. This was a deliberate choice to ensure that inter-annual variability in meteorology did not confound interpretation of the effects of the anthropogenic emissions alone. However, this is the advantage of our modelling approach. Observational trends will show the combined effect of the range of factors that contribute to atmospheric pollutant concentration changes, which makes it challenging to isolate the effect of one factor, in this case emissions, alone. Yet, although the modelling does not specifically simulate the concentrations in a given year, all other aspects of the modelling (although set to be constant for each year of modelling) are based on real meteorological conditions.
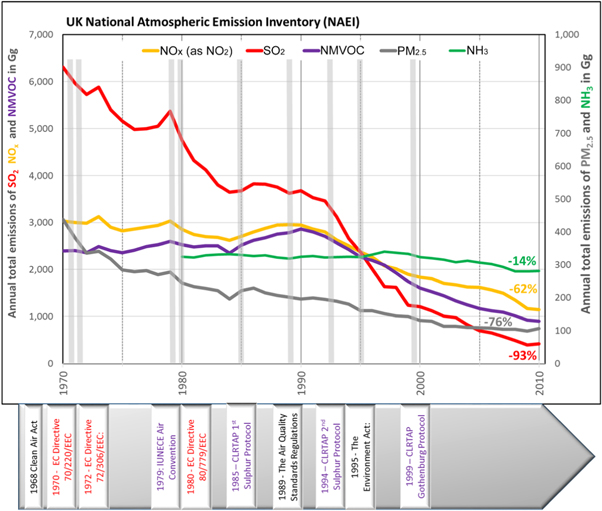
While it is not possible to attribute specific changes in concentrations and associated mortality burdens to individual policies, as their implementations overlap in time and have locally/regionally different effects, figure 6 illustrates when the main UK, EU and UNECE policy interventions aiming at reducing air pollutant emissions entered into force over the investigated time period. For SO2, the 1968 UK Clean Air Act had already set in motion substantial reductions in emissions from coal-fired power plants. The UNECE Air Convention, which originally focused on curbing emissions contributing to the transboundary effects of SO2 emissions on forest dieback, contributed further to a decline in these emissions. Emissions of NOx (and, to a lesser extent, NMVOC) have been affected mainly by EC Directives setting emission limits for petrol and diesel vehicles, including the wide-spread introduction of three-way catalytic converters since the early 1970s. Emissions of PM2.5 have continuously declined due to introduction of UK and EU emissions regulations on both stationary sources (as a prerequisite for effective control of SO2 emissions) and mobile sources (with a focus on diesel exhaust emissions). Emissions of NH3 have declined only moderately since 1980, when the inventory was first compiled, because no UK or pan-European emission control policies have so far achieved substantive reductions of agricultural emissions. The Netherlands and Denmark have unilaterally implemented stringent agricultural NH3 emissions reduction measures, which will have had some impact on the amount of transboundary SIA into the UK.
Figure 6. Timeline of emission changes (based on the UK NAEI) from 1970 to 2010, and of the coming into force of selected air quality legislation in a UK (black), EU (red) and UNECE Air Convention (purple) context. Percentage values show changes in emissions in 2010 with respect to those in 1970 (in 1980 for NH3).
Download figure:
Standard image High-resolution image
As section 3.2 illustrates, public health benefits of emission control policies over the past 40 years have been substantial, with the fraction of all-cause mortality attributable to long-term exposure to both NO2 and PM2.5 showing a marked decline. Emission control regulations by definition can only target emissions of primary pollutants. Hence, the majority of policy interventions which have led to substantive reductions in emissions first targeted large point sources (SO2, PM2.5 and NOx) followed by more distributed point sources, most notably the tailpipe emissions of NOx, NMVOC and PM2.5 from road transport. The trends shown in section 3 indicate the additional challenges associated with a secondary pollutant such as O3. Concentrations of O3, and associated impact on mortality, increased in the early part of the period due to the reduction in NOx emissions and the resulting reduction in the chemical removal of O3 in high-NOx areas. Since the 1990s, however, AF of mortality due to exposure to O3 has started to decline as both NOx and NMVOC emission reductions policies take effect and summer-time O3 levels have declined (AQEG 2009). The decline in O3 in the UK has not been as large as it could have been for the reductions in NOx and NMVOC, because of a slow rise in northern hemisphere background O3 from rising methane, NOx and NMVOC emissions further afield transported into the UK (AQEG 2009). However, mortality attributable to ozone is only calculated based on summer-time O3 levels, therefore trends in mortality may not match annual trends in O3 concentrations.
The emission reductions described could be considered as 'low-hanging fruit', as they have been achieved primarily through command-and-control approaches targeting large industries, either by implementing stringent control measures e.g. in power plants, or requiring type approval at production for large volumes of motor vehicles (AQEG 2004, 2012). The case of ammonia emissions, which show only small variations over the period for which emission data are available, illustrates the challenges of designing and implementing policies for a large number of small, varied sources with a wide range of technological and behavioural aspects (AQEG 2018). Similar challenges should be expected for further emission reductions in source sectors such as residential combustion (AQEG 2017), or through mitigating pollutant emissions through behavioural change (e.g. changing private transport behaviour) (de Nazelle et al 2011, Rojas-Rueda et al 2016, Vardoulakis et al 2018). The influence of European emissions on UK PM2.5 concentrations and the effect of different potential emissions reductions approaches have been discussed in detail by Vieno et al (2014, 2016a and 2016b), respectively.
4.2. Limitations and uncertainties
Although a strength of this modelling study is the elimination of the influence of inter-annual meteorological variability on the time series of spatially-resolved pollutant concentrations, the actual meteorological year selected (2015) may have specific patterns of seasonal effects which differ from a multi-year average. However, as the assessment focuses on the changes in concentrations and health impacts, keeping all other influencing factors constant, the overall results presented in this study are likely not affected by the choice of meteorological year. A detailed discussion of the limitations and uncertainties can be found in section S3 of the suppl. mat.
5. Conclusions
5.1. Effectiveness of AQ policies to reduce public health impacts in the UK
Policies aimed at reducing air pollutant emissions and improving air quality in the UK have been effective in leading to a substantial decline in concentrations of priority air pollutants over the past 40 + years. Consequently, mortality effects due to exposure to air pollution (as quantified by AF of all-cause mortality) have dropped by 44% and 56% for NO2 and PM2.5, respectively between 1970 and 2010. For O3, attributable respiratory mortality in 2010 was 17% higher than it was in 1970, despite a decline by 24% compared to 1990.
These public health benefits cannot easily be attributed to individual policies and represent a mix of European/regional and UK or local interventions, which have all contributed to a decline in emissions over the study period. At the same time, the data illustrates that changes in emissions of NH3 from the agricultural sector in particular have been modest. This is because no stringent policies have so far been implemented for agricultural emissions in the UK, with the observed emissions primarily arising from structural changes in UK animal production.
In addition to the reduction in primary PM2.5 emissions in the UK, European policies leading to a decline in SO2 and NOx (and, to a lesser extent, NH3) emissions have contributed to a decline in ambient concentrations of PM2.5 due to reducing precursors of SIA.
5.2. Pollutant-specific aspects and future challenges
Current UK policies in place and in the pipeline are projected to lead to further reductions in NOx emissions from mobile sources (road transport, shipping, off-road machinery), while at the same time local interventions in the UK such as low-emission zones or clean air zones are expected to contribute to alleviate public health effects by reducing population exposure. Further policy measures are directed at small combustion sources, addressing NOx as well as primary PM2.5 emissions. In the draft national Air Quality Strategy, which is currently under consultation, the UK Department for Food, Environment and Rural Affairs has set out targets for the reduction of NH3 emissions from agriculture, designed to attain the National Emission Ceilings target for 2030 of a 16% reduction compared with 2005 levels. Overall, policies addressing agricultural NH3 emissions are being implemented across Europe, which will likely lead to a marked decrease of contributions to UK PM2.5 from long-range transported SIAs, in particular ammonium nitrate, in the future. Finally, the recent decline in attributable respiratory mortality due to O3 exposure indicates that further additional reductions of precursors in similar ratios would lead to additional benefits. Nonlinear chemistry in O3 production, and the impacts of precursor emissions over hemispheric scales, precludes pronouncements on significant reductions and requires further specific study. This should as well investigate to what extent future policies to address ground-level ozone effects on human health, ecosystems and agricultural crops would require more refined spatial and temporal assessments to identify the most effective control strategies for ozone precursor emissions.
Acknowledgments
This work was supported by the Natural Environment Research Council award number NE/R016429/1 as part of the UK-SCaPE programme delivering National Capability.