Potentially Toxic Planktic and Benthic Cyanobacteria in Slovenian Freshwater Bodies: Detection by Quantitative PCR

 , ,
, ,
Abstract
:1. Introduction
2. Results
2.1. Evaluation of the qPCR Assays
2.1.1. Selection and Specificity of the qPCR Assays
2.1.2. Sensitivity of the qPCR Assays.
2.1.3. Robustness of the qPCR Assays
2.2. Presence of Target Genes in Environmental Samples
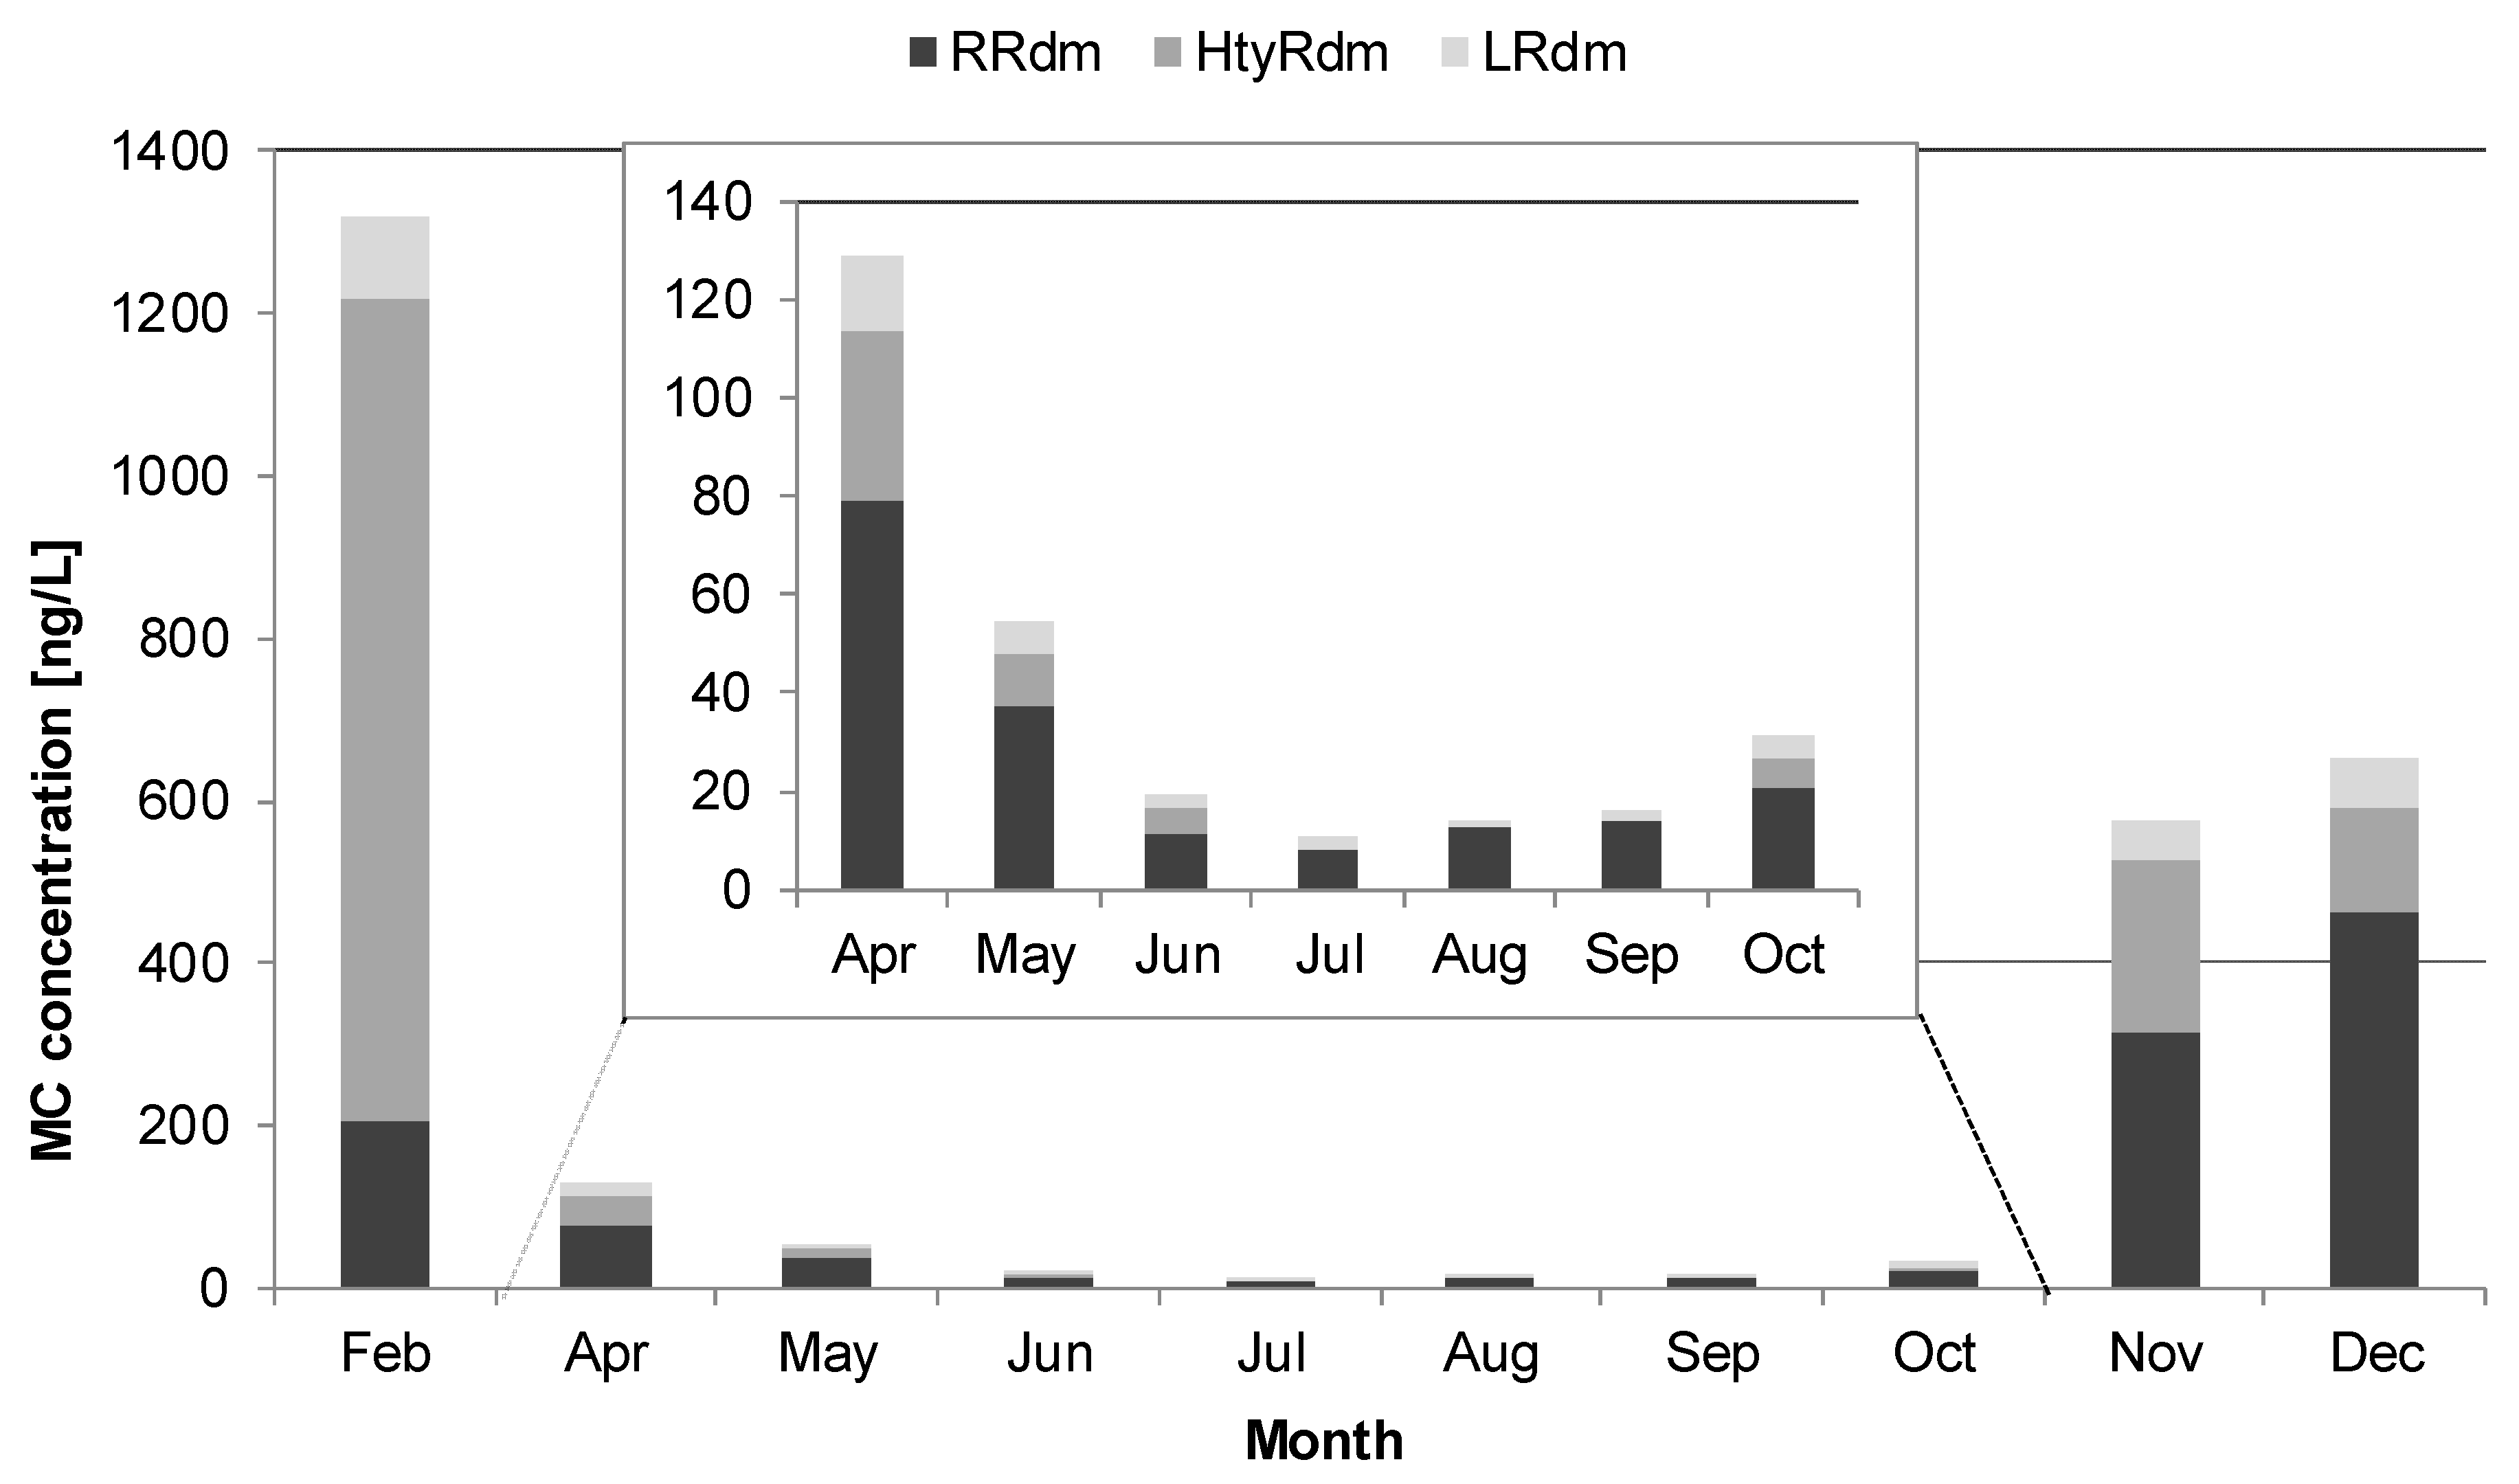
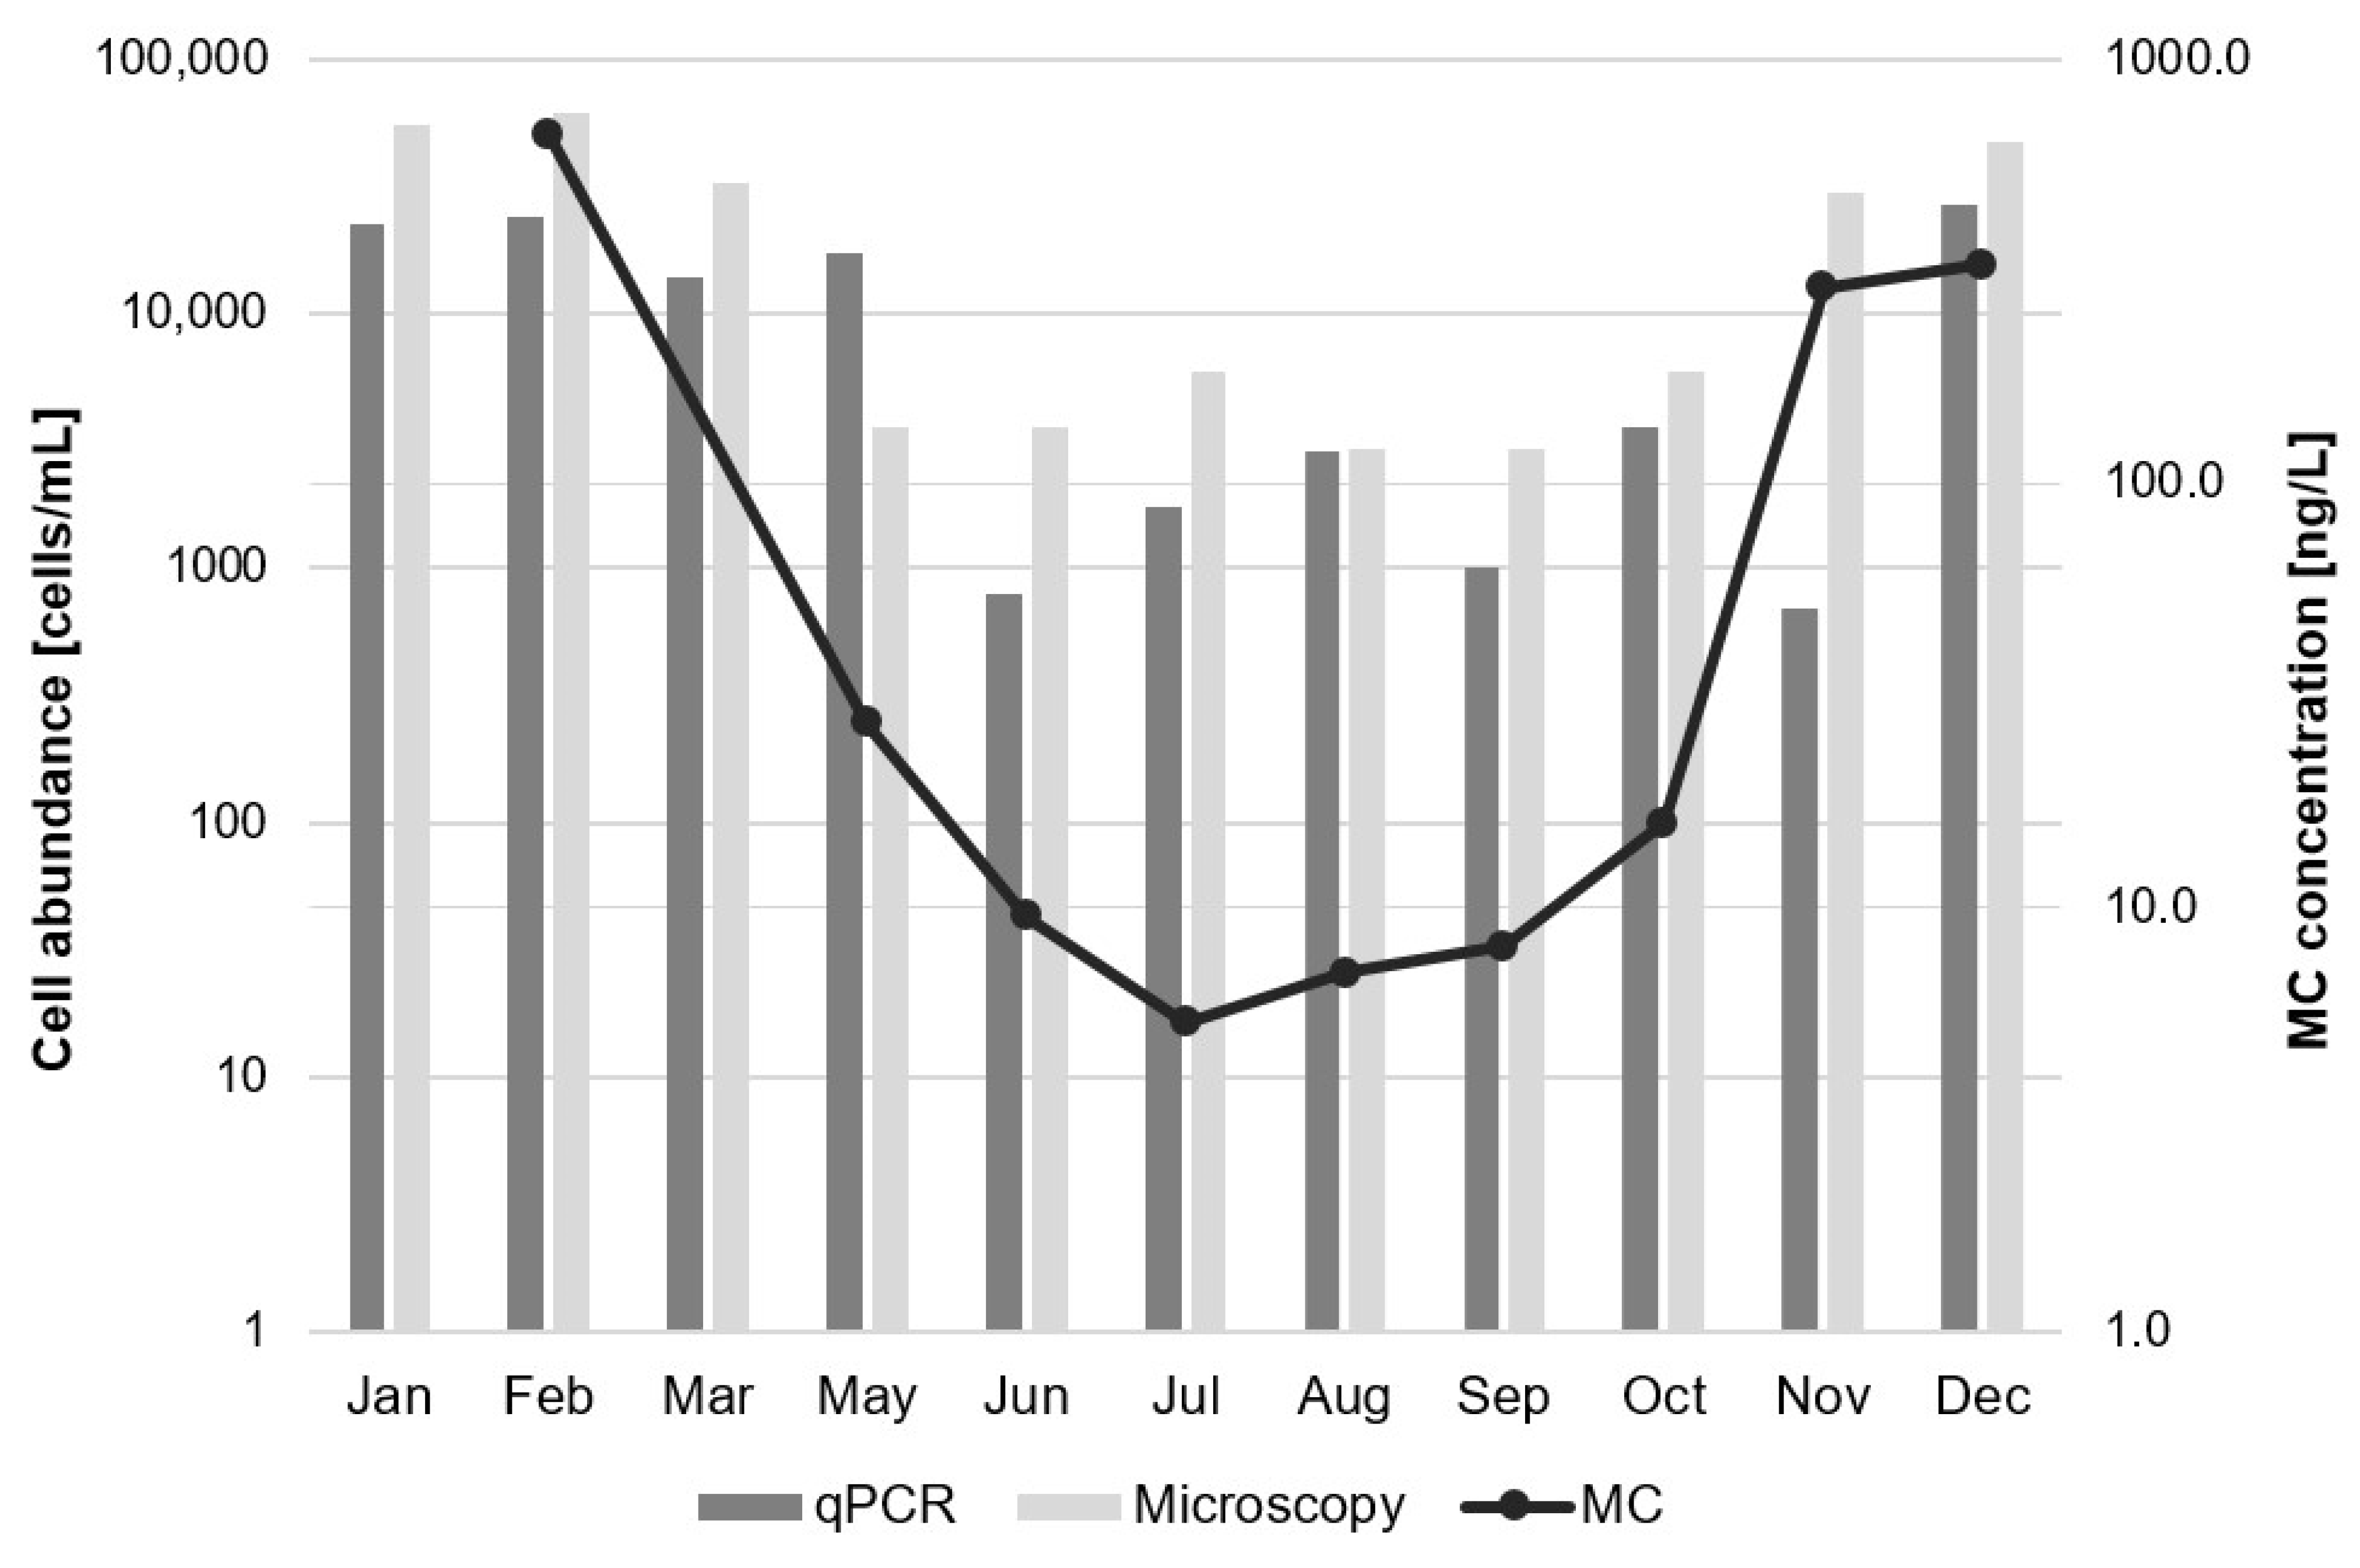
2.3. Temporal Variability of Microcystin Abundance
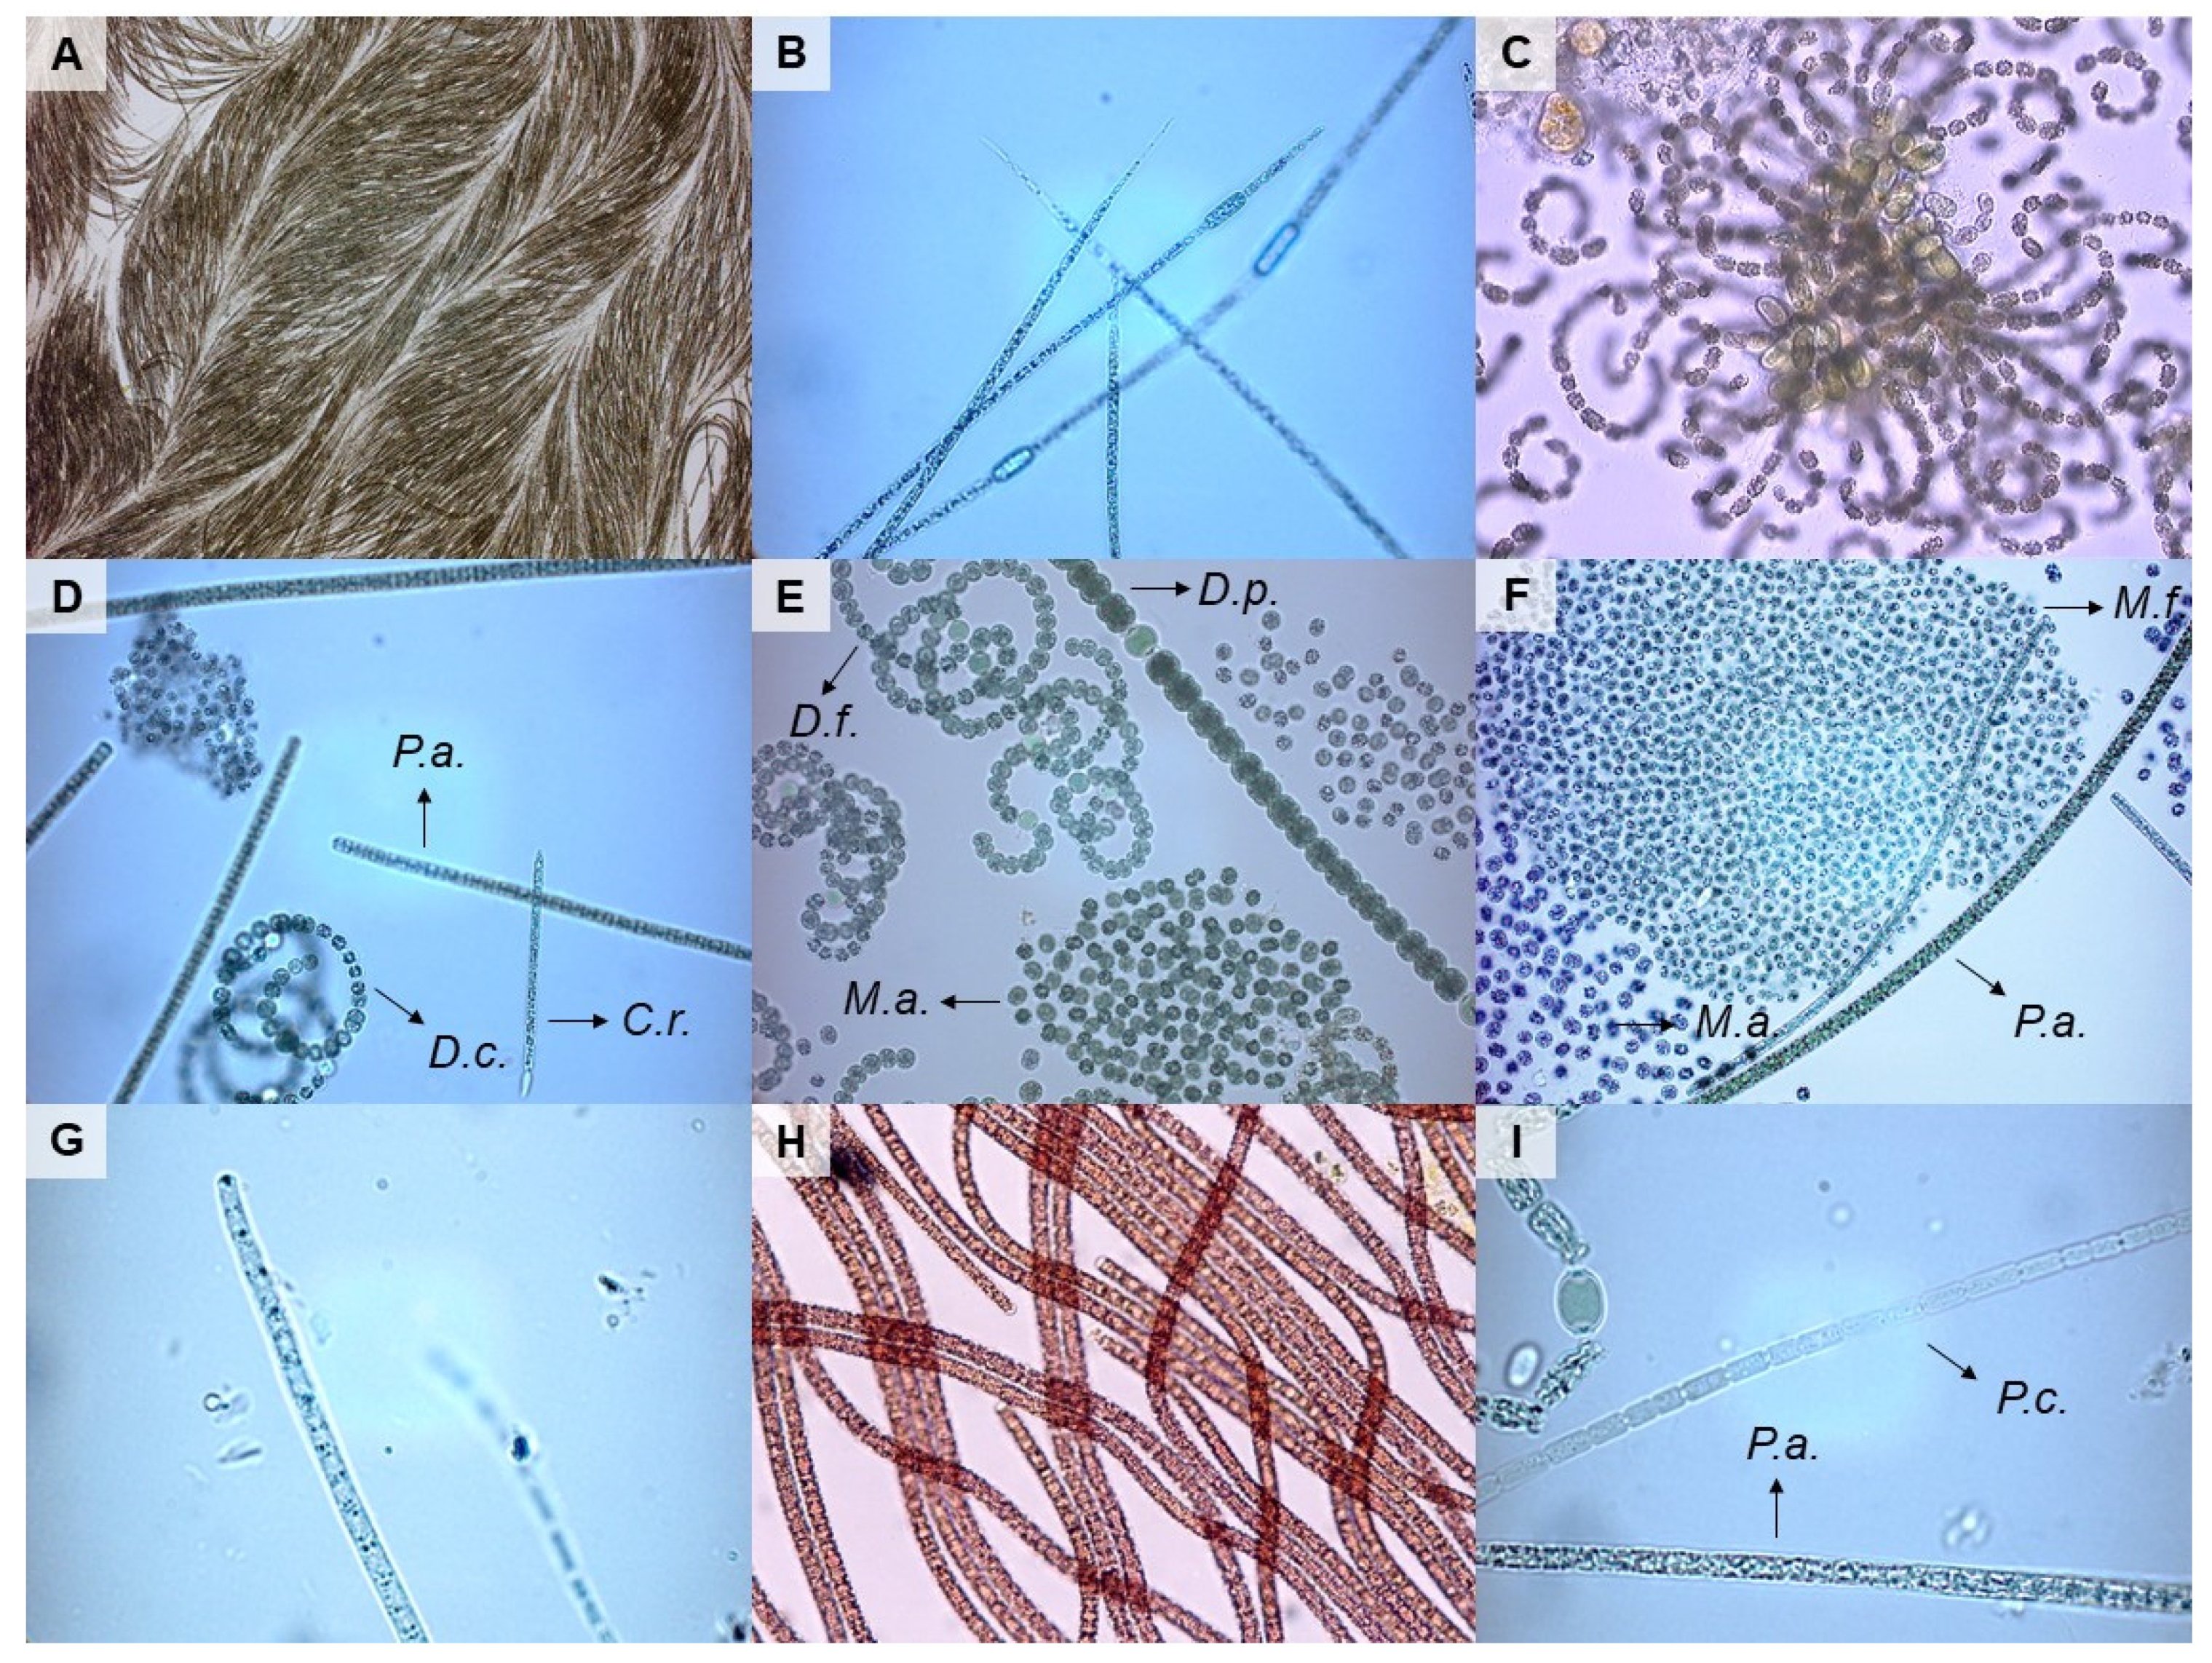
2.4. Microscopic Analyses
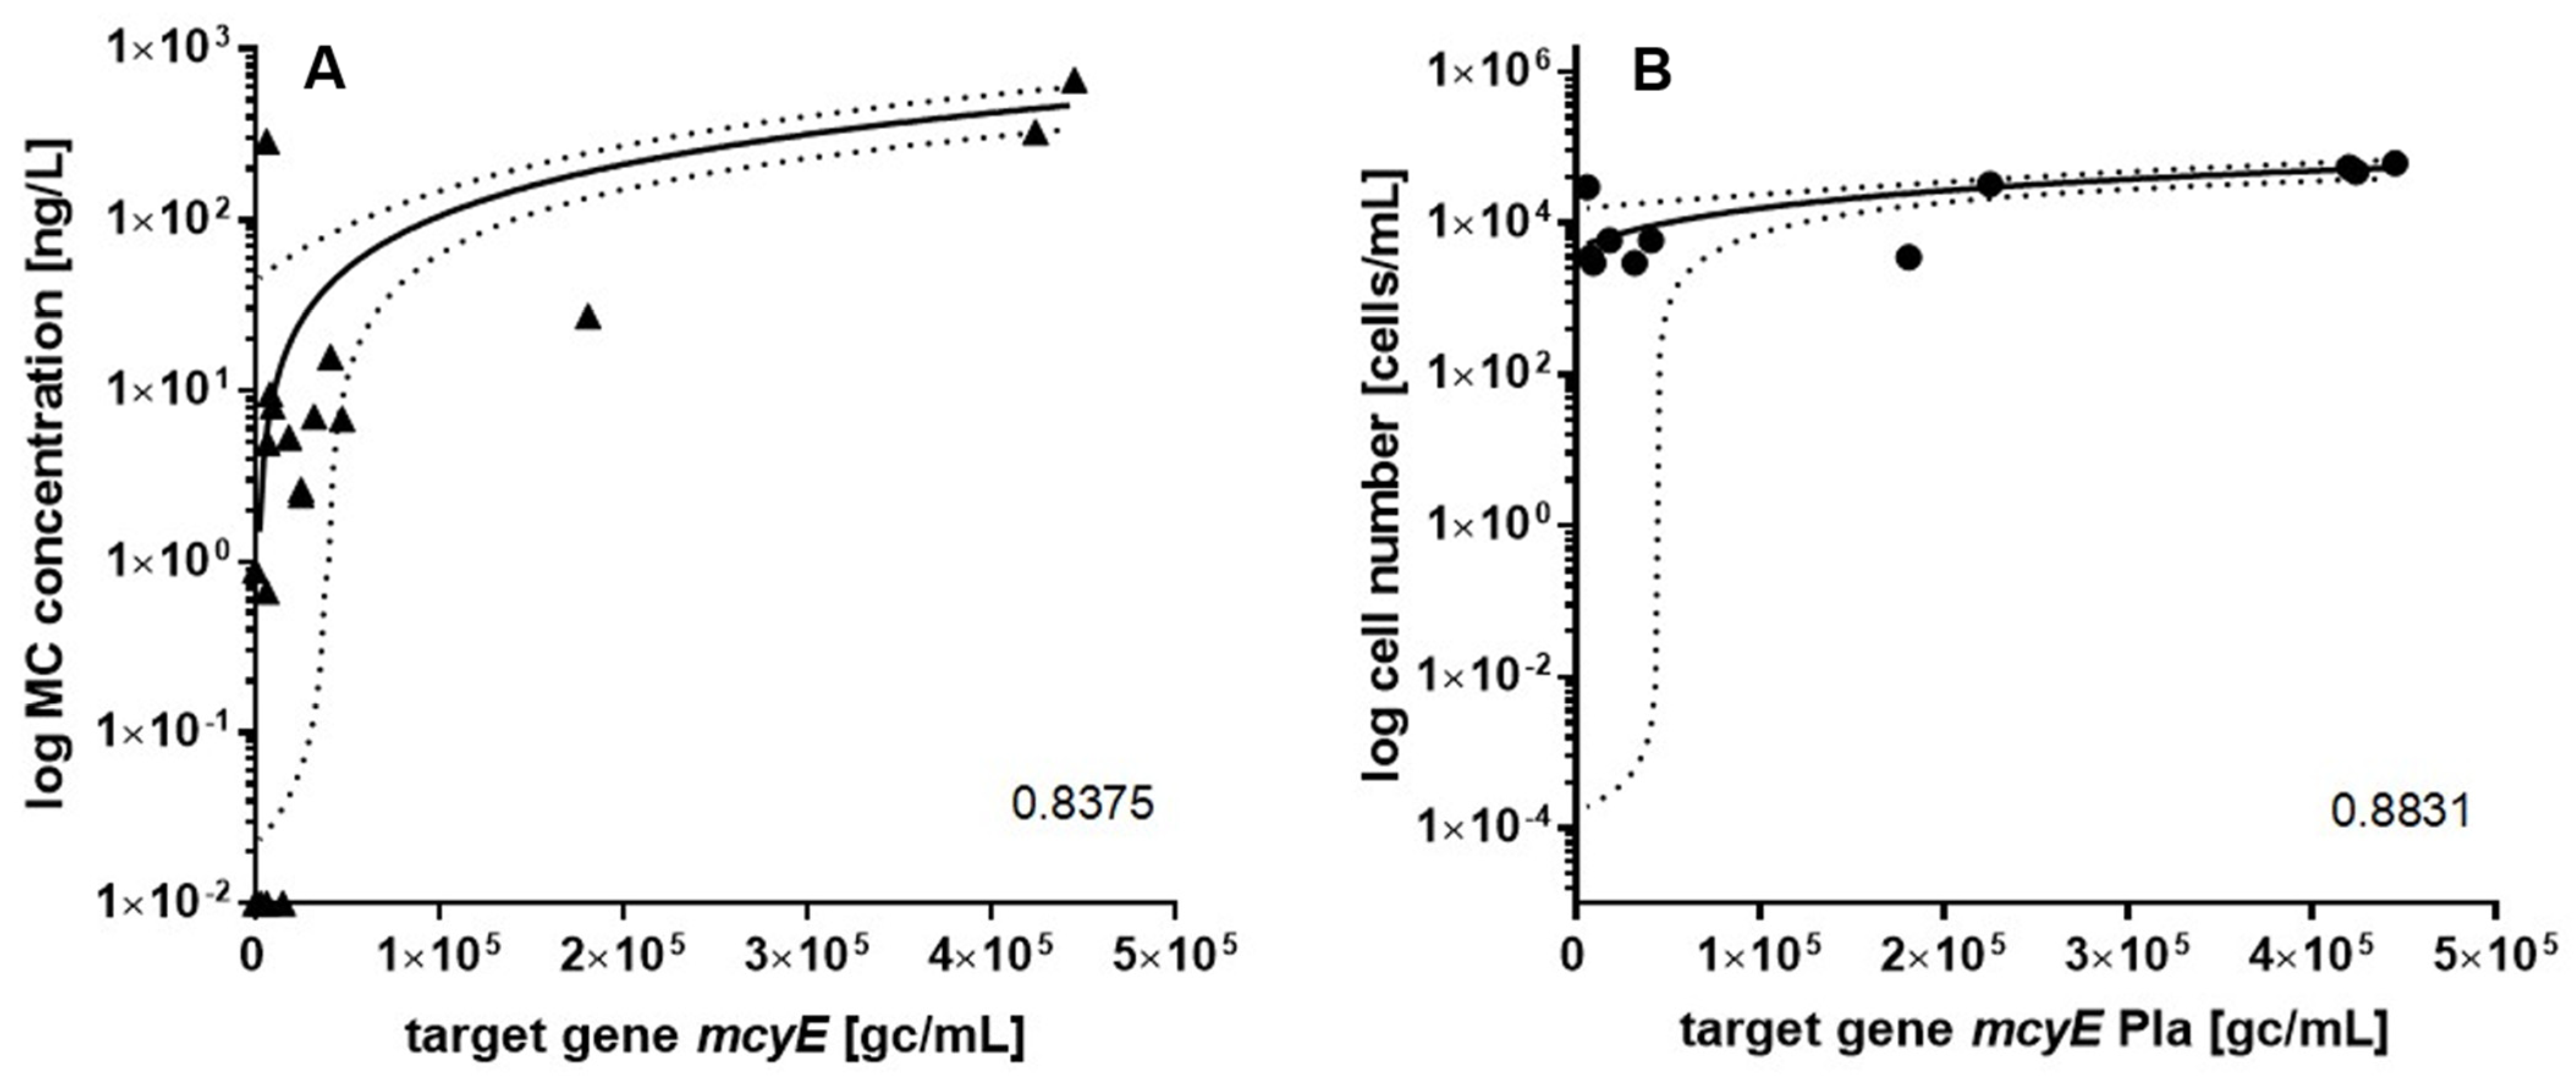
2.5. Correlation between Parametres
3. Discussion
4. Conclusions
5. Methods and Materials
5.1. Cyanobacterial Cultures and Synthetic DNA Fragments
5.2. Environmental Sampling
5.3. DNA Extraction and Quality Control
5.4. qPCR Setup, Assay Validation and Quantification
5.5. Cyanotoxin Analysis with LC-MS/MS
5.6. Data Analysis
Supplementary Materials
Author Contributions
Funding
Data Availability Statement
Acknowledgments
Conflicts of Interest
References
- Sanseverino, I.; António, D.C.; Loos, R.; Lettieri, T. Cyanotoxins: Methods and Approaches for Their Analysis and Detection; EUR 28624; Publications Office of the European Union: Luxembourg, 2017. [Google Scholar] [CrossRef]
- Pacheco, A.B.F.; Guedes, I.A.; Azevedo, S.M.F.O. Is qPCR a Reliable Indicator of Cyanotoxin Risk in Freshwater? Toxins 2016, 8, 172. [Google Scholar] [CrossRef] [Green Version]
- Spoof, L.; Catherine, A. Tables of Microcystins and Nodularins. In Handbook of Cyanobacterial Monitoring and Cyanotoxin Analysis; Meriluoto, J., Spoof, L., Codd, G.A., Eds.; John Wiley and Sons Ltd.: Hoboken, NJ, USA, 2017; pp. 526–537. [Google Scholar] [CrossRef]
- Ngwa, F.F.; Madramootoo, C.A.; Jabaji, S. Comparison of Cyanobacterial Microcystin Synthetase (Mcy) E Gene Transcript Levels, Mcy E Gene Copies, and Biomass as Indicators of Microcystin Risk under Laboratory and Field Conditions. MicrobiologyOpen 2014, 3, 411–425. [Google Scholar] [CrossRef]
- Orr, P.T.; Rasmussen, J.P.; Burford, M.A.; Eaglesham, G.K.; Lennox, S.M. Evaluation of Quantitative Real-Time PCR to Characterise Spatial and Temporal Variations in Cyanobacteria, Cylindrospermopsis raciborskii (Woloszynska) Seenaya et Subba Raju and Cylindrospermopsin Concentrations in Three Subtropical Australian Reservoirs. Harmful Algae 2010, 9, 243–254. [Google Scholar] [CrossRef]
- Al-Tebrineh, J.; Mihali, T.K.; Pomati, F.; Neilan, B.A. Detection of Saxitoxin-Producing Cyanobacteria and Anabaena circinalis in Environmental Water Blooms by Quantitative PCR. Appl. Environ. Microbiol. 2010, 76, 7836–7842. [Google Scholar] [CrossRef] [PubMed] [Green Version]
- Marbun, Y.R.; Yen, H.-K.; Lin, T.-F.; Ramos, Y.; Lin, H.-L.; Michinaka, A. Rapid On-Site Monitoring of Cylindrospermopsin-Producers in Reservoirs Using Quantitative PCR. Sustain. Environ. Res. 2012, 22, 143–151. [Google Scholar]
- Al-Tebrineh, J.; Pearson, L.A.; Yasar, S.A.; Neilan, B.A. A Multiplex qPCR Targeting Hepato- and Neurotoxigenic Cyanobacteria of Global Significance. Harmful Algae 2012, 15, 19–25. [Google Scholar] [CrossRef]
- Gugger, M.; Lenoir, S.; Berger, C.; Ledreux, A.; Druart, J.C.; Humbert, J.F.; Guette, C.; Bernard, C. First Report in a River in France of the Benthic Cyanobacterium Phormidium favosum Producing Anatoxin-a Associated with Dog Neurotoxicosis. Toxicon 2005, 45, 919–928. [Google Scholar] [CrossRef]
- Wood, S.A.; Heath, M.W.; Holland, P.T.; Munday, R.; McGregor, G.B.; Ryan, K.G. Identification of a Benthic Microcystin-Producing Filamentous Cyanobacterium (Oscillatoriales) Associated with a Dog Poisoning in New Zealand. Toxicon 2010, 55, 897–903. [Google Scholar] [CrossRef]
- Faassen, E.J.; Harkema, L.; Begeman, L.; Lurling, M. First Report of (Homo)Anatoxin-a and Dog Neurotoxicosis after Ingestion of Benthic Cyanobacteria in The Netherlands. Toxicon 2012, 60, 378–384. [Google Scholar] [CrossRef] [PubMed]
- Fastner, J.; Beulker, C.; Geiser, B.; Hoffmann, A.; Kröger, R.; Teske, K.; Hoppe, J.; Mundhenk, L.; Neurath, H.; Sagebiel, D.; et al. Fatal Neurotoxicosis in Dogs Associated with Tychoplanktic, Anatoxin-a Producing Tychonema sp. in Mesotrophic Lake Tegel, Berlin. Toxins 2018, 10, 60. [Google Scholar] [CrossRef] [Green Version]
- Bauer, F.; Fastner, J.; Bartha-Dima, B.; Breuer, W.; Falkenau, A.; Mayer, C.; Raeder, U. Mass Occurrence of Anatoxin-a- and Dihydroanatoxin-a-Producing Tychonema sp. in Mesotrophic Reservoir Mandichosee (River Lech, Germany) as a Cause of Neurotoxicosis in Dogs. Toxins 2020, 12, 726. [Google Scholar] [CrossRef]
- Kurmayer, R.; Gumpenberger, M. Diversity of Microcystin Genotypes among Populations of the Filamentous Cyanobacteria Planktothrix rubescens and Planktothrix agardhii. Mol. Ecol. 2006, 15, 3849–3861. [Google Scholar] [CrossRef] [PubMed] [Green Version]
- Rantala, A.; Fewer, D.P.; Hisbergues, M.; Rouhiainen, L.; Vaitomaa, J.; Börner, T.; Sivonen, K. Phylogenetic Evidence for the Early Evolution of Microcystin Synthesis. Proc. Natl. Acad. Sci. USA 2004, 101, 568–573. [Google Scholar] [CrossRef] [PubMed] [Green Version]
- Vaitomaa, J.; Rantala, A.; Halinen, K.; Rouhiainen, L.; Tallberg, P.; Mokelke, L.; Sivonen, K. Quantitative Real-Time PCR for Determination of Microcystin Synthetase E Copy Numbers for Microcystis and Anabaena in Lakes. Appl. Environ. Microbiol. 2003, 69, 7289–7297. [Google Scholar] [CrossRef] [Green Version]
- Rantala, A.; Rajaniemi-Wacklin, P.; Lyra, C.; Lepistö, L.; Rintala, J.; Mankiewicz-Boczek, J.; Sivonen, K. Detection of Microcystin-Producing Cyanobacteria in Finnish Lakes with Genus-Specific Microcystin Synthetase Gene E (McyE) PCR and Associations with Environmental Factors. Appl. Environ. Microbiol. 2006, 72, 6101–6110. [Google Scholar] [CrossRef] [PubMed] [Green Version]
- Campo, E.; Lezcano, M.-Á.; Agha, R.; Cirés, S.; Quesada, A.; El-Shehawy, R. First TaqMan Assay to Identify and Quantify the Cylindrospermopsin-Producing Cyanobacterium Aphanizomenon ovalisporum in Water. Adv. Microbiol. 2013, 3, 430–437. [Google Scholar] [CrossRef] [Green Version]
- Rantala, A.; Rizzi, E.; Castiglioni, B.; De Bellis, G.; Sivonen, K. Identification of Hepatotoxin-Producing Cyanobacteria by DNA-Chip. Environ. Microbiol. 2008, 10, 653–664. [Google Scholar] [CrossRef]
- Al-Tebrineh, J.; Gehringer, M.M.; Akcaalan, R.; Neilan, B.A. A New Quantitative PCR Assay for the Detection of Hepatotoxigenic Cyanobacteria. Toxicon 2011, 57, 546–554. [Google Scholar] [CrossRef]
- Sabart, M.; Crenn, K.; Perrière, F.; Abila, A.; Leremboure, M.; Colombet, J.; Jousse, C.; Latour, D. Co-Occurrence of Microcystin and Anatoxin-a in the Freshwater Lake Aydat (France): Analytical and Molecular Approaches during a Three-Year Survey. Harmful Algae 2015, 48, 12–20. [Google Scholar] [CrossRef] [PubMed]
- Rantala-Ylinen, A.; Känä, S.; Wang, H.; Rouhiainen, L.; Wahlsten, M.; Rizzi, E.; Berg, K.; Gugger, M.; Sivonen, K. Anatoxin-a Synthetase Gene Cluster of the Cyanobacterium Anabaena sp. Strain 37 and Molecular Methods to Detect Potential Producers. Appl. Environ. Microbiol. 2011, 77, 7271–7278. [Google Scholar] [CrossRef] [Green Version]
- Rački, N.; Dreo, T.; Gutierrez-Aguirre, I.; Blejec, A.; Ravnikar, M. Reverse Transcriptase Droplet Digital PCR Shows High Resilience to PCR Inhibitors from Plant, Soil and Water Samples. Plant. Methods 2014, 10, 1–10. [Google Scholar] [CrossRef] [PubMed]
- Mez, K.; Hanselmann, K.; Beattie, K.; Codd, G.; Hauser, B.; Naegeli, H.; Preisig, H. Identification of a Microcystin in Benthic Cyanobacteria Linked to Cattle Deaths on Alpine Pastures in Switzerland. Eur. J. Phycol. 1997, 32, 111–117. [Google Scholar] [CrossRef]
- Seifert, M.; McGregor, G.; Eaglesham, G.; Wickramasinghe, W.; Shaw, G. First Evidence for the Production of Cylindrospermopsin and Deoxy-Cylindrospermopsin by the Freshwater Benthic Cyanobacterium, Lyngbya wollei (Farlow Ex Gomont) Speziale and Dyck. Harmful Algae 2007, 6, 73–80. [Google Scholar] [CrossRef]
- Mazmouz, R.; Chapuis-Hugon, F.; Mann, S.; Pichon, V.; Méjean, A.; Ploux, O. Biosynthesis of Cylindrospermopsin and 7-Epicylindrospermopsin in Oscillatoria sp. strain PCC 6506: Identification of the Cyr Gene Cluster and Toxin Analysis. Appl. Environ. Microbiol. 2010, 76, 4943–4949. [Google Scholar] [CrossRef] [PubMed] [Green Version]
- Gaget, V.; Humpage, A.R.; Huang, Q.; Monis, P.; Brookes, J.D. Benthic Cyanobacteria: A Source of Cylindrospermopsin and Microcystin in Australian Drinking Water Reservoirs. Water Res. 2017, 124, 454–464. [Google Scholar] [CrossRef]
- Smith, F.M.J.; Wood, S.A.; van Ginkel, R.; Broady, P.A.; Gaw, S. First Report of Saxitoxin Production by a Species of the Freshwater Benthic Cyanobacterium, Scytonema Agardh. Toxicon 2011, 57, 566–573. [Google Scholar] [CrossRef]
- Lajeunesse, A.; Segura, P.A.; Gélinas, M.; Hudon, C.; Thomas, K.; Quilliam, M.A.; Gagnon, C. Detection and Confirmation of Saxitoxin Analogues in Freshwater Benthic Lyngbya wollei Algae Collected in the St. Lawrence River (Canada) by Liquid Chromatography-Tandem Mass Spectrometry. J. Chromatogr. A 2012, 1219, 93–103. [Google Scholar] [CrossRef]
- Belykh, O.I.; Tikhonova, I.V.; Kuzmin, A.V.; Sorokovikova, E.G.; Fedorova, G.A.; Khanaev, I.V.; Sherbakova, T.A.; Timoshkin, O.A. First Detection of Benthic Cyanobacteria in Lake Baikal Producing Paralytic Shellfish Toxins. Toxicon 2016, 121, 36–40. [Google Scholar] [CrossRef]
- Otten, T.G.; Xu, H.; Qin, B.; Zhu, G.; Paerl, H.W. Spatiotemporal Patterns and Ecophysiology of Toxigenic Microcystis Blooms in Lake Taihu, China: Implications for Water Quality Management. Environ. Sci. Technol. 2012, 46, 3480–3488. [Google Scholar] [CrossRef]
- Ouahid, Y.; Pérez-Silva, G.; Del Campo, F.F. Identification of Potentially Toxic Environmental Microcystis by Individual and Multiple PCR Amplification of Specific Microcystin Synthetase Gene Regions. Environ. Toxicol. 2005, 20, 235–242. [Google Scholar] [CrossRef]
- Christiansen, G.; Molitor, C.; Philmus, B.; Kurmayer, R. Nontoxic Strains of Cyanobacteria Are the Result of Major Gene Deletion Events Induced by a Transposable Element. Mol. Biol. Evol. 2008, 25, 1695–1704. [Google Scholar] [CrossRef] [PubMed]
- Ostermaier, V.; Kurmayer, R. Application of Real-Time PCR to Estimate Toxin Production by the Cyanobacterium Planktothrix sp. Appl. Environ. Microbiol. 2010, 76, 3495–3502. [Google Scholar] [CrossRef] [Green Version]
- Al-Tebrineh, J.; Merrick, C.; Ryan, D.; Humpage, A.; Bowling, L.; Neilan, B.A. Community Composition, Toxigenicity, and Environmental Conditions during a Cyanobacterial Bloom Occurring along 1100 Kilometers of the Murray River. Appl. Environ. Microbiol. 2012, 78, 263–272. [Google Scholar] [CrossRef] [Green Version]
- Wood, S.A.; Rueckert, A.; Hamilton, D.P.; Cary, S.C.; Dietrich, D.R. Switching Toxin Production on and off: Intermittent Microcystin Synthesis in a Microcystis Bloom. Environ. Microbiol. Rep. 2011, 3, 118–124. [Google Scholar] [CrossRef] [PubMed]
- El Semary, N.A. Investigating Factors Affecting Growth and Cellular McyB Transcripts of Microcystis aeruginosa PCC 7806 Using Real-Time PCR. Ann. Microbiol. 2010, 60, 181–188. [Google Scholar] [CrossRef]
- Pimentel, J.S.M.; Giani, A. Microcystin Production and Regulation under Nutrient Stress Conditions in Toxic Microcystis Strains. Appl. Environ. Microbiol. 2014, 80, 5836–5843. [Google Scholar] [CrossRef] [PubMed] [Green Version]
- Kaebernick, M.; Dittmann, E.; Börner, T.; Neilan, B.A. Multiple Alternate Transcripts Direct the Biosynthesis of Microcystin, a Cyanobacterial Nonribosomal Peptide. Appl. Environ. Microbiol. 2002, 68, 449–455. [Google Scholar] [CrossRef] [PubMed] [Green Version]
- Tanabe, Y.; Kaya, K.; Watanabe, M.M. Evidence for Recombination in the Microcystin Synthetase (Mcy) Genes of Toxic Cyanobacteria Microcystis spp. J. Mol. Evol. 2004, 58, 633–641. [Google Scholar] [CrossRef]
- Labarre, J.; Chauvat, F.; Thuriaux, P. Insertional Mutagenesis by Random Cloning of Antibiotic Resistance Genes into the Genome of the Cyanobacterium Synechocystis Strain PCC 6803. J. Bacteriol. 1989, 171, 3449–3457. [Google Scholar] [CrossRef] [Green Version]
- Zerulla, K.; Ludt, K.; Soppa, J. The Ploidy Level of Synechocystis sp. PCC 6803 is Highly Variable and is Influenced by Growth Phase and by Chemical and Physical External Parameters. Microbiology 2016, 162, 730–739. [Google Scholar] [CrossRef]
- Becker, S.; Fahrbach, M.; Bo, P.; Ernst, A. Quantitative Tracing, by Taq Nuclease Assays, of a Synechococcus Ecotype in a Highly Diversified Natural Population. Appl. Environ. Microbiol. 2002, 68, 4486–4494. [Google Scholar] [CrossRef] [PubMed] [Green Version]
- Jiang, Y.; Xiao, P.; Yu, G.; Shao, J.; Liu, D.; Azevedo, S.M.F.O.; Li, R. Sporadic Distribution and Distinctive Variations of Cylindrospermopsin Genes in Cyanobacterial Strains and Environmental Samples from Chinese Freshwater Bodies. Appl. Environ. Microbiol. 2014, 80, 5219–5230. [Google Scholar] [CrossRef] [PubMed] [Green Version]
- Ballot, A.; Cerasino, L.; Hostyeva, V.; Cirés, S. Variability in the Sxt Gene Clusters of PSP Toxin Producing Aphanizomenon gracile Strains from Norway, Spain, Germany and North America. PLoS ONE 2016, 11. [Google Scholar] [CrossRef]
- Clark, K.; Karsch-Mizrachi, I.; Lipman, D.J.; Ostell, J.; Sayers, E.W. GenBank. Nucleic Acids Res. 2016, 44, 67–72. [Google Scholar] [CrossRef] [PubMed] [Green Version]
- Madden, T. The BLAST Sequence Analysis Tool. In The NCBI Handbook, 2nd ed.; National Center for Biotechnology Information: Bethesda, MD, USA, 2013. Available online: https://www.ncbi.nlm.nih.gov/books/NBK153387/ (accessed on 23 June 2020).
- Cerasino, L.; Salmaso, N. Co-Occurrence of Anatoxin-a and Microcystins in Lake Garda and Other Deep Perialpine Lakes. Adv. Oceanogr. Limnol. 2020, 11, 11–21. [Google Scholar] [CrossRef]
- Ballot, A.; Swe, T.; Mjelde, M.; Cerasino, L.; Hostyeva, V.; Miles, C.O. Cylindrospermopsin- And Deoxycylindrospermopsin-Producing Raphidiopsis Raciborskii and Microcystin-Producing Microcystis Spp- And Meiktila Lake, Myanmar. Toxins 2020, 12, 232. [Google Scholar] [CrossRef] [PubMed] [Green Version]


| Target Cyanotoxins/Organisms | Assay | Target Gene | Primer Label | Nucleotide Sequence (5′ → 3′) | Fragment Length [bp] | Reference |
|---|---|---|---|---|---|---|
| Microcystins (genus Dolichospermum) | mcyE-Ana | mcyE | mcyE-F2 | GAA ATT TGT GTA GAA GGT GC | 247 | [15] |
| AnamcyE-12R | CAA TCT CGG TAT AGC GGC | [16] | ||||
| Microcystins (genus Microcystis) | mcyE-Mic | mcyE | mcyE-F2 | GAA ATT TGT GTA GAA GGT GC | 247 | [15] |
| MicmcyE-R8 | CAA TGG GAG CAT AAC GAG | [16] | ||||
| Microcystins (genus Planktothrix) | mcyE-Pla | mcyE | mcyE-F2 | GAA ATT TGT GTA GAA GGT GC | 249 | [15] |
| PlamcyE-R3 | CTC AAT CTG AGG ATA ACG AT | [17] | ||||
| Cylindrospermopsins | cyrJ | cyrJ | cyrJ207-F | CCC CTA CAA CCT GAC AAA GCT T | 77 | [18] |
| cyrJ207-R | CCC GCC TGT CAT AGA TGC A | |||||
| Saxitoxins | sxtA | sxtA | sxtA-F | GAT GAC GGA GTA TTT GAA GC | 125 | [6] |
| sxtA-R | CTG CAT CTT CTG GAC GGT AA | |||||
| (Cyano-)bacteria and plant chloroplasts | 16S-cyano | 16S rRNA | cyano-real16S-F | AGC CAC ACT GGG ACT GAG ACA | 73 | [6] |
| cyano-real16S-R | TCG CCC ATT GCG GAA A |
| Cyanobacterial Cultures | qPCR Assays | ||||||||||||
|---|---|---|---|---|---|---|---|---|---|---|---|---|---|
| Strain | Toxicity | 16S-cyano | mcyE-Ana | mcyE-Mic | mcyE-Pla | cyrJ | sxtA | ||||||
| Cq | Tm | Cq | Tm | Cq | Tm | Cq | Tm | Cq | Tm | Cq | Tm | ||
| Anabaena sp. UHCC 0315 | MC-producer | 23.13 | 81.1 | 25.86 | 75.7 | N | N | N | N | N | N | N | N |
| Microcystis aeruginosa PCC 7806 | MC-producer | 20.14 | 81.0 | N | N | 19.82 | 78.0 | N | N | N | N | N | N |
| Planktothrix sp. NIVA-CYA126/8 | MC-producer | 23.55 | 81.1 | N | N | N | N | 24.37 | 77.6 | N | N | N | N |
| Aphanizomenon ovalisporum ILC-164 | CYN-producer | 23.87 | 81.2 | N | N | N | N | N | N | 24.79 | 80.0 | N | N |
| Aphanizomenon gracile NIVA-CYA 851 | SXT-producer | 18.79 | 81.3 | N | N | N | N | N | N | N | N | 18.72 | 79.6 |
| Reference Tm | 81.1 | 75.9 | 78.2 | 77.6 | 79.9 | 79.5 | |||||||
| Assay | LOD (Cells/µL DNA, Cells/mL Sample) | LOQ (Cells/µL DNA, Cells/mL Sample) | Amplification Efficiency | Correlation Coefficient (R2) of Linear Range of Curve |
|---|---|---|---|---|
| mcyE-Ana | 3.3, 30.1 | 33, 301 | 0.63 | 1.0000 |
| mcyE-Mic | 16.5, 205.9 | 165, 2059 | 0.75 | 0.9973 |
| mcyE-Pla | 2.4, 12.5 | 238, 1252 | 0.68 | 0.9969 |
| cyrJ | 5.7, 114.6 | 6, 115 | 0.73 | 0.9991 |
| sxtA | 0.3, 1.5 | 3, 15 | 0.98 | 0.9988 |
| 16S-cyano | 1.6, 20.6 | 165, 2059 | 0.79 | 0.9968 |
| qPCR Assays | ||||||
|---|---|---|---|---|---|---|
| Sample | mcyE-Ana | mcyE-Mic | mcyE-Pla | cyrJ | sxtA | |
| PLANKTON [gc/mL] | BL1.1 | *** | ||||
| BL1.2 | *** | |||||
| BL1.3 | *** | |||||
| BL1.5 | *** | |||||
| BL1.6 | ** | |||||
| BL1.7 | *** | |||||
| BL1.8 | *** | |||||
| BL1.9 | ** | |||||
| BL1.10 | *** | |||||
| BL1.11 | ** | |||||
| BL1.12 | *** | |||||
| BO1 | ||||||
| BO2 | ||||||
| BO3 | * | |||||
| PE1 | *** | |||||
| PE2 | *** | |||||
| PE3 | *** | |||||
| PE4 | ** | |||||
| SL1 | ** | |||||
| SL2 | *** | |||||
| SL3 | ** | |||||
| VO1 | ** | |||||
| VO2 | ** | |||||
| VO3 | ** | |||||
| BIOFILM [gc/g ry weight] | BL2.1 | ** | ||||
| BL2.2 | * | * | ||||
| BL2.3 | ** | |||||
| BL2.4 | * | |||||
| BL2.5 | ||||||
| BL2.6 | * | |||||
| BL2.7 | * | * | ||||
| BL2.8 | ||||||
| BL2.9 | ||||||
| BL2.10 | ** | |||||
| SO1 | ||||||
| SO2 | ||||||
| SO3 | ||||||
| LU | ||||||
| BI | ||||||
| PS | ||||||
| SA1 | * | |||||
| SA2 | ||||||
| RI | ||||||
| LJ | ||||||
| KO | ** | |||||
| TI | ||||||
| GL | ||||||
Publisher’s Note: MDPI stays neutral with regard to jurisdictional claims in published maps and institutional affiliations. |
© 2021 by the authors. Licensee MDPI, Basel, Switzerland. This article is an open access article distributed under the terms and conditions of the Creative Commons Attribution (CC BY) license (http://creativecommons.org/licenses/by/4.0/).
Share and Cite
Zupančič, M.; Kogovšek, P.; Šter, T.; Remec Rekar, Š.; Cerasino, L.; Baebler, Š.; Krivograd Klemenčič, A.; Eleršek, T. Potentially Toxic Planktic and Benthic Cyanobacteria in Slovenian Freshwater Bodies: Detection by Quantitative PCR. Toxins 2021, 13, 133. https://doi.org/10.3390/toxins13020133
Zupančič M, Kogovšek P, Šter T, Remec Rekar Š, Cerasino L, Baebler Š, Krivograd Klemenčič A, Eleršek T. Potentially Toxic Planktic and Benthic Cyanobacteria in Slovenian Freshwater Bodies: Detection by Quantitative PCR. Toxins. 2021; 13(2):133. https://doi.org/10.3390/toxins13020133
Chicago/Turabian StyleZupančič, Maša, Polona Kogovšek, Tadeja Šter, Špela Remec Rekar, Leonardo Cerasino, Špela Baebler, Aleksandra Krivograd Klemenčič, and Tina Eleršek. 2021. "Potentially Toxic Planktic and Benthic Cyanobacteria in Slovenian Freshwater Bodies: Detection by Quantitative PCR" Toxins 13, no. 2: 133. https://doi.org/10.3390/toxins13020133