Effectively managing social media campaigns can be complex and overwhelming. With numerous platforms and vast amounts of data, it’s challenging to identify which metrics are truly important. Many businesses struggle to focus on the right data, leading to ineffective strategies and missed growth opportunities.
Imagine investing significant time and resources into your social media efforts, only to find that your engagement levels remain stagnant or unclear. Basic metrics like likes and follows provide a limited view, leaving you frustrated and unsure about the actual impact of your campaigns. Without clear, actionable insights, it’s difficult to optimize your strategy and drive real results.
To cut through the confusion and guide your efforts, we’ve identified the 23 crucial social media metrics to track in 2025. These metrics will offer a comprehensive understanding of your audience’s behavior, the effectiveness of your content, and the overall performance of your social media strategy. Let’s explore the essential metrics that will propel your success in the coming year.
Main Takeaways From This Article:
- Monitor social media metrics to remain competitive and ensure strategy effectiveness.
- Engagement metrics like likes, comments, and shares provide valuable insights into audience interactions.
- Awareness and traffic metrics are crucial for understanding reach, impressions, and website referrals.
- Conversion and customer service metrics help gauge the return on investment and customer satisfaction.
- TinyURL aids in tracking link performance and optimizing and verifying marketing strategies.
What Are Social Media Metrics?
Social media metrics are the quantifiable aspects of your social media presence. They provide data-driven insights into how your audience interacts with your content, how widely it’s seen, and how well it aligns with your overall goals. Think of them as the “what” and “why” behind your social media efforts.
By analyzing these metrics, you gain a deeper understanding of your audience’s preferences and how your social media efforts are resonating.
The Importance of Measuring Social Media Metrics
Metrics act as a performance report card, revealing insights into how your audience interacts with your content, what resonates with them, how effectively your campaigns perform, and which tactics fall flat. And when it comes to social media marketing, justifying budget allocation is key.
Metrics provide tangible proof of your impact on platforms like Instagram, Facebook, Twitter, etc., allowing you to:
- Assess Engagement: Track likes, comments, shares, and more to understand what content sparks conversation and connection with your social media followers.
- Measure Reach: Determine how many people are viewing your content to ensure you’re expanding your audience and visibility.
- Evaluate Conversions: Monitor actions taken as a result of your social media activities, like purchases or sign-ups, to measure the impact on your business goals.
- Refine Strategies: Use data to tweak and tailor your approach, making informed decisions that drive better results.
- Benchmark Performance: Compare your metrics over time and against competitors to see where you stand and identify opportunities for improvement.

Keeping a close eye on social media metrics allows you to craft more effective, targeted strategies that not only grow your online presence but also contribute significantly to your overall business objectives.
23 Key Metrics for Evaluating Social Media Performance
We’ve established the importance of social media metrics. Now, let’s unpack the 23 key metrics you should be tracking in 2025, categorized to provide a well-rounded view of your social media performance.
Social Media Engagement Metrics
These metrics measure how actively your audience interacts with your content. A high level of engagement indicates a captivated audience and a successful social media strategy.
1. Likes and Reactions
While a seemingly simple metric, likes and reactions are a quick gauge of audience interest. A consistent flow of likes and positive reactions signifies that your content resonates, while a lack thereof suggests the need to adjust your approach.
2. Comments
Comments represent a deeper level of engagement, sparking conversations and providing valuable feedback. Encourage comments by posing thought-provoking questions or running contests that require user input. Analyze comment sentiment to understand audience reception and identify areas for improvement.
3. Shares/Retweets
Sharing your content is a huge compliment, indicating resonance and increasing your reach. A high number of shares demonstrates content that resonates with your audience and expands your brand awareness.
4. Mentions
When your brand is mentioned organically in conversations, even without being tagged, it signifies brand awareness and potential interest. Track mentions to understand how your brand is perceived in the online landscape and identify potential brand advocates.
Social Media Awareness Metrics
These metrics track how many people are seeing your content and how widely your brand message is spreading. They provide insights into the overall visibility of your social media presence
5. Reach
This metric shows the total number of users who viewed your content, regardless of interaction. A healthy reach indicates successful content distribution and audience exposure.
6. Impressions
Impressions measure the total number of times your content is displayed, even if multiple times by the same user. A high number of impressions suggests strong content visibility, but keep an eye on engagement metrics to ensure it’s not just a fleeting glance.
7. Audience Growth Rate
A steady growth rate suggests a captivating brand presence and successful audience targeting. However, a stagnant or declining growth rate might indicate a need to refine your targeting or content strategy. Track the rate at which your follower base is expanding.
Traffic Metrics

These metrics show how effectively your social media efforts are driving traffic to your website or landing pages.
8. Click-Through Rate (CTR)
This metric indicates the percentage of users who click on a link embedded in your social media content. A high CTR suggests compelling content and effective calls to action (CTAs) that entice users to visit your website.
9. Social Media Referrals
This metric provides a clear picture of how social media contributes to your overall website traffic. Track how much website traffic originates from your social media channels.
10. Bounce Rate
This metric shows the percentage of visitors who leave your website after viewing only one page. A high bounce rate might indicate irrelevant content or landing pages not optimized for social media traffic.
Conversion Metrics
Conversion metrics show how well your social media is getting people to take action, like buying something or signing up. This helps you see the return on investment (ROI) and how successful your campaigns are.
11. Conversion Rate
This metric indicates the percentage of visitors completing a desired action on your website, such as making a purchase or signing up for a newsletter. A healthy conversion rate from social media traffic signifies successful content that drives results.
12. Lead Generation
For B2B businesses, tracking the number of leads generated through social media efforts is crucial. Analyze which social media platforms and content types generate the most leads to optimize your lead generation strategy.
13. Cost-Per-Click
This metric applies to paid advertising on social media platforms. It indicates the cost you incur for each click on a promoted social media post. By tracking CPC alongside other metrics, you can assess the effectiveness of your paid social media campaigns and optimize your budget allocation.
Customer Service Metrics

Social media is great for building relationships and providing excellent customer service. These metrics show how well you are handling customer issues and building brand loyalty.
14. Response Time
This metric measures the average time your brand takes to respond to customer inquiries or messages on social media platforms. A swift response time demonstrates attentiveness and prioritizes customer satisfaction.
15. Resolution Rate
This metric tracks the percentage of customer issues that are successfully resolved through social media interactions. A high resolution rate indicates you’re effectively addressing customer concerns and delivering positive experiences.
16. Net Promoter Score (NPS)
NPS is a customer loyalty metric based on a single survey question about how likely a customer is to recommend your brand. Scores range from -100 (extremely dissatisfied) to +100 (extremely satisfied).
Content Performance Metrics
Understanding how your social media content resonates with your audience is crucial. These metrics provide valuable insights into what content performs best and keeps your audience engaged.
17. Video Views
This metric simply counts the number of times your video content is played across social media platforms. It provides a broad understanding of how much your audience is consuming your video content.
18. Completion Rate
This metric, especially important for video content, goes beyond just views. It measures the percentage of viewers who watch your video all the way through. A high completion rate suggests your content is engaging and holds viewers’ attention.
19. Top-Performing Posts
Identify which of your social media posts consistently generate the most engagement (likes, comments, shares). By analyzing these top performers, you can understand what content resonates most with your audience and use those insights to inform your future content strategy.
Brand Health Metrics
These metrics help you understand how your brand is perceived in the social media landscape and identify areas for improvement.
20. Sentiment Analysis
This metric delves deeper than simply counting mentions of your brand. It utilizes artificial intelligence to analyze the emotional tone behind those mentions.
21. Share of Voice
This metric measures how often your brand is mentioned compared to the total number of mentions in your industry or against competitors. A high SOV means your brand is well-known and has a strong presence. Think of it as the percentage of the online conversation about your brand.
22. Brand Mentions
This metric provides a broad indicator of brand awareness. By combining brand mentions with sentiment analysis, you can understand the context of those mentions and gain valuable insights into brand perception.
Tools for Tracking Social Media Metrics
Imagine having all your social media metrics neatly organized in one place, readily available for analysis. That’s the magic of a social media analytics tool! These platforms go beyond basic reporting, offering powerful features to help you understand what’s working and what’s not in your social media strategy.
Here’s a look at some popular tools and how they can help you become a social media tracking pro:
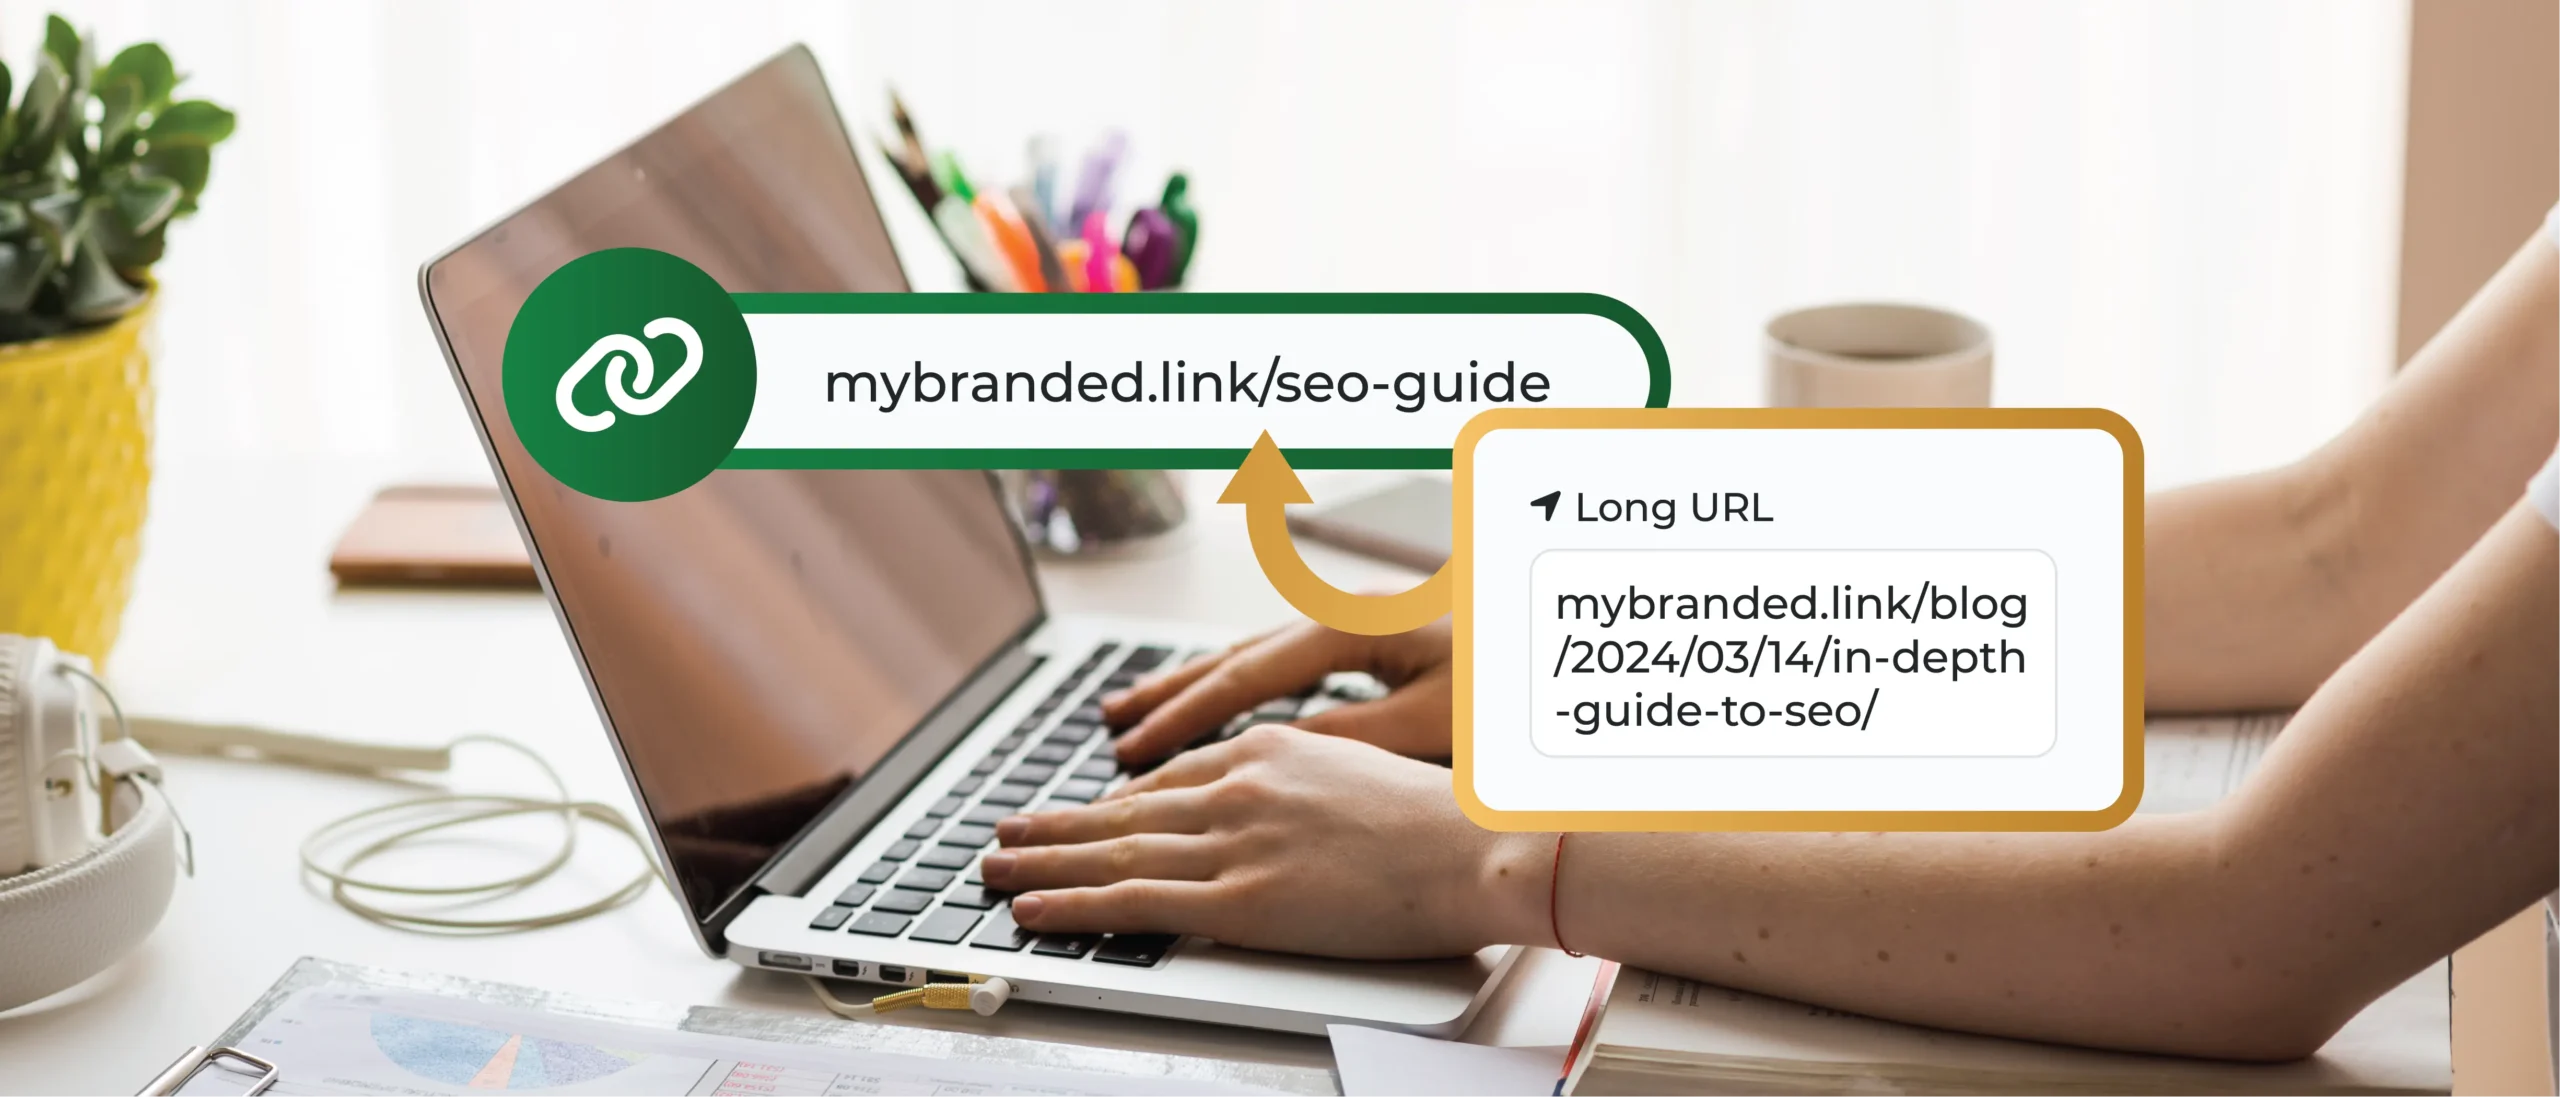
1. TinyURL
When you shorten links using TinyURL, you can add your brand name to them and even gain access to valuable analytics about how those links perform. This includes data on clicks, click-through rates (CTR), and even geographic information about where those clicks originate.
Better still, TinyURL lets you see how well your efforts can successfully drive traffic to your posts: a metric unattainable if you rely only on your social platforms’ analytics. For instance, if much of your business relies on your Instagram profile or YouTube account, you can track how well your promotional channels (ex. emails, podcast ads, etc.) send traffic to specific posts and videos.
By incorporating TinyURL into your link-sharing strategy, you can gain deeper insights into which content resonates most with your audience across different platforms.
2. Google Analytics
A powerhouse for website analytics, Google Analytics also integrates seamlessly with many social media platforms. Track how social media traffic flows to your website, analyze audience demographics, and identify which social media channels drive the most conversions.
3. Hootsuite
This all-in-one platform offers comprehensive social media management and analytics tools. Schedule posts across various platforms, monitor brand mentions, track conversations, and generate detailed reports on your social media performance. Hootsuite is perfect for agencies managing multiple social media accounts.
4. Sprout Social
Similar to Hootsuite, Sprout Social offers a comprehensive suite of social media management and analytics tools. Track engagement metrics, analyze competitor performance, and identify brand advocates. Sprout Social also boasts powerful social listening features, allowing you to stay on top of industry trends and conversations.
5. Buffer
This user-friendly platform simplifies social media scheduling and publishing. Buffer also provides basic analytics to track engagement metrics and content performance. It’s a great option for small businesses or individuals starting with social media management.
Amplify Your Social Media Marketing Efforts With TinyURL
Sure, TinyURL might not be the first name that pops into mind when you think of social media analytics. But here’s the secret: TinyURL offers robust link analytics!
When you shorten your links using TinyURL, you gain access to valuable data about how those links perform. This goes beyond basic click counts. TinyURL’s link analytics provide insights such as:
- Clicks: Track the total number of times your shortened links are clicked. This is a great initial indicator of audience interest in the content you’re sharing.
- Click-Through Rates (CTR): Go beyond clicks and understand how effective your calls to action (CTAs) are. A high CTR suggests compelling content and CTAs that entice users to click.
- Geographic Data: Uncover where your audience clicks originate from. This can be crucial for tailoring your content strategy to resonate with specific regions or demographics.
By incorporating TinyURL’s link analytics into your social media strategy, you gain a deeper understanding of content performance, audience preferences, and social media campaign optimization.
Ready to unlock the hidden potential of TinyURL’s link analytics? Get started with a free account now!