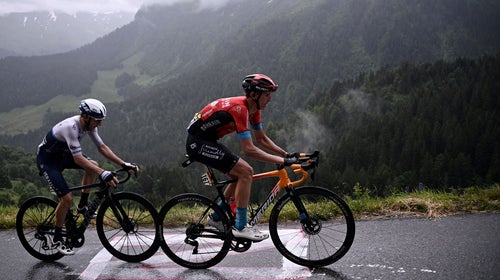
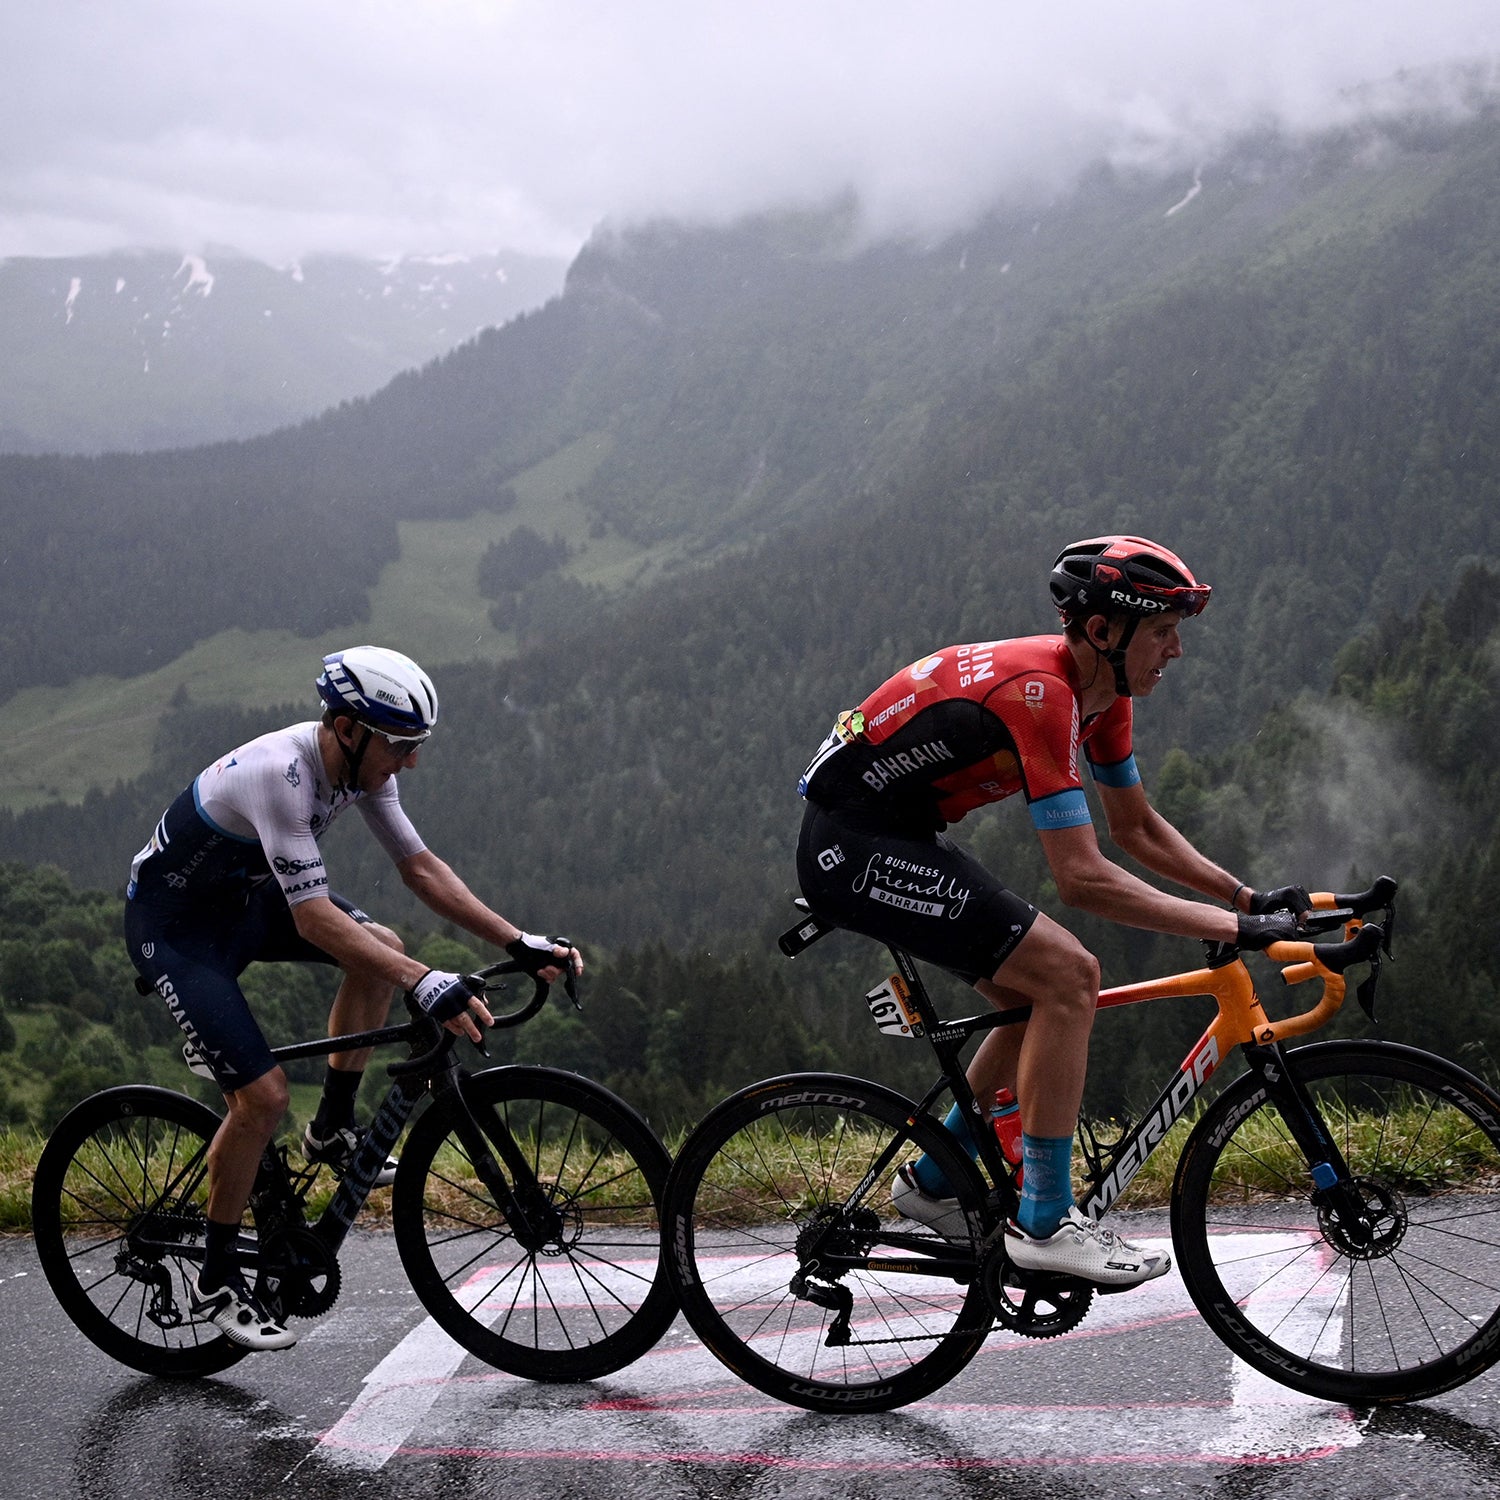
The most gripping moments of this year’s Tour de France, for me, came during the rain-soaked final climb of the eighth stage, on the first day in the Alps. Mike Woods, the injury-prone Canadian sub-four-minute miler who took up cycling as a form of cross-training in his 20s (and whose running exploits I covered for his hometown newspaper, the Ottawa Citizen, nearly two decades ago), had launched an all-out bid for a stage win.
Woods crossed the penultimate Cat 1 climb, the Col de Romme, more than a minute ahead of his rivals. But the final ascent, the Col de la Colombière, involved nearly five miles of climbing at an average grade of 8.5 percent—and little by little, Woods’s margin began to melt away. If he made it to the top with a lead, there was a good chance he’d hold on to the stage win. But it soon became clear that it would be a matter of seconds either way. Had he attacked too soon, or not soon enough? Too hard, or not hard enough? Or had he, as I desperately hoped, gotten it just right?
A few days after the Tour wrapped up, I had a chance to chat with Paulo Saldanha, Woods’s long-time coach and the performance director for his team, Israel Start-Up Nation, about how these race-altering decisions are made in the heat of a Tour stage. I first met Paulo in the mid-1990s when he was an ex-pro triathlete pursuing a masters degree in exercise physiology at McGill University (where we both trained with the cross-country team). He had just founded PowerWatts, an early example of the data-focused, tech-enabled approach that now dominates cycling. The tools and data streams he has available these days are beyond anything he could have imagined back then—but, as he told me, that doesn’t mean that race performances are ever fully predictable. Here are a few highlights from our conversation.
Everyone Has a Plan, But…
I had a mental image of some sort of Dr. Evil-esque control room with lots of screens and real-time data and so on, where the big decisions about tactics are issued. In reality, the Tour imposes strict limits on the data that can be transmitted and received during the race. Pro cycling’s governing body, the Union Cycliste Internationale, even tried to ban two-way radio communication a decade ago, but eventually backed off in the face of opposition from cyclists and teams.
That means the team directors can communicate with their riders, but they can’t micromanage every move. “People have this misconception that all things are planned,” Saldanha says. “It’s such a chaotic sport that the best riders are able to live within this context of chaos, and able to sniff out subjectively, based on their experience, when might be the best time to go. A guy like Dan Martin has a great nose for that. And it’s very rider-dependent. A guy like Mike who started in the sport late is still developing that sense.”
Still, the team does meticulous preparation before each stage, developing preferred strategies and back-up plans. They produce a heat map that breaks the race down into a dozen or more individual segments, color-coding each segment with the ideal approach for each rider. Green means “conservative,” when you’re sitting in the peloton saving energy. Yellow means “switch on,” for example if it’s a stretch where the domestiques have to watch for other teams’ breaks. Red is for “attention,” if there’s a narrow course where positioning is crucial or a stage-defining climb. Blue is for “bonus,” after the support riders’ formal duties are done for the day and they can ride however they want.
Included alongside the heat map are individual notes about strategy at different stages of the race: for example, everything in stage 15 revolved around giving Martin a shot at the stage win and helping Woods chase the polka-dot king-of-the-mountain jersey. “What we’d like to do often falls victim to the thousand variables that come into play when the race actually goes on,” Saldanha admits. “I’d say we probably have a 30 to 40 percent hit rate on being able to follow through on the strategy.”
The Cyclist as Player-Coach
Once the race starts, the riders are on their own. Even radio contact can be sketchy if they get too far up the road from the team car, so the goal is to give the riders enough information on their bikes that they can function as player-coaches if needed. Saldanha and his team worked with Hammerhead to develop a module for their Karoo 2 bike computers that essentially substitutes for what the directeur sportif, a cycling team’s on-the-ground boss, would normally be yelling into a rider’s earpiece during an important climb: what the gradient is on every stretch of the ascent, how it changes around the next corner, how much farther you have to go to the top.
This CLIMBER module, which is similar to Garmin’s ClimbPro feature, was rushed out for this year’s Tour, and also made available to the general public at the same time. (See DC Rainmaker’s review for a deeper dive into its features.) It was then updated several times during the Tour itself, based on feedback from the riders, to optimize the details.
“A guy like Mike can take that tool and say, OK, I know that my sweet spot is, let’s say, 4 to 12 minutes at anything above 12 percent, where the other guys have to stand up,” Saldanha says. “And if it’s not a headwind, that’s a perfect storm of opportunity for success for Mike. So we use it to actually look for those opportunities live within a race.”
And Saldanha has further dreams for what the bike computer might show in the future. “I’d like to put in a visual of your anaerobic reserve battery, with our own algorithm that is rider-dependent and shows how much of your anaerobic reserve you’ve burnt in the climb, and at this rate how much are you going to burn by the top of the climb.”
That’s a really powerful idea, because anaerobic reserve (what I refer to as W’ in this article) is a great predictor of whether you’re going to crack on a climb. Any time you’re riding above your sustainable critical power, you’re depleting this battery; any time you drop back below critical power, the battery starts to recharge. Hit zero, and your pace will drop off a cliff. The fundamental challenge facing Woods on the Col de la Colombière was to judge his effort perfectly to exhaust his anaerobic battery right at the summit, then let it recharge on the descent.
The Trouble With Data
A big part of the fun of watching Woods on the Colombière was that I didn’t know if he’d judged his battery levels correctly. And neither did he! As he inched painfully up the climb, both victory and defeat remained plausible to rider and spectator alike. But would it be as fun if, by granting Woods a real-time readout of his own physiological state, you stripped that uncertainty away?
Saldanha gave me a peek at some of the vast troves of data the team crunches before and after races, using the files uploaded from each rider’s power meter and heart-rate monitor, as well as other data sources like continuous glucose monitors, pulse oximeters, and so on. For every stage of the Tour, for example, they estimate the caloric demands for each rider within a narrow range, then use the power data after the race to check their prediction, which is accurate 91 percent of the time. For stage 11, which featured two climbs of Mont Ventoux, the forecast for German powerhouse André Greipel, by far the biggest man on the team, was 5,816 calories. He ended up burning 6,080, a reminder that by some measures sprinters have to work harder than anyone in the mountains.
As well as the objective data, they collect lots of subjective data too. After every race, all the athletes, mechanics, and directors give themselves and each other five-point ratings in categories like fitness, health, race IQ, attitude, and equipment. If a pattern of low ratings shows up, that flags a problem to be addressed.
The list of things you can measure and graph and analyze these days is unending—which means Saldanha has to hold himself back: “We have to be careful how much data we collect on these guys. They’re not robots, you know?” And the same restraint applies to what he tells the riders. “It’s easy for me to see so much value in this that I overinform the riders of things they don’t need to know,” he says. “I’ve had to learn to sometimes look at this and be very content with saying nothing. Because they don’t need to know anything, there’s nothing to worry about, they’re good.”
As for the bigger philosophical question of what the onslaught of big data means for the sport, Saldanha recognizes the risks. “I like the way the Tour de France was raced this year. Although we could see Pogačar was head-and-shoulders above, there were elements of unpredictability, breakaways where you thought, Wow, why aren’t they chasing this down?” As a physiologist, he’s hungry for more and better data to help his athletes get the best out of themselves. But as a spectator, he enjoys the question marks, the surprises—and perhaps even the mistakes.
Woods didn’t make it. Belgium’s Dylan Teuns roared past him shortly before the summit, followed by two other riders. But Woods hung tough during the descent, and rallied during the final kilometer to get a spot on the podium with a third-place finish. “I can’t be disappointed, though,” he said after the race. “I raced to win. And sometimes when you race to win, you’re going to lose.”
For more Sweat Science, join me on Twitter and Facebook, sign up for the email newsletter, and check out my book Endure: Mind, Body, and the Curiously Elastic Limits of Human Performance.