Article

Assessing the Vertical Displacement of the Grand Ethiopian Renaissance Dam during Its Filling Using DInSAR Technology and Its Potential Acute Consequences on the Downstream Countries

1
Schmid College of Science and Technology, Chapman University, Orange, CA 92866, USA
2
Center of Excellence in Earth Systems Modeling and Observations, Chapman University, Orange, CA 92866, USA
3
Department of Environmental Sciences, Faculty of Science, Alexandria University, Moharem Bek, Alexandria 21522, Egypt
4
National Water Research Center, P.O. Box 74, Shoubra El-Kheima 13411, Egypt
5
Water Resources Civil Engineering Department, The University of Texas at Arlington, Arlington, TX 76019, USA
6
Jet Propulsion Laboratory, California Institute of Technology, Pasadena, CA 91101, USA
7
Machine Learning and Assistive Technology Lab (MLAT), Chapman University, Orange, CA 92866, USA
8
Fowler School of Engineering, Chapman University, Orange, CA 92866, USA
9
Egyptian Ministry of Water Resources & Irrigation, Cairo 12685, Egypt
*
Author to whom correspondence should be addressed.
Remote Sens. 2021, 13(21), 4287; https://doi.org/10.3390/rs13214287
Submission received: 7 August 2021 / Revised: 21 October 2021 / Accepted: 21 October 2021 / Published: 26 October 2021
(This article belongs to the Section Engineering Remote Sensing)

Abstract

:
The Grand Ethiopian Renaissance Dam (GERD), formerly known as the Millennium Dam, is currently under construction and has been filling at a fast rate without sufficient known analysis on possible impacts on the body of the structure. The filling of GERD not only has an impact on the Blue Nile Basin hydrology, water storage and flow but also poses massive risks in case of collapse. Rosaries Dam located in Sudan at only 116 km downstream of GERD, along with the 20 million Sudanese benefiting from that dam, would be seriously threatened in case of the collapse of GERD. In this study, through the analysis of Sentinal-1 satellite imagery, we show concerning deformation patterns associated with different sections of the GERD’s Main Dam (structure RCC Dam type) and the Saddle Dam (Embankment Dam type). We processed 109 descending mode scenes from Sentinel-1 SAR imagery, from December 2016 to July 2021, using the Differential Synthetic Aperture Radar Interferometry technique to demonstrate the deformation trends of both—the GERD’s Main and Saddle Dams. The time series generated from the analysis clearly indicates different displacement trends at various sections of the GERD as well as the Saddle Dam. Results of the multi-temporal data analysis on and around the project area show inconsistent subsidence at the extremities of the GERD Main Dam, especially the west side of the dam where we recorded varying displacements in the range of 10 mm to 90 mm at the crest of the dam. We conducted the current analysis after masking the images with a coherence value of 0.9 and hence, the subsequent results are extremely reliable and accurate. Further decomposition of the subsiding rate has revealed higher vertical displacement over the west side of the GERD’s Main Dam as compared to the east side. The local geological structures consisting of weak zones under the GERD’s accompanying Saddle Dam adds further instability to its structure. We identified seven critical nodes on the Saddle Dam that match the tectonic faults lying underneath it, and which display a varying degree of vertical displacements. In fact, the nodes located next to each other displayed varying displacement trends: one or more nodes displayed subsidence since 2017 while the other node in the same section displayed uplift. The geological weak zones underneath and the weight of the Saddle Dam itself may somewhat explain this inconsistency and the non-uniform vertical displacements. For the most affected cells, we observed a total displacement value of ~90 mm during the whole study period (~20 mm/year) for the Main Dam while the value of the total displacement for the Saddle dam is ~380 mm during the same period (~85 mm/year). Analysis through CoastSat tool also suggested a non-uniformity in trends of surface water-edge at the two extremities of the Main Dam.

Graphical Abstract

1. Introduction

The Grand Ethiopian Renaissance Dam (GERD) located on the Blue Nile River in Ethiopia, promises a massive reservoir, which has been expanding according to a series of satellite images, with a spatial extent of about 1763.3 km2 and capacity of more than 70 billion cubic meters of water [1,2]. The filling process and its implications on the downstream river hydrology have been recently monitored using Sentinel-1 Synthetic Aperture Radar (SAR) and Sentinel-2 optical imagery [3]. It is expected that the GERD filling and operation, without a full agreement between Ethiopia and, Sudan and Egypt, would not only pose a direct danger on the water, food, and energy nexus in Egypt, but also would be a major direct threat to Sudan and Egypt in case of any possible failure [4]. The lack of agreement on many issues including filling and operation processes of the GERD reservoir as well as the safety of the GERD’s Main and Saddle Dam’s structures along with the lack of consideration of the negative future implications to riparian countries namely, Egypt and Sudan is a serious issue [5,6,7,8,9]. Most concerning is the possibility of a massive dam failure that can occur due to natural or man-made causes. Earthquakes, changes in temperature, precipitation and other hydrological variables are some of the natural causes of land deformation, while deforestation, mismanagement of agricultural land, and building of dams are some of the man-made causes [10,11]. Scientists classify land deformations according to horizontal and vertical displacements. Weight of a structure, pressure caused by wind or water, soil erosion, are some of the reasons for subsidence or uplift, the two types of vertical displacement. These can sometimes also cause horizontal movements normal to the centreline of the dam [12,13]. Land deformation has an adverse impact on the ecosystem at large and in some cases, even loss of life. It is therefore paramount to have regular and accurate monitoring of different land features, something that in recent years has been made possible by the introduction and development of different monitoring land deformation techniques, using both geodetic and non-geodetic methods. Some of the geodetic methods include photogrammetry, total station, precise levelling, Global Navigation Satellite Systems (GNSS) while some of the non-geodetic methods include piezometers, inclinometers, optical fiber sensors and Interferometric Synthetic Aperture Radar (InSAR). One of the most important structures requiring regular monitoring is the dams that can be classified into concrete dams (made of concrete) and embankment dams (made of earth or rock fill) [14]. There have been multiple studies conducted around dam deformation utilizing remote sensing techniques. Maltese et al. [15], in their recent study, analyzed the annual displacements at the crest of the Castello dam in Italy using a synergistic use of Sentinel-1A images, Landsat 8 Thermal Infrared Sensor (TIRS) thermal images, and Global Navigation Satellite System (GNSS). As part of the study, water surface was estimated with high accuracy (r2 = 0.97), water and air temperatures were compared, and displacements of the dam crest were recorded using GNSS and quasi-Persistent Scatterer (PS–InSAR). This study highlighted the usage of satellite monitoring as useful tool for detailed and accurate analysis. Another work by Wang et al. [16] studied the coastal dams along the Yellow River Delta in China and generated coastal dam digital elevation model (DEM) over the next 10, 30 and 80 years as part of flooding scenarios simulation. This was achieved by combining unmanned aerial vehicle (UAV) Light Detection and Ranging (LiDAR) with small baseline subsets (SBAS) InSAR results utilizing Sentinel-1 images. The study of the deformation rate occurs specifically using the SBAS technique. Even the GERD has been looked at by analyzing its vertical displacement using satellite observations [1,17]. One of these studies by Madson and Sheng [1], compared digital surface models (DSM) to spatially overlapping spaceborne altimeter products as the Geoscience Laser Altimeter System (GLAS) instrument on board the Ice, Cloud, and land Elevation Satellite (ICESat) platform. The DSMs tested in the study were generated from Shuttle Radar Topography Mission (SRTM) data, Advanced Land Observing Satellite (ALOS) data, and from the Advanced Spaceborne Thermal Emission and Reflection Radiometer (ASTER) data. These DSMs were overlaid as mosaics in order to cover the entire region, followed by projecting it to UTM Zone 36N (EPSG: 32636) using the WGS84 ellipsoid. The maximum flexural vertical response was found to be 11.99 cm while the corresponding horizontal response was 1.99 cm. Similarly, the vertical and horizontal displacements were found to be 38–55% and 34–48% of the full deformation, respectively. In the second study by Chen et al. [17], an approach was developed to predict large-scale land deformation using Gravity Recovery and Climate Experiment (GRACE) mission and the subsequent GRACE-Follow On (FO) mission. They kept the 5, 10, 15-year filling as a reference and calculated the estimated vertical displacement. The results displayed subsidence and estimated the western and eastern parts of the reservoir to move towards the center while the northern part moves in the southern direction. They further found out that the GRACE-FO mission could only detect 15% of the deformation by the GERD reservoir. Another study using the Persistent Scatterer (PS-InSAR) was performed on the rockfill at the Ajuare Dam in the northern part of Sweden along the Ume River that drains into the Gulf of Bothnia [14]. The results from the study stated that the structure is subsiding at the center with values up to 5 mm/year while the extremities are more stable with rates ranging from −0.7 to 0.9 mm/year. The downstream area displayed light uplift. The results also highlighted a horizontal movement towards the west, which is toward the reservoir with rates up to 2 mm/year. The geodetic measurements were less but comparing with the available ones displayed similar general trends. There are some limitations to the technique, namely, stability in atmospheric conditions and the inability to provide direct information regarding issues arising inside the dam. Yet, this also provides an added confidence in utilizing SAR satellite images in monitoring and measuring horizontal and vertical displacements of a dam or any other man-made structure.
In this work, we analyze the deformation patterns of the GERD project, including the Main and Saddle Dams, using Differential Synthetic Aperture Radar Interferometry (DInSAR) technique over Sentinel-1 data for five years from December 2016 to July 2021. The DInSAR technique enables accurate satellite monitoring under all-weather conditions and even in absence of any ground equipment [18]. There are multiple studies [19,20,21,22,23] that used the DInSAR methodology to monitor and analyze displacements across land and structures. Moghadam et al. [23], in their study performed the DInSAR stacking method at a prominent Coal Seam Gas (CSG) site, found that the inversion of INSAR deformation maps can help in solving the uncertainties arising out of low-resolution seismic acquisitions. Jiang et al. [21], in their study, compared the feasibility of using PS-InSAR, stacking and 2-pass DInSAR methodologies in identifying land subsidence at the Wuda coalfield in Northern China. Their results show that the stacking analysis provided accurate results when compared with the coal fire data obtained through on-field surveys. Though it is always beneficial to have field measurements complimenting satellite measurements, the results obtained through this technique can be considered accurate [18]. In our work, we investigate the deformation patterns associated with the first filling process as a baseline to show the possible impacts due to the second filling, and we observe that increasing the water storage in the GERD reservoir, will pose more risk to the structure. Utilizing the CoastSat tool for water edge detection, we validated the results over the GERD’s Main Dam, which shows an opposing trend of water edges at two of the extremities of the Main Dam wall. Later sections in this manuscript will explain in much depth some of the statements made here. This study will provide a solid basis for current concerns on the safety of GERD.

2. Data and Methods

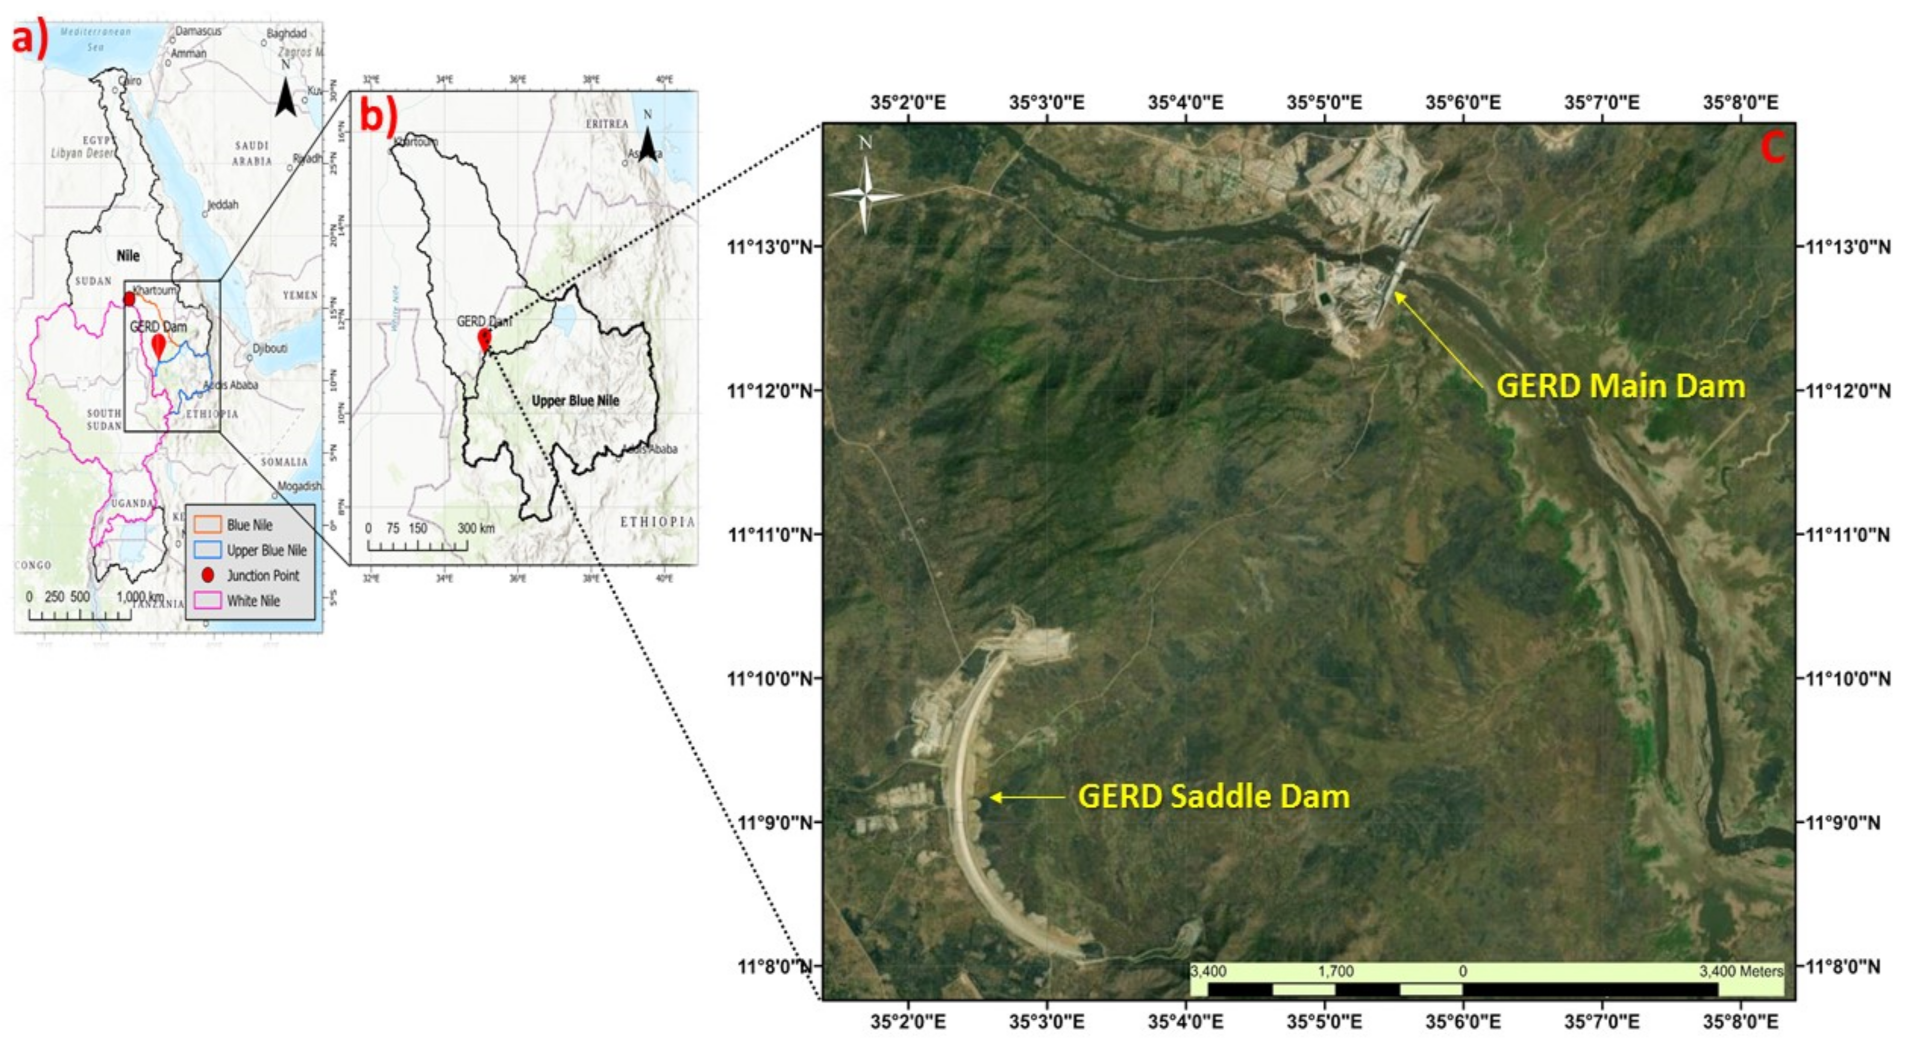
2.1. The GERD Project (Main and Saddle Dams)
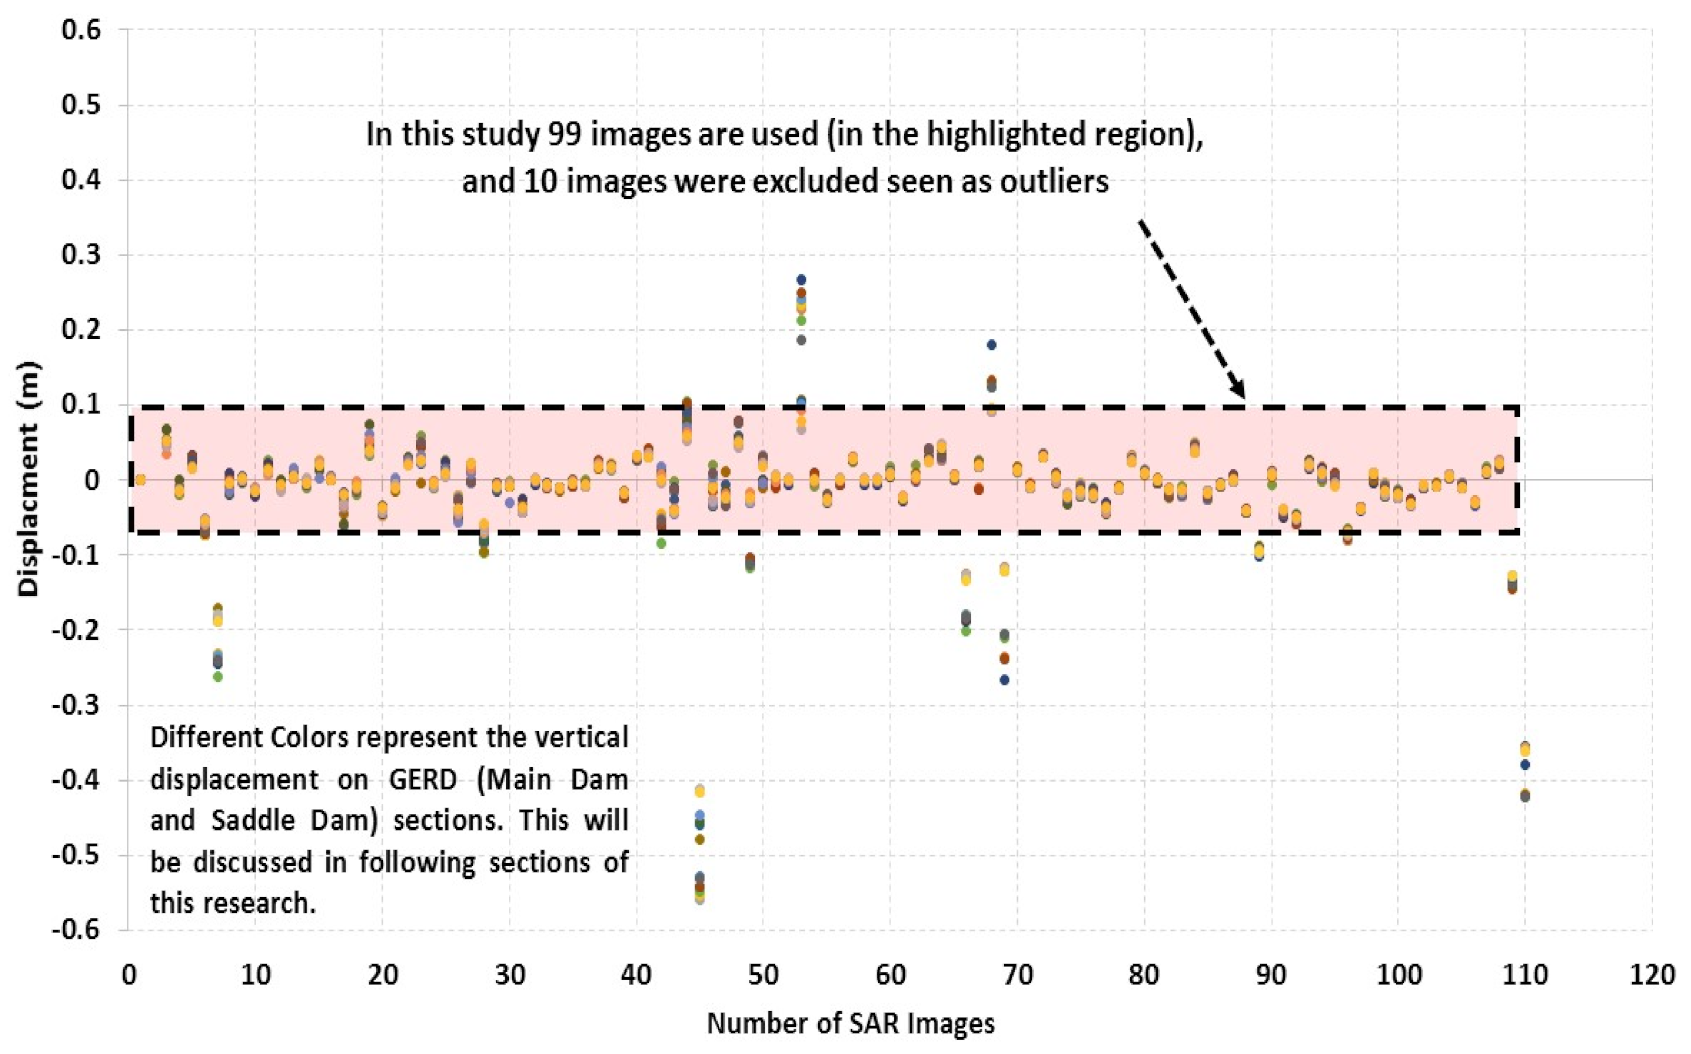
The GERD location, which is the region of interest in the current work, is located 15 km east of the Ethiopia-Sudan border inside Ethiopia, on the Blue Nile River (Figure 1a,b). The GERD’s Main Dam is a gravity dam made from roller compacted concrete (RCC) with a maximum height of 175 m, length of around 2 km at the crest elevation and expected to hold a volume of 10 million cubic meters (MCM). According to the construction progress, the Main Dam consists of three sections: left bank, central section and right bank. The central section is at a lower level compared to the left and right banks in order to allow good maintenance of the body of the dam, as well as natural flooding during the rainy season. The downstream part of the left bank and the right bank contain the powerhouses with 375 megawatt (MW) each [24]. The Saddle Dam of GERD, which is 60 m in height and approximately 5 km in length, was constructed in order to increase storage capacity, permeability, and erosion control. It is a concrete-faced rockfill (CFRD) and its embankment volume is 15 MCM. During the dry season, a river diversion system discharges up to 14,700 m3/s of water using four culverts while a temporary stepped spillway structure has been constructed in the central section to prevent dam overtopping during the wet season. Further, three spillways have been constructed to protect against the Probable Maximum Flood (30,200 m3/s peak and 18,000 m3/s routed discharge) at GERD. One of them is the aforementioned crest-spillway on the Main Dam; another one is located on a saddle area and acts as the main service gated spillway, and finally, the side channel un-gated emergency spillway [25]. Figure 1c shows the Main and the Saddle Dams along with the left and right banks.

2.2. Data Used

a.
Satellite Synthetic Aperture Radar and Optical Imagery
Sentinel-1A, managed by the European Space Agency (ESA), has been functional since 2014 with a revisit time of 12 days, and resolution of (5–20) × (5–40) m based on the acquisition mode. It is part of a constellation of two polar-orbiting satellites that perform C-band SAR imaging [26]. In this work, we used the Interferometric Wide Swath (IW) acquisition mode, which is associated with land applications. We utilized the level-1 Single Look Complex (SLC) product that includes complex data of amplitude and phase necessary for interferometric processing. This data product contains three sub swaths, namely IW1, IW2 and IW3 with 9 bursts. This is important for Interferogram creation when we acquire two radar images with the same geometry over the same area.
b.
Sentinel-2 magery for CoastSat
Sentinel-2, managed by the European Space Agency as part of the Copernicus mission, is a group of two polar-orbiting satellites placed in the same sun-synchronous orbit. Its wide swath width of 290 km and a higher revisit time of 10 days is very useful at monitoring land surface conditions. The 13 spectral bands of this satellite are beneficial in classifying land cover/change, atmospheric correction, cloud/snow separation and so on [27]. This manuscript utilized the Level 1C products, which provide top-of-atmosphere reflectance in cartographic geometry. The bands that were used for processing are the red, green, blue, near-infrared (NIR) and the short-wave infrared (SWIR1) [28,29].
c.
Displacement Accuracy Assessment at different Coherence values
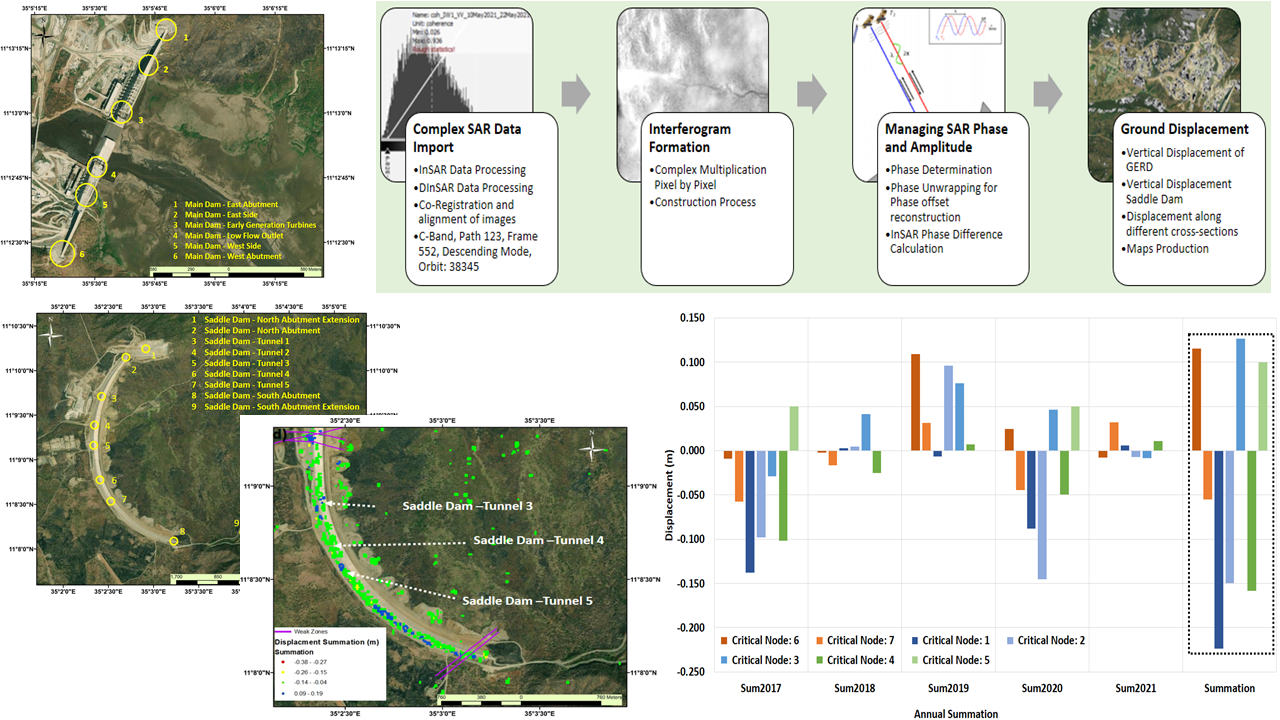
In this work, we selected 15 different cross-sections at different locations at the GERD’s Main and Saddle Dams to calculate possible vertical average displacement using the DInSAR technique. In later sections of this manuscript, we will introduce the locations upon which we conducted our analysis and presented our findings. However, displacement accuracy assessment is quite a crucial step to ensure the validity of our observations and results. We used ~109 SAR images starting from December 2016, until July 2021, for calculating average displacements at the aforementioned 15 cross-sections with coherence values set to at least 0.5. Here, coherence refers to a specific relationship between two successive SAR images, in our case known as the master and the slave images [30]. The coherence factor along with the interferometric phase is key here to show strong similarities. In order to ensure that the observed vertical displacements are accurate and to avoid misleading conclusions, one requires a coherence factor close to one, which would validate the usage of these images for interferometric processing. As it is well known, loss of coherence can produce poor interferometric results that can be due to different reasons. In our situation, coherence loss is due to temporal, geometric and volumetric decorrelation [30]. As such, our results presented here are quite accurate owing to the high coherence values adopted, which are >0.9 over the GERD’s Main and Saddle Dams and >0.5 over the surrounding areas. We conducted a thorough statistical analysis to highlight the acceptable threshold of vertical displacement between each of the two successive images that were set to +/− 0.1 m (Figure 2).
In Figure 2, the vertical axis represents the value of the average displacement for all 15 cross-sections, shown here as colored circles that might overlap hence in some cases appear as less than 15 points, while the horizontal axis represents the cumulative number of images used in the analysis covering the period from December 2016 to July 2021. In summary, each vertical column of these colored points represents the average displacement values for a single DInSAR displacement using the cumulative number of satellite images at that point for analysis. Accordingly, ten images, (falling outside the +/− 0.1 m) were discarded from the analysis as they showed unreliable results. We believe that displacements outside the highlighted window are abnormal results that are difficult to occur in nature. Displacement recalculations were undergone yet showed no enhancement; therefore, a specific buffer zone of displacement values between +/− 0.1 m was determined to evaluate the resulting images.

2.3. Methods

SAR obtains the electrical and geometrical properties of the surfaces by using pulses at microwave frequencies. In the following, we will discuss some of the methods used in this research.
a.
Synthetic Aperture Radar Interferometry (InSAR)
An Interferogram shows the deformation between two SAR images by calculating the phase difference of these two products. Fringes with one color cycle, which is equivalent to 2π create the phase referred to here. The coherence between these two images is also provided through the cross-correlation between the master and slave images at the pixel level ranging from 0 representing low coherence to 1 representing high coherence. InSAR is a well-known and well-understood mathematical technique that uses the time difference between two sets of pulses to achieve a much higher resolution than it would have been obtained with a single pulse. Thus, the technique allows the creation of a virtual antenna of size significantly larger than the actual physical antenna. From this the name of synthetic aperture. The satellite sensor and mode must be the same for all the images used in InSAR analysis. InSAR is mainly used to obtain the spatial vertical structure information of ground objects, reconstructing digital elevation model (DEM), detection of land deformation by natural causes such as earthquakes or landslides as well as measuring the displacement rates of man-made structures such as buildings and dams. The basic InSAR processing involves importing SLC images, aligning the images, complex multiplying each pixel, reconstructing the absolute phase offset and finally geocoding using DEM. This technique results in two important parameters namely, the interference phase and the coherence coefficient. Regarding the phase, it has been widely used in the research of DEM generation, earthquake/volcano/glacier/surface subsidence and marine physical parameter acquisition. In recent years, the coherence coefficient, another important parameter obtained by InSAR, has been gradually recognized and applied to the basic analysis of surface characteristics and the inversion of surface vegetation height and biomass. The SAR interferometric technology implicitly assumes that the signal echo of each pixel in the image is scattered from a scattering center on a reference plane at a fixed height, so the measured phase difference is the same as this. The height of the reference plane is proportional. However, due to the presence of ground slope, roughness and other factors, as well as the influence of surface vegetation and body scattering, the actual process of electromagnetic wave scattering by ground objects is extremely complicated. Atmospheric conditions, especially the water vapor and clouds, at the time of image acquisitions could cause a delay in signals. Temporal and geometric decorrelation, volume scattering and processing errors could cause disruption in the interferometric phase. In such a scenario, the Goldstein filter, which uses fast Fourier transformation (FFT), can be used to improve the signal-to-noise ratio of the image [31].
b.
Differential Synthetic Aperture Radar Interferometry (DInSAR)
In this section, we discuss the DInSAR methodology used here for measuring both the vertical displacement and displacement in the line of sight (LOS). This takes place when we simulate and remove the phase component from the interferometric phase using the known topography and baseline information of the reference surface. A 2-Pass DInSAR calculates the displacement using an external DEM while a 3-Pass DInSAR does it when we estimate the topography initially. Employing this method, we calculated the difference in the corresponding phases between two images acquired at different times over the reference surface to obtain the interferometric phase by subtracting the later image from the former one. The underlying assumption in this method is that the reference surface remains stable and therefore, we can calculate actual deformation. If the deformation is positive, it indicates land subsidence as the distance between the ground and satellites increases. Some of the limitations of this method are the spatial-temporal decorrelation, atmospheric disturbances on the signals causing errors and the one-dimensional calculation of the movements. An important precaution when using DInSAR is to only utilize pixels with a low noise component [14]. In this work, we utilized and co-registered Sentinel-1 images in the descending orbit mode in order to exploit the phase difference of the acquisitions. This involved creating a stack containing both products and then making use of the image statistics to align both products at sub-pixel accuracy. We only used a part of the sub-swath for co-registration with a size that depends on the target footprint. Following this, we performed accurate geocoding to allow the projection of SAR coordinates (azimuth, range) into a conventional cartographic system (longitude, latitude) and the projection of the DEM to the SAR coordinates. To increase the quality of the co-registration, we applied S-1 Enhanced Spectral Diversity (ESD) on the stack generated by the Back Geocoding; this applies range and azimuth shift corrections to the secondary image. The equation below gives the stability of the phase measured in amplitude dispersion DA, where σA is the pixel’s standard deviation and μA is the mean amplitude value [14].
D A = σ A / μ A
A smaller DA denotes higher amplitude. If a pixel with a higher amplitude does not differ substantially over the acquisitions, then the pixel exhibits minor phase dispersion and hence, is more reliable. The cross-multiplication of the master image with the conjugate of the slave image leads to the formation of an Interferogram. The amplitude of both images is multiplied and the phase difference between the two images is extracted (Figure 3a). Coherence is calculated as a separate raster band and shows how similar each pixel is between the secondary and reference image on a scale from 0 to 1. Areas of high coherence will appear bright whereas areas with poor coherence will be darker (Figure 3b). In the image, vegetation exhibits poor coherence while buildings exhibit very high coherence. To solve the issue of ambiguity arising due to the interferometric phase lying within a scale of 2π, phase unwrapping is done by merging phase difference between neighboring pixels. Thus, the unwrapped results give the relative vertical displacement between pixels of two images. For the unwrapped results to be considered reliable, the input coherence should be high. The suggestion by ESA in their interferometry tutorial is 0.3 whereas in our work, we have used a coherence value of 0.9 [30]. These results are in the form of a continuous raster and not a metric measure. To convert the radian units into absolute displacements, the Phase to Displacement operator is applied. It translates the phase into surface changes along the LOS, the line between the sensor and a pixel, in meters. Accordingly, positive values mean uplift and negative values mean subsidence of the surface. In this work, we applied the DInSAR technique able to detect a displacement magnitude of <few cm and provides vertical displacement accuracy of 1 cm and spatial resolution of 17 m per pixel is used here.
c.
CoastSat
CoastSat is an open-source tool that can retrieve Landsat and Sentinel-2 images by utilizing Google Earth Engine (GEE) API in Python [28]. The two main capabilities of the toolkit are shoreline detection and beach slope estimation. If measured water levels are available, the toolkit can detect shorelines after tidal correction too. Using this tool, we were able to retrieve satellite images from the Landsat 5 (TM), Landsat 7 (EMT+), Landsat 8 (OLI) Tier 1 collections, and Sentinel-2 (MSI) Level-1C products representing top-of-atmosphere (TOA) reflectance. The pre-processing steps include cloud masking, enhancing the spatial resolution using the higher resolution panchromatic band and principal component analysis. We utilized an algorithm for shoreline detection that follows two main steps, namely, the image classification into four classes and the border segmentation at sub-pixel resolution. As part of image classification, a neural network classifier is used to label each pixel of the image as one of four classes—‘sand’, ‘water’, ‘white-water’ and ‘other land features’. There are 20 independent variables including multispectral bands, some common spectral indices and the variance of each multispectral band and spectral index. Following the image classification, we applied the Modified Normalized Difference Water Index (MNDWI) to each of the classified images to extract the boundary between sand and water. The equation below shows the calculation of MNDWI where SWIR1 is the pixel intensity in the SWIR1 band while G is the pixel intensity in the green band [28].
M N D W I = S W I R 1 G S W I R 1 + G
We then generated a histogram of MNDWI values with ‘sand’ pixels having positive MNDWI values while ‘water’ pixels having negative MNDWI values. To find the ‘sand’/’water’ threshold for maximizing inter-class variance between sand and water, we applied Otsu’s threshold algorithm [32]. As a final step, we applied the Marching Squares algorithm [33,34] to compute the iso-valued contour on the MNDWI image at sub-pixel resolution.

3. Results

In this manuscript, we selected different cross-sections across the GERD’s Main and Saddle Dams based on the proximity with each other and with the location of known geological weak zones for vertical displacement analysis [35]. Thus, we identified six and nine cross-sections over the Main and Saddle Dams, respectively along which we conducted our analysis (Figure 4). Furthermore, utilizing DInSAR technique, we performed a time series analysis over the previously mentioned fifteen individual cross-sections to present vertical displacement trend lines. To maintain high and adequate accuracy we selected a coherence threshold for values ranging from 0.5 to 0.9 between successive images. Using this approach, we were able to maintain data continuity for each cross-section and improve our ability to detect displacement change along the time of the study. It is important to note that the images used in the analysis were obtained from the descending orbit alone, and not from the ascending orbit due to the unavailability of images in the ascending orbit of Sentinel-1 in the region of interest. The overlap between ascending and descending orbit is only until March 2017, post which there is an unavailability of ascending orbit images.

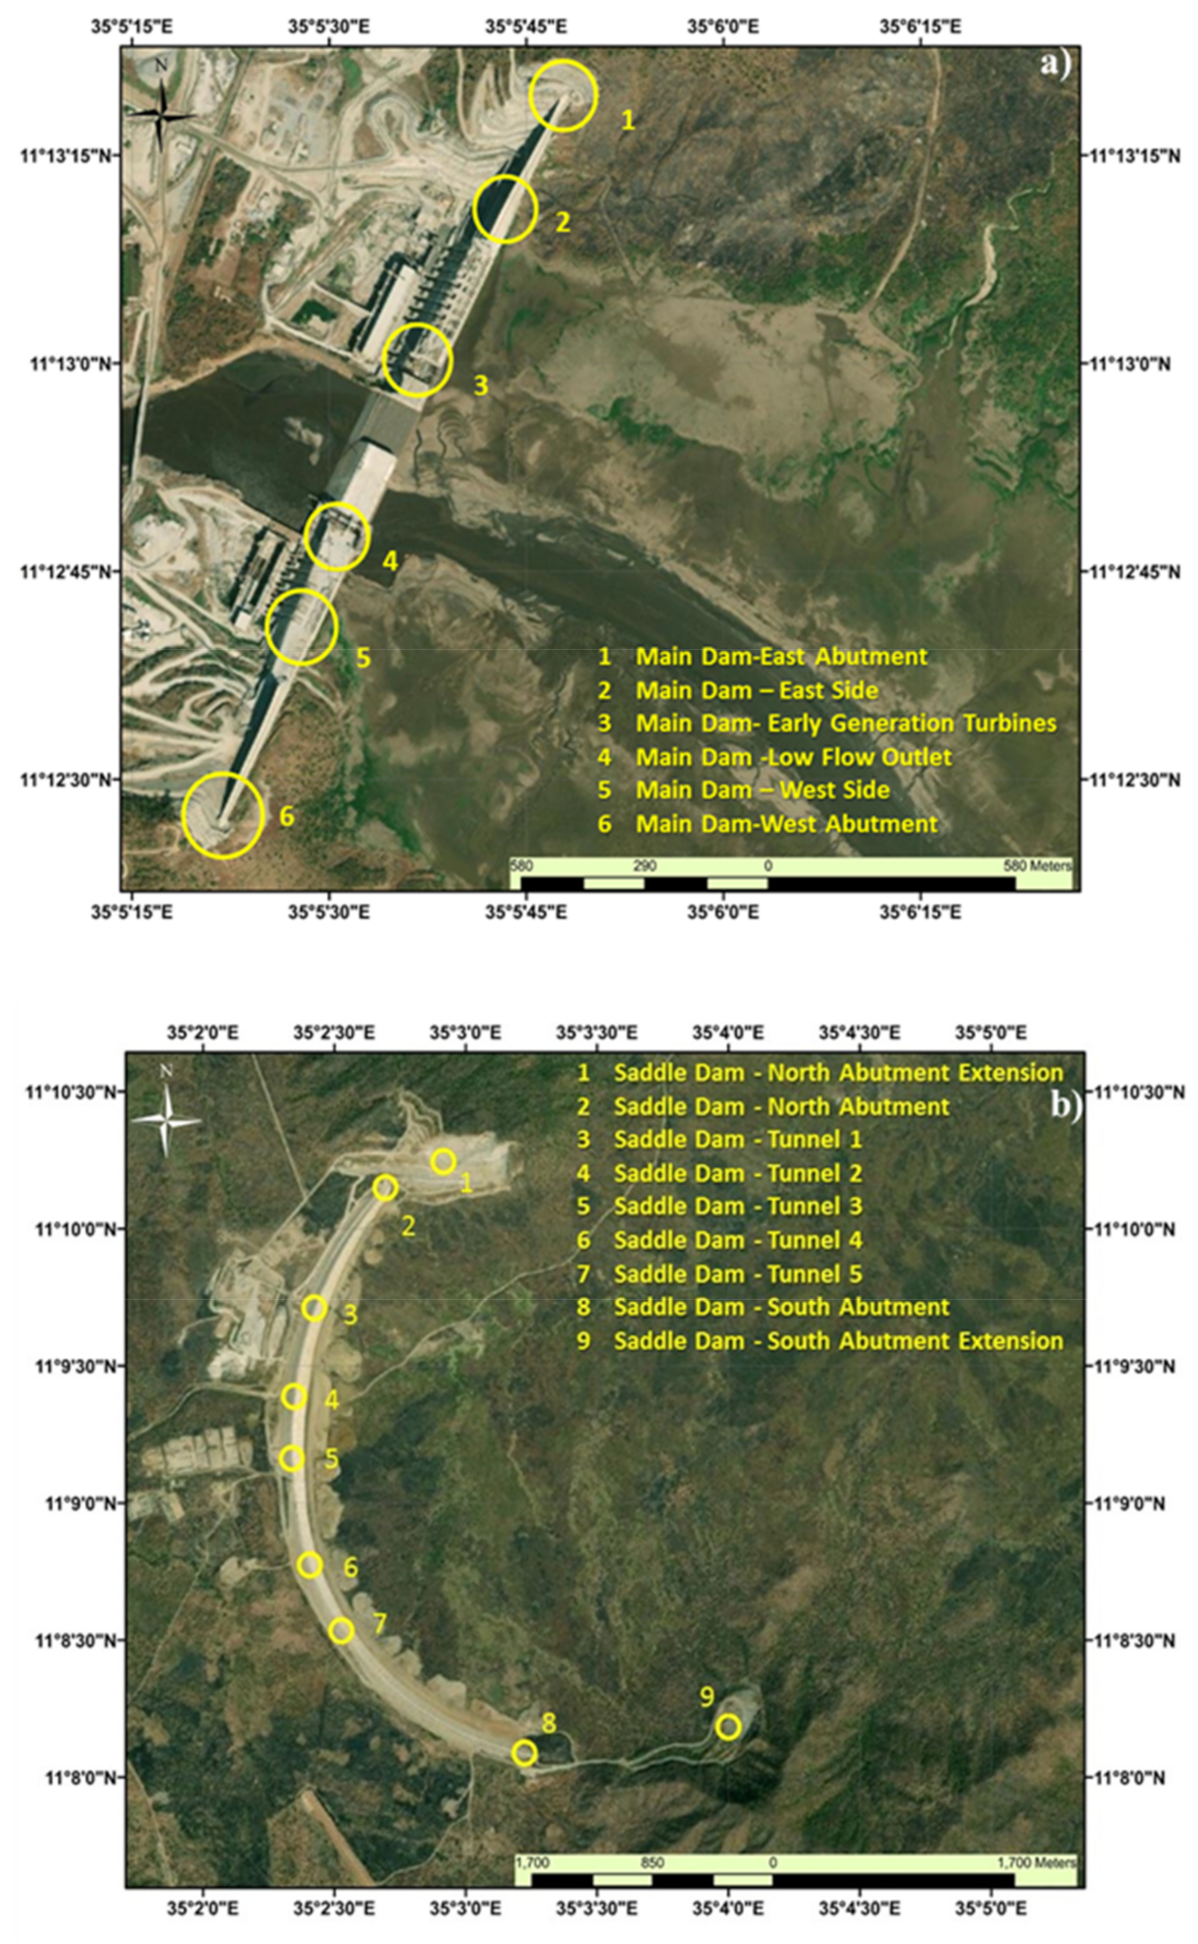
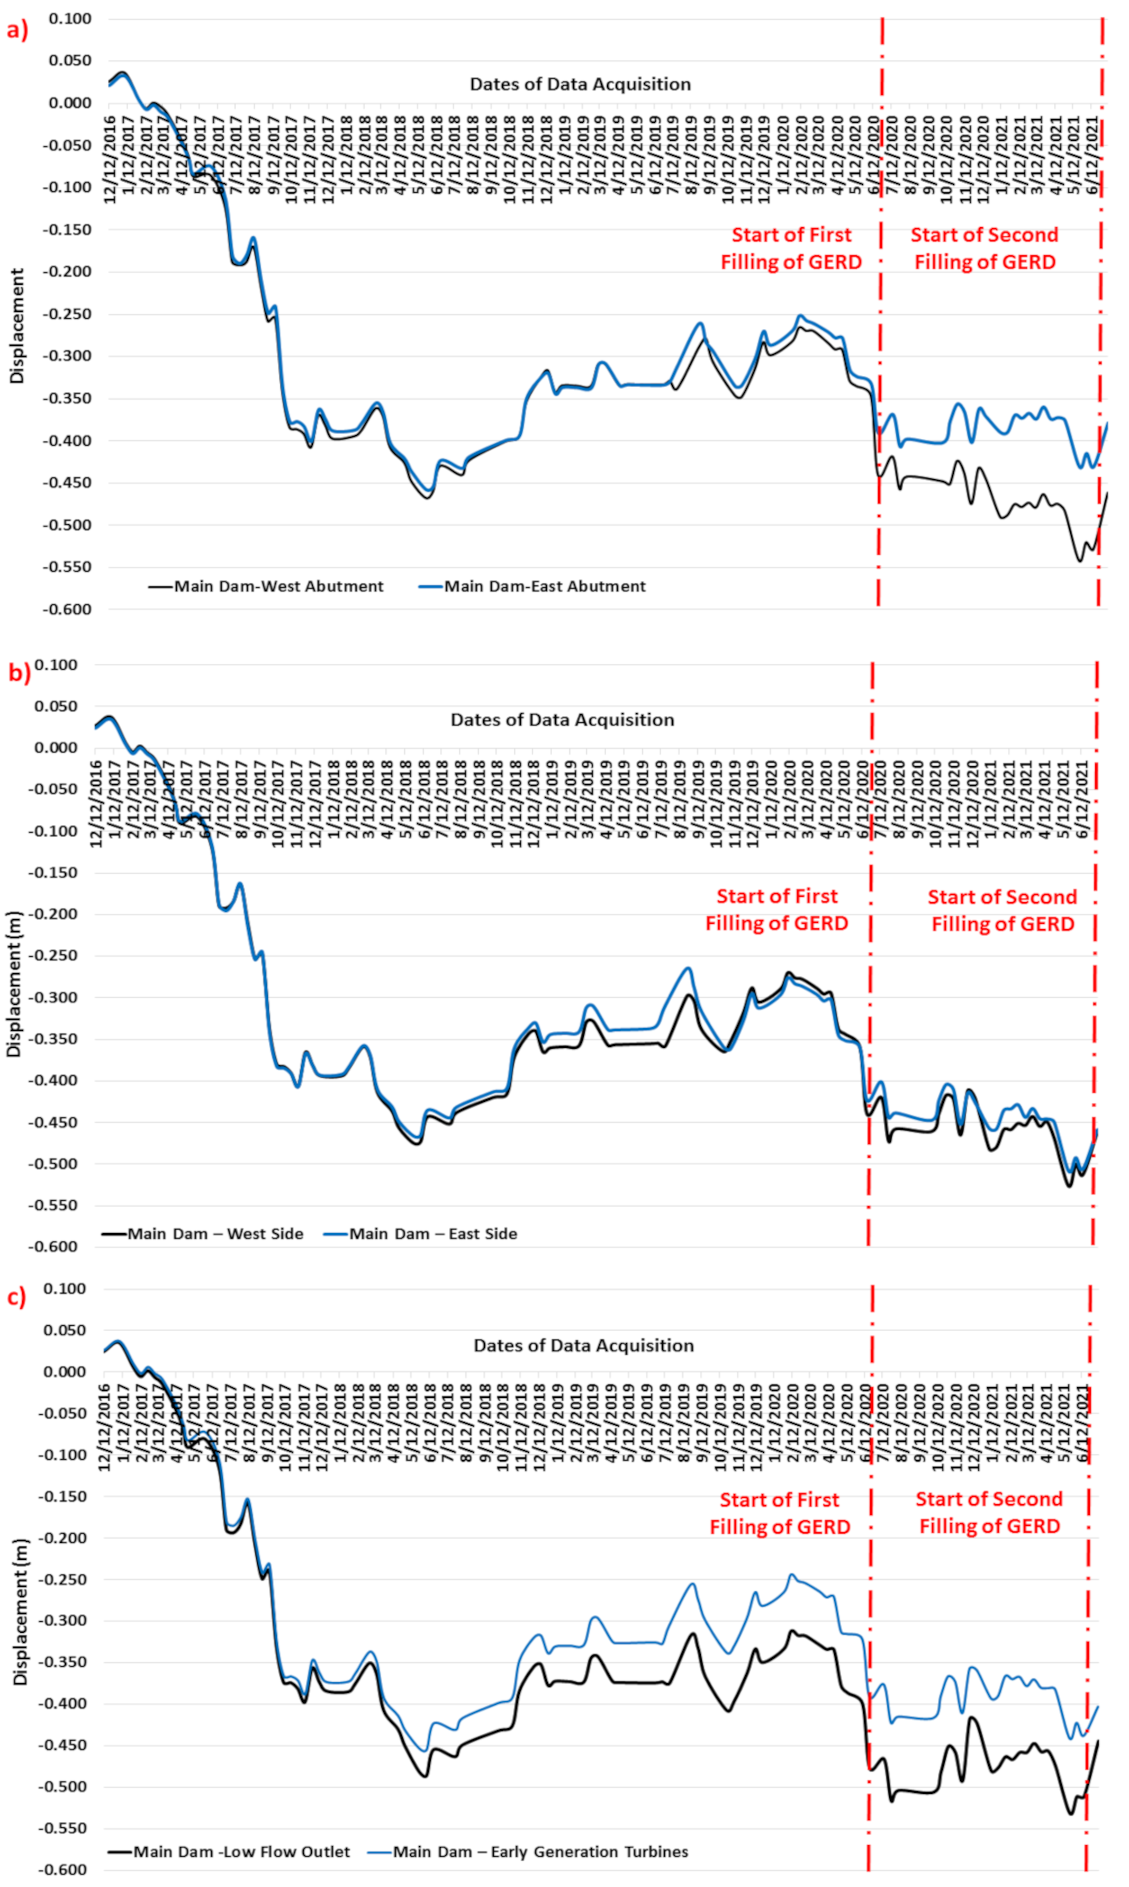
3.1. The Monitoring of the Main Dam Displacement over Six Cross-Sections

Figure 5 shows the vertical displacement in meters over the six cross-sections of the Main Dam highlighted in Figure 4a. Figure 5a shows the displacement for cross-sections 1 and 6, Figure 5b for cross-sections 2 and 5, and Figure 5c for cross-sections 3 and 4. We selected specific combinations of the cross-sections identified on the Main Dam to compare them in terms of displacement rate and degree of uniformity at these different cross-sections. The displacement rate was calculated for the entire period from December 2016 to July 2021 in association with the different filling periods that are identified by the red dashed-dotted lines indicating the start of the GERD first and second filling periods. The results indicate substantial subsidence at every cross section since 2016 with lack of uniformity between the sections under comparison. The alarming observation that is evident from the analysis is the fact that the intensity of subsidence for each pair of cross-sections is different and lacks homogeneity. This is especially clear for the east and west abutments where Figure 5a shows a notable difference in rate of displacement once the first filling period started. The west abutment showed a greater rate of subsidence than the east abutment. Until that point, the rate of displacement is relatively similar compared to the rate following the beginning of the first filling period. The increasing gap between both curves suggests that over time the structure might seriously suffer due to the uneven rate of displacement. Figure 5b, which shows the displacement of the Main Dam’s east and west side, does not display a considerable change in rate of displacement such as the other pairs of cross-sections discussed in this section. However, with acceptable uniformity, both these cross-sections have undergone subsidence. Figure 5c, which shows the displacement of the early generation turbines and low flow outlet, displays a difference in rate of displacement that has become evident since November 2017. Since the beginning of the first filling period, the difference in subsidence appears to be greater for both sides but with relatively uniform displacement rates.
Due to the unavailability of data (for the same satellite Sentinel 1) before October 2016, it is difficult to infer the rate of land subsidence in the area before the start of the GERD project construction. The project started mid-2011, so we focused on the sections completed since 2017, namely the Main Dam eastern and western sides as well as the entire Saddle Dam, in order to avoid external factors related to the construction period. Successive satellite images show the completion of the eastern and western sides and reaching the Main Dam crest level by the end of 2017. Therefore, our notable displacement pattern change has occurred on the Main Dam sides rather than the middle section where we can observe a significant delay in the construction process. It is also noteworthy that our analysis shows that the observed change in displacement has a clear relationship with the rainy season, as negative displacement occurs during the dry season from April to June of each year, and positive displacement rates occur during the rainy season starting from July each year.

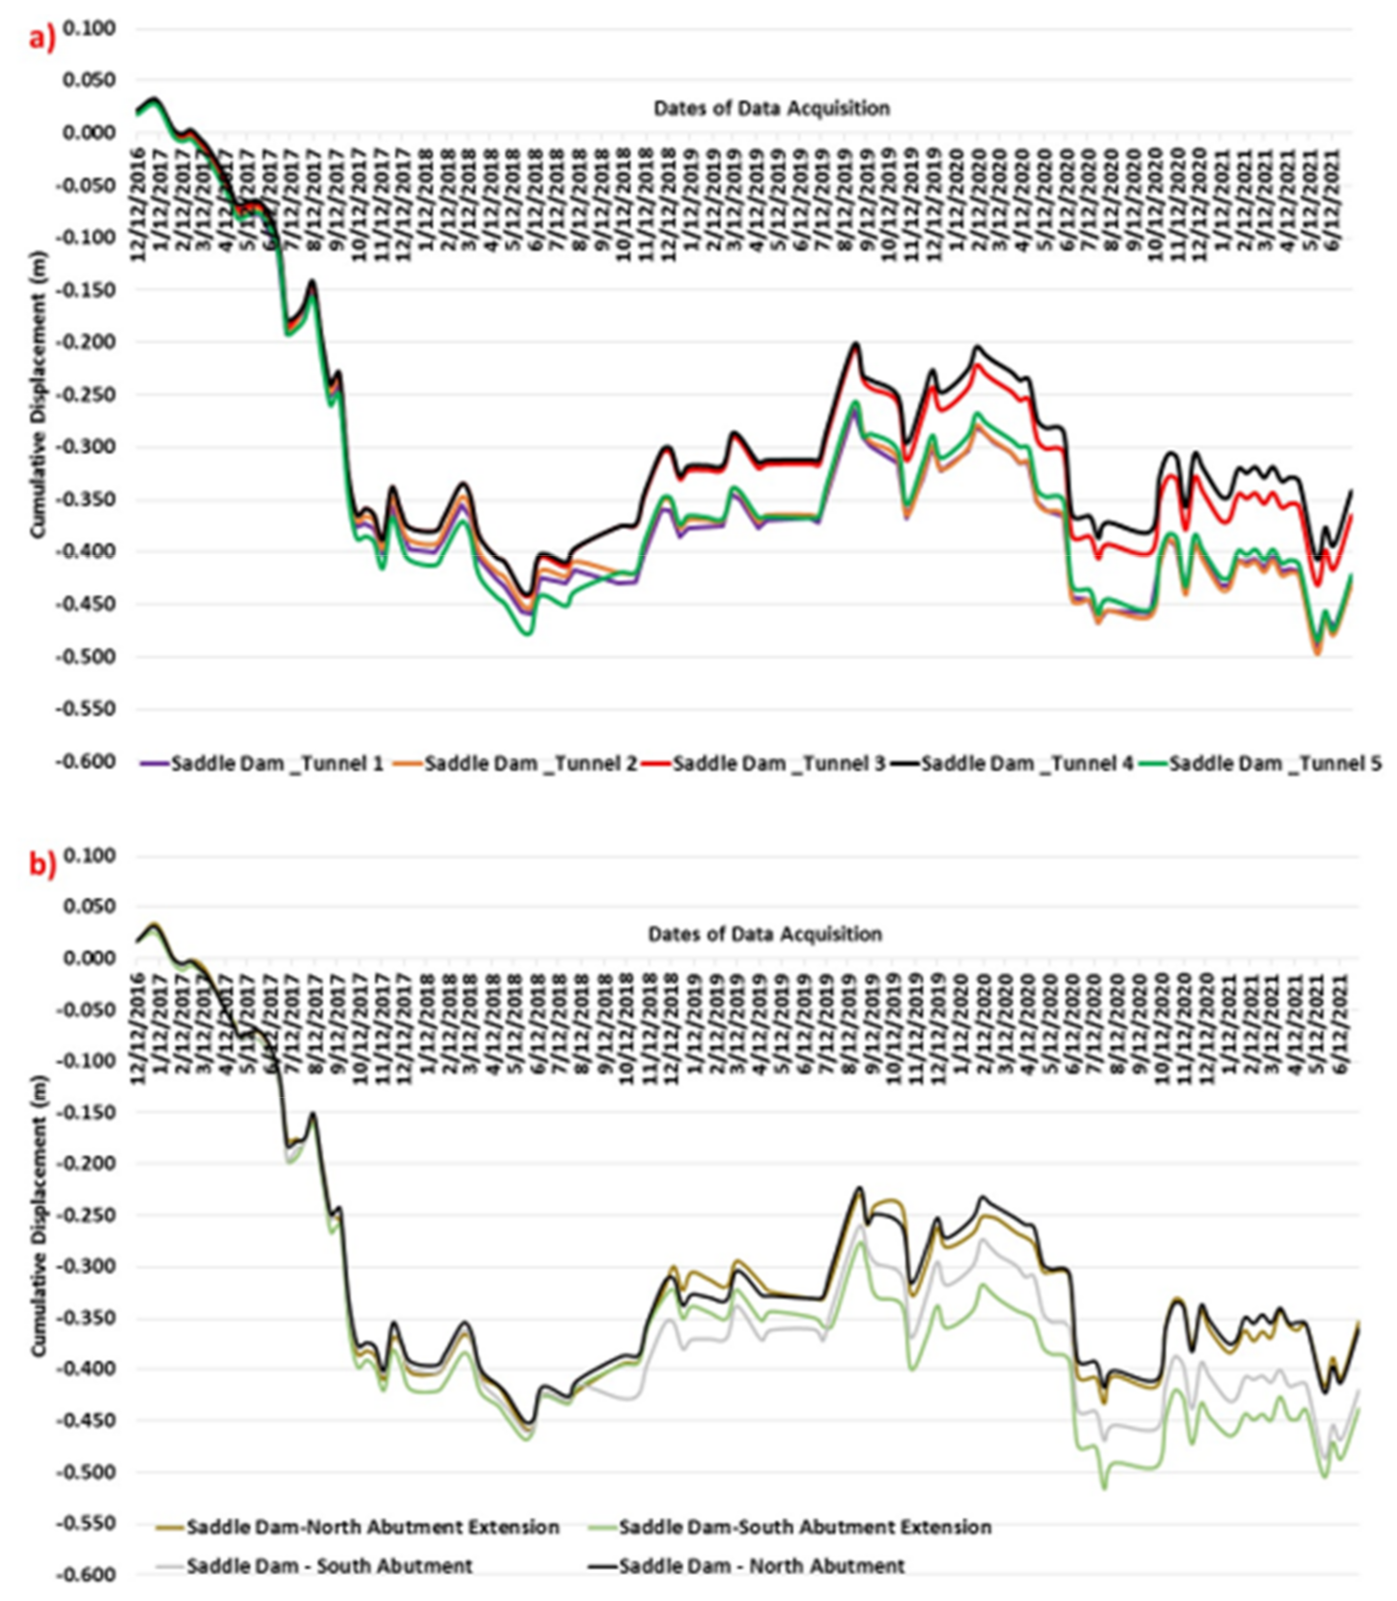
3.2. The Monitoring of the Saddle Dam Displacement over Nine Cross-Sections

Figure 6 shows the vertical displacement (in meters) over the GERD’s Saddle Dam at the nine cross-sections referenced previously in Figure 4b. The displacement for the five tunnels (cross-sections 3 to 7 in Figure 4b) are shown in Figure 6a while the North and South abutments and their extensions (cross-sections 1, 2, 8 and 9 in Figure 4b) are shown in Figure 6b. All the nine sections differ in their subsidence and in some instances even the rate at which the subsidence is occurring. Figure 6a shows that the five cross-sections subside at a relatively similar rate until October 2017 after which the rates start to differ.
Amongst the five cross-sections, tunnels 3 and 4 have a relatively lower subsidence than tunnels 1, 2 and 5. As with the tunnels, the two abutments and their extensions started showing a difference in subsidence rates since October 2017 (Figure 6b). The North abutment and its extension have a similar rate of subsidence with each other while the South abutment and its extension show a larger variation. The South abutment exhibits a more pronounced subsidence until July 2019 after which the South abutment extension started showing greater subsidence. As with the GERD’s Main Dam, there is a lack of uniformity in subsidence across the dam and the rate of subsidence varies as time passes as observed in the subsidence at the South abutment and its extension. It is noteworthy that the observed subsidence reported here occurs in complete absence of water. Therefore, it is reasonable to believe that future water pressure will lead to greater subsidence.

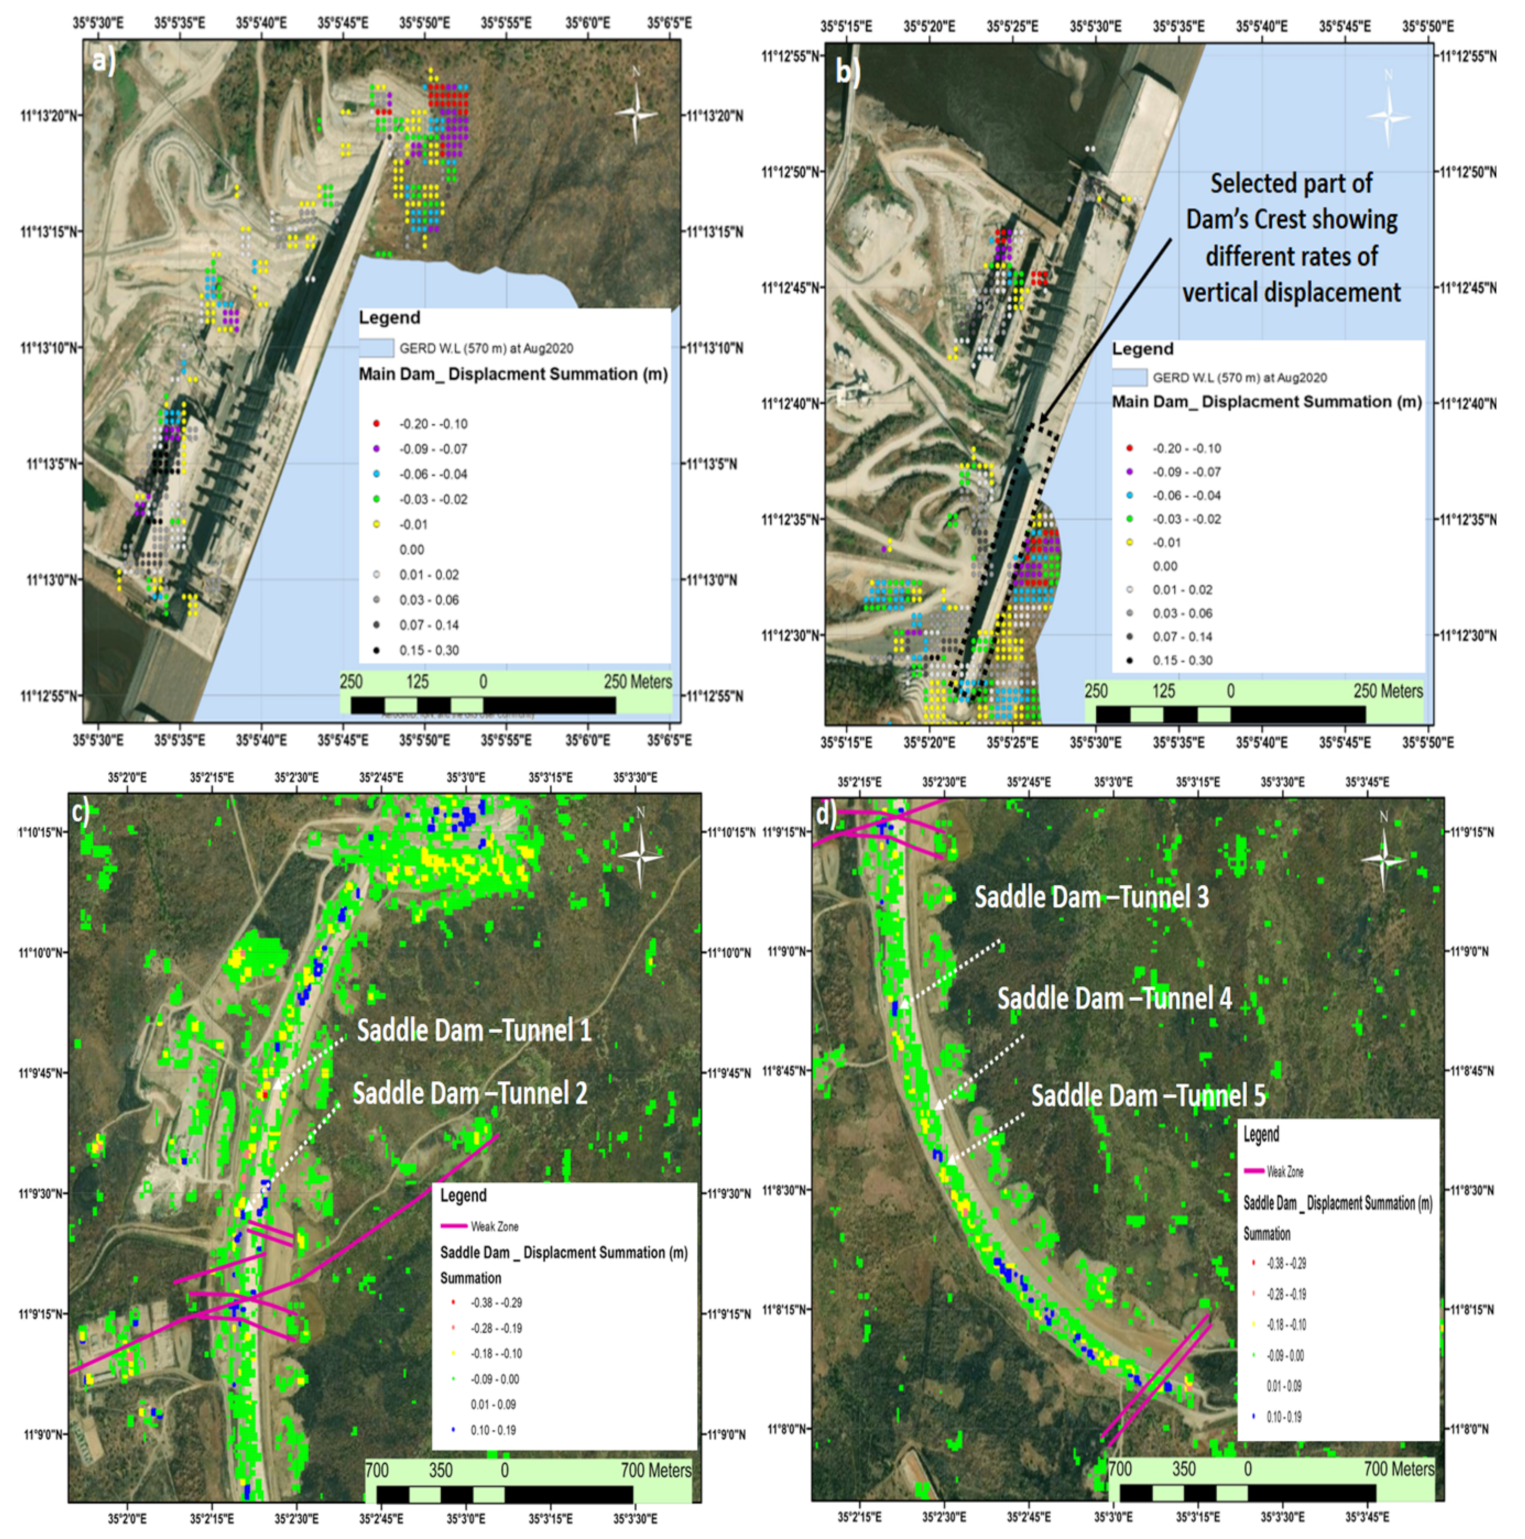
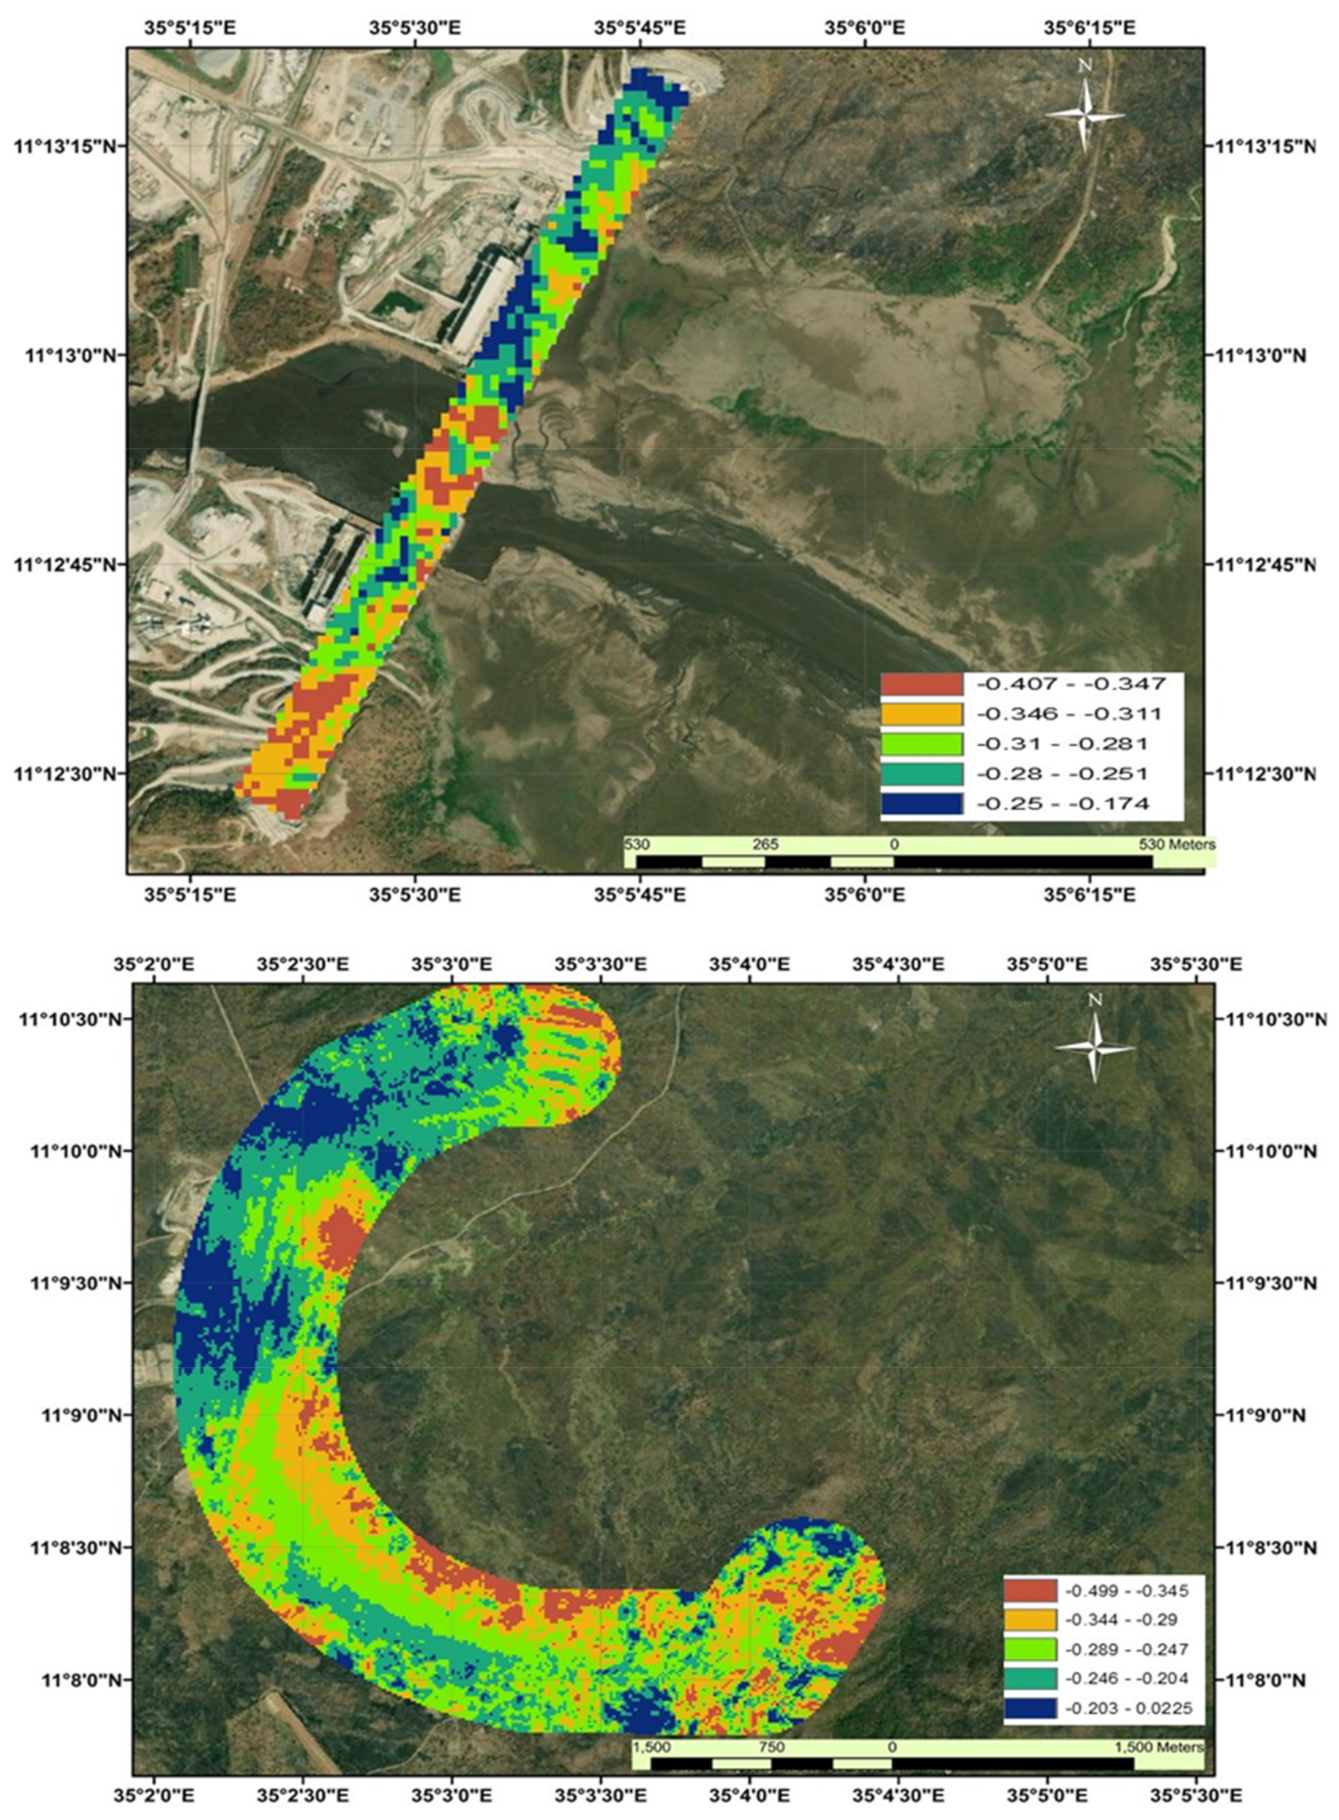
3.3. Spatial Representation of Displacements over GERD’s Main and Saddle Dam Locations

Figure 7 exhibits the spatial representation of the vertical displacement (in meters) over the GERD’s Main and Saddle Dams utilizing the DInSAR technique for the period from December 2016 to July 2021. The minus sign in the figures represents subsidence while a positive sign represents an uplift. The displacement ranges with no color assigned is to show that the displacement exists but for clarity purposes, is not shown with color in the image. It is noteworthy that the pixels with no points highlighted does not mean zero displacement but that the displacement is very minor—not exceeding + or − 0.01 m (1 cm).
It can be observed that the Main Dam has undergone subsidence throughout its six cross-sections (Figure 7a,b) while the Saddle Dam has undergone subsidence as well as uplifting in each of its nine cross-sections (Figure 7c,d). We observed major subsidence identified by red circles ranging from −0.1 to −0.2 m over the Main Dam cross-sections 1, 5 and 6. On the other hand, we identified crucial displacement variability for the Saddle Dam from the figures, where each cross section displays a certain degree of subsidence and uplifting. Tunnel 1 for the Saddle Dam displays the highest subsidence observed in this analysis, with the subsidence value ranging from −0.27 m to −0.38 m. We attribute these higher values observed for the Saddle Dam to the local geology and fault lines located directly underneath the dam. We conducted a further analysis of this issue along with the discussion of the role of local geology shared in the following section.
To obtain the most accurate accumulated DInSAR displacement at the different GERD locations, we adopted a technique based on the coherence value for the interferometric processing of each image. We have masked out image parts with low coherence to prevent misinterpretation of patterns that resulted from phase decorrelation. Ullo et al. [36] have suggested in their study of dam monitoring that a coherence value greater than 0.4 is considered reliable. Multiple other studies [37,38,39,40] have a selected coherence value between 0.4 to 0.8 as a threshold to mask images in their analysis. Yet, in this specific part of our analysis, we used a coherence value of >0.9 as our threshold to identify the most critical areas showing displacement quantitatively with high accuracy and reliability for the GERD’s Main and Saddle Dams and the landscape nearby. We clearly highlighted the most important observation from this analysis by a dotted black box that displays subsidence at the crest of the dam at different rates, possibly a major cause of concern (Figure 7b). The different colored circles represent the difference in subsidence, in the range of 0.2 m to 0.9 m, along that section of the crest. Figure 7a,b indicate that there is a vertical displacement in the area surrounding Main Dam east abutment with a maximum displacement value of −0.2 m within 4.5 years. On the other hand, the accumulated displacement on the concrete body of Main Dam’s west abutment shows a maximum value −0.06 m within 4.5 years, which we consider as very critical results, since this part of the dam was completed in 2017 (almost the same period of DInSAR analysis). Therefore, the resulted displacement reflects structure reaction after loading the soil with the full weight of this part of the Main Dam. Figure 7c,d show the range of observed displacement that reflects clear heterogeneity and noticeable changes in the entire body of the Saddle Dam. Figure 7c shows a maximum displacement value of −0.307 m within 4.5 years on Saddle Dam–Tunnel 1. It shows the displacement in the weak zones area that emphasize notable displacement difference in positive and negative values within short distances. Meanwhile, Figure 7d shows the displacement near the Saddle Dam South abutment, where a maximum value of −0.21 m within 4.5 years is calculated on the upstream surface, also a notable displacement difference is found on the nearby weak zone. Embankment dams usually undergo displacement, but these observations highlight that the changes are not homogenous and hence, we felt the need for further investigations. For that reason, in the following section, we will look at the local underlying geological conditions and weak zones in accordance with the observed vertical displacement over the Saddle Dam.

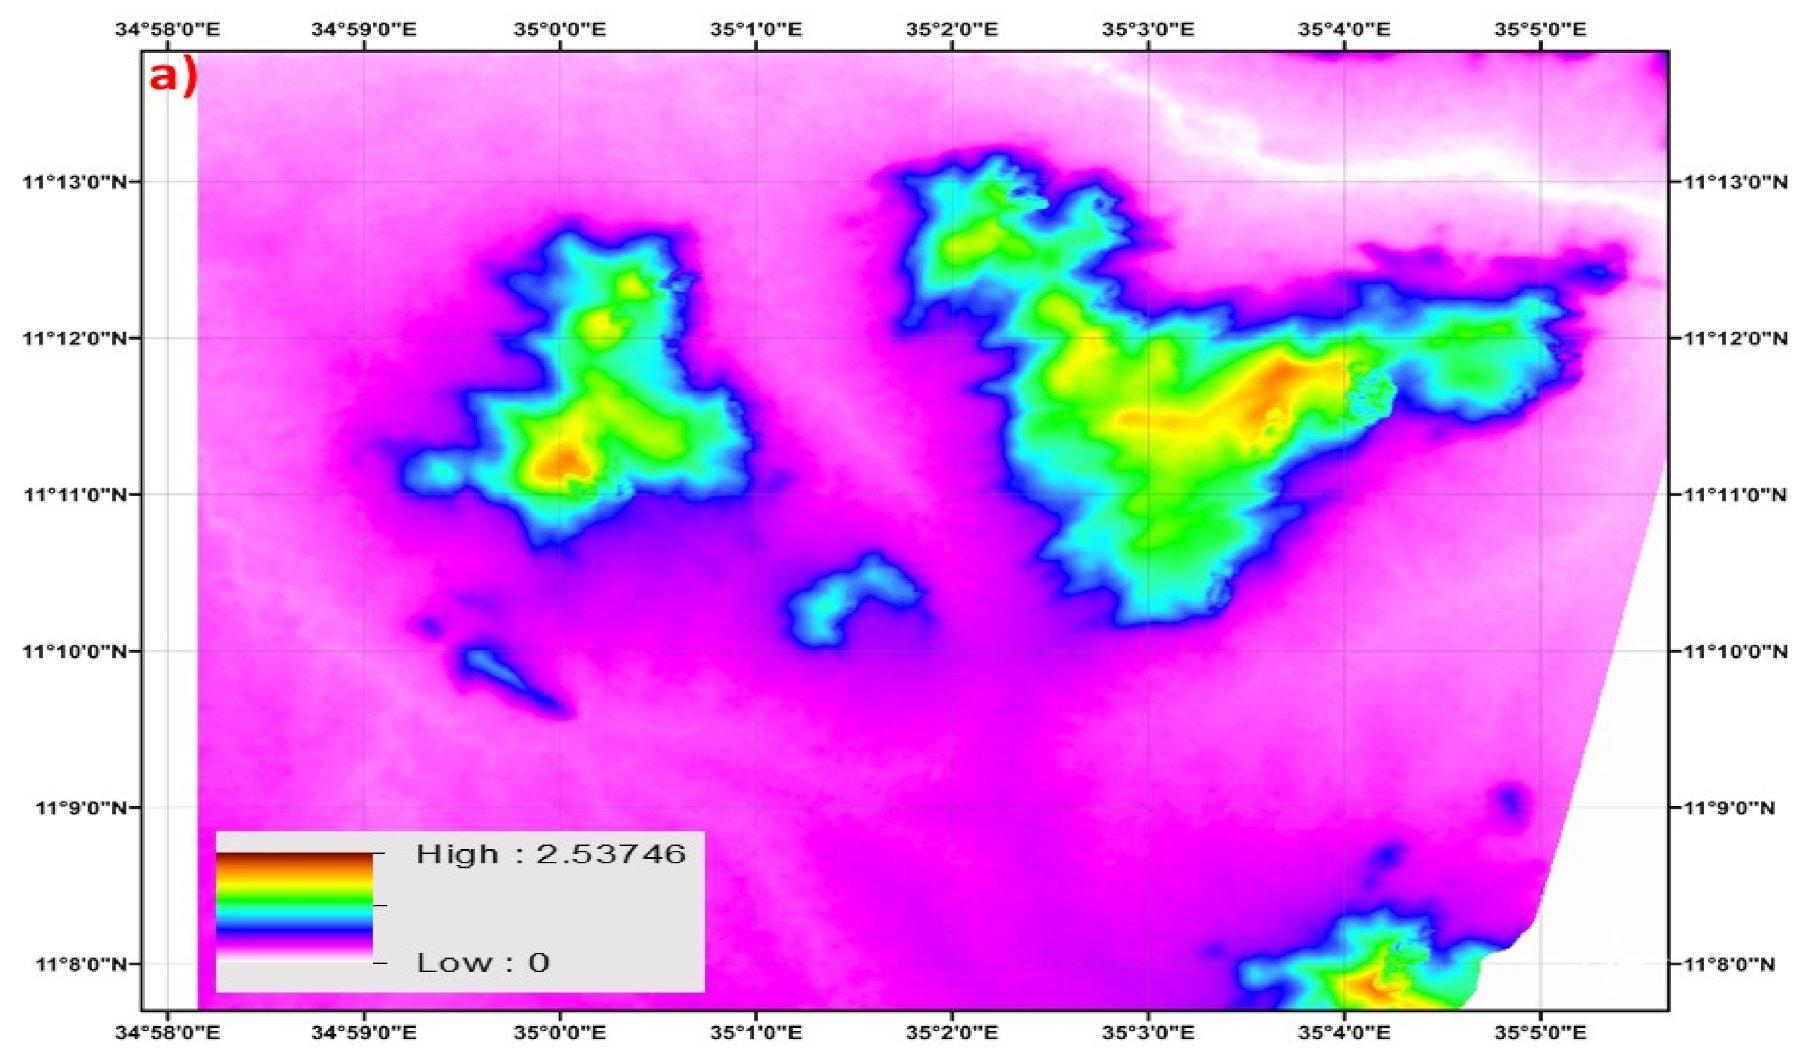
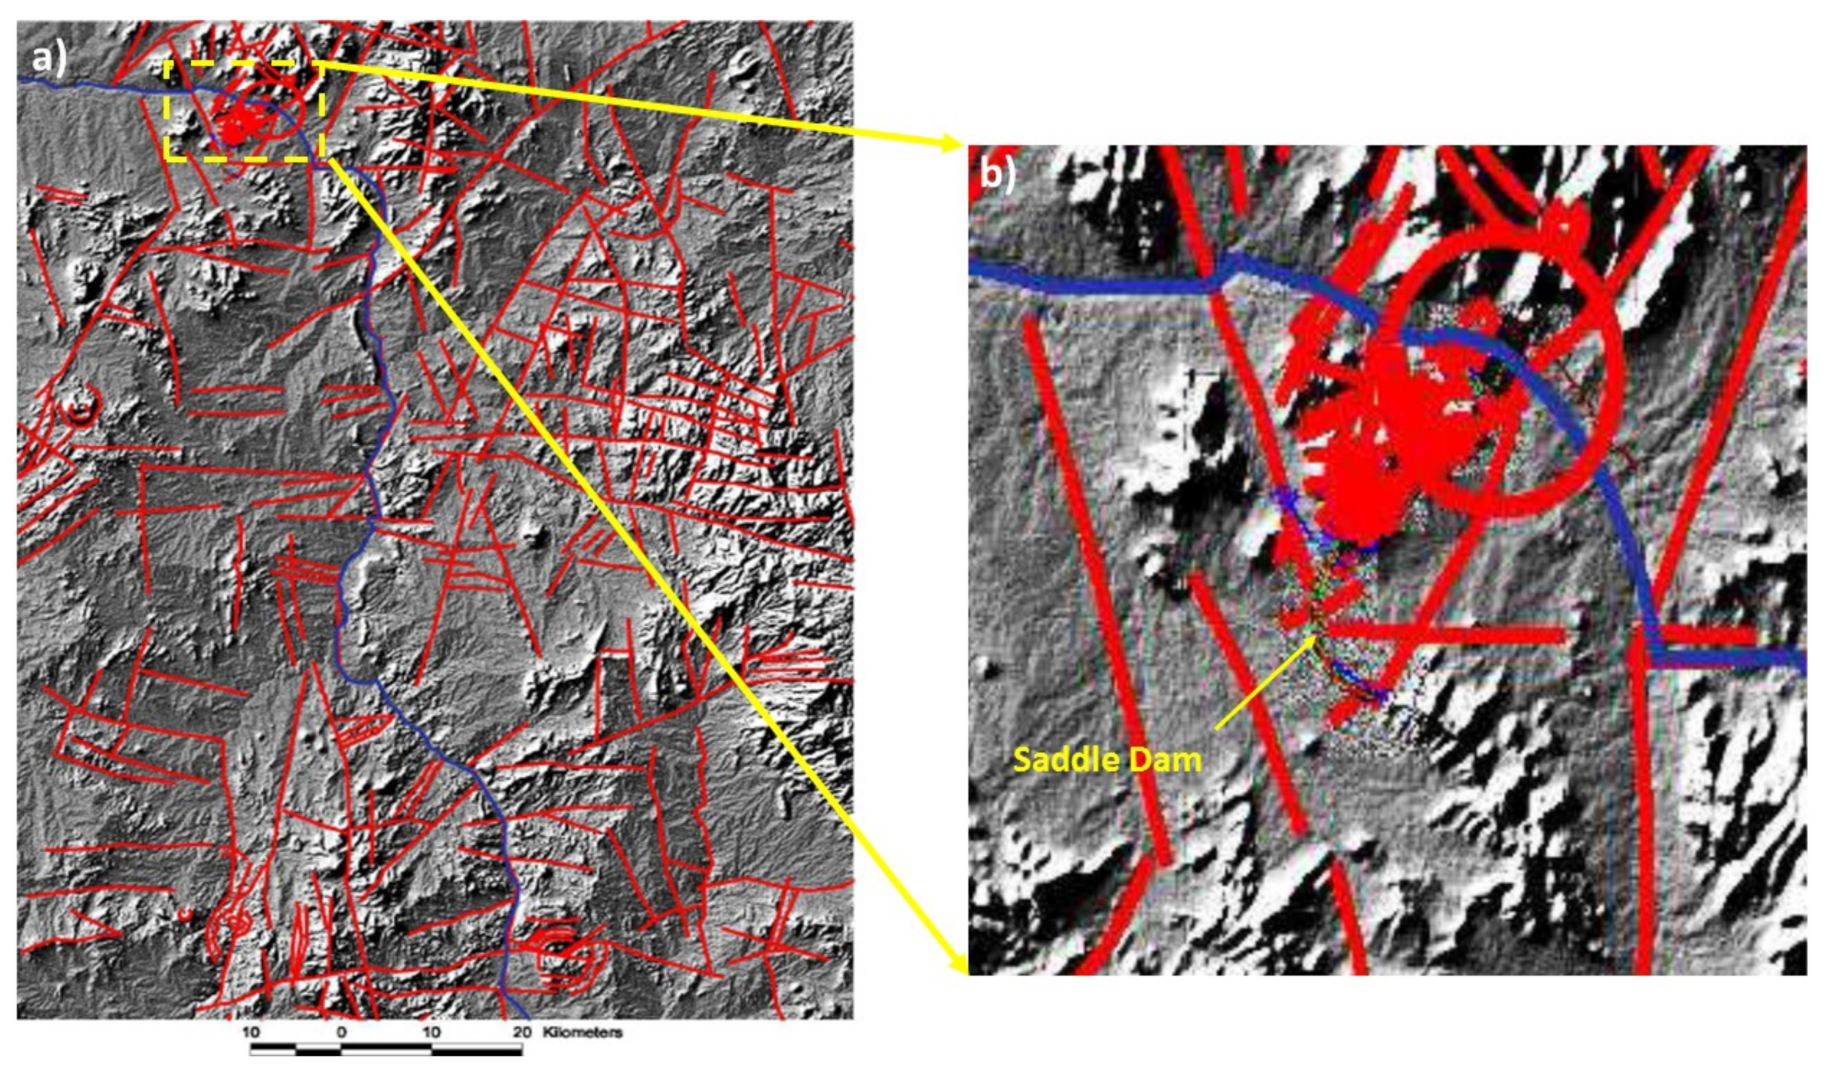
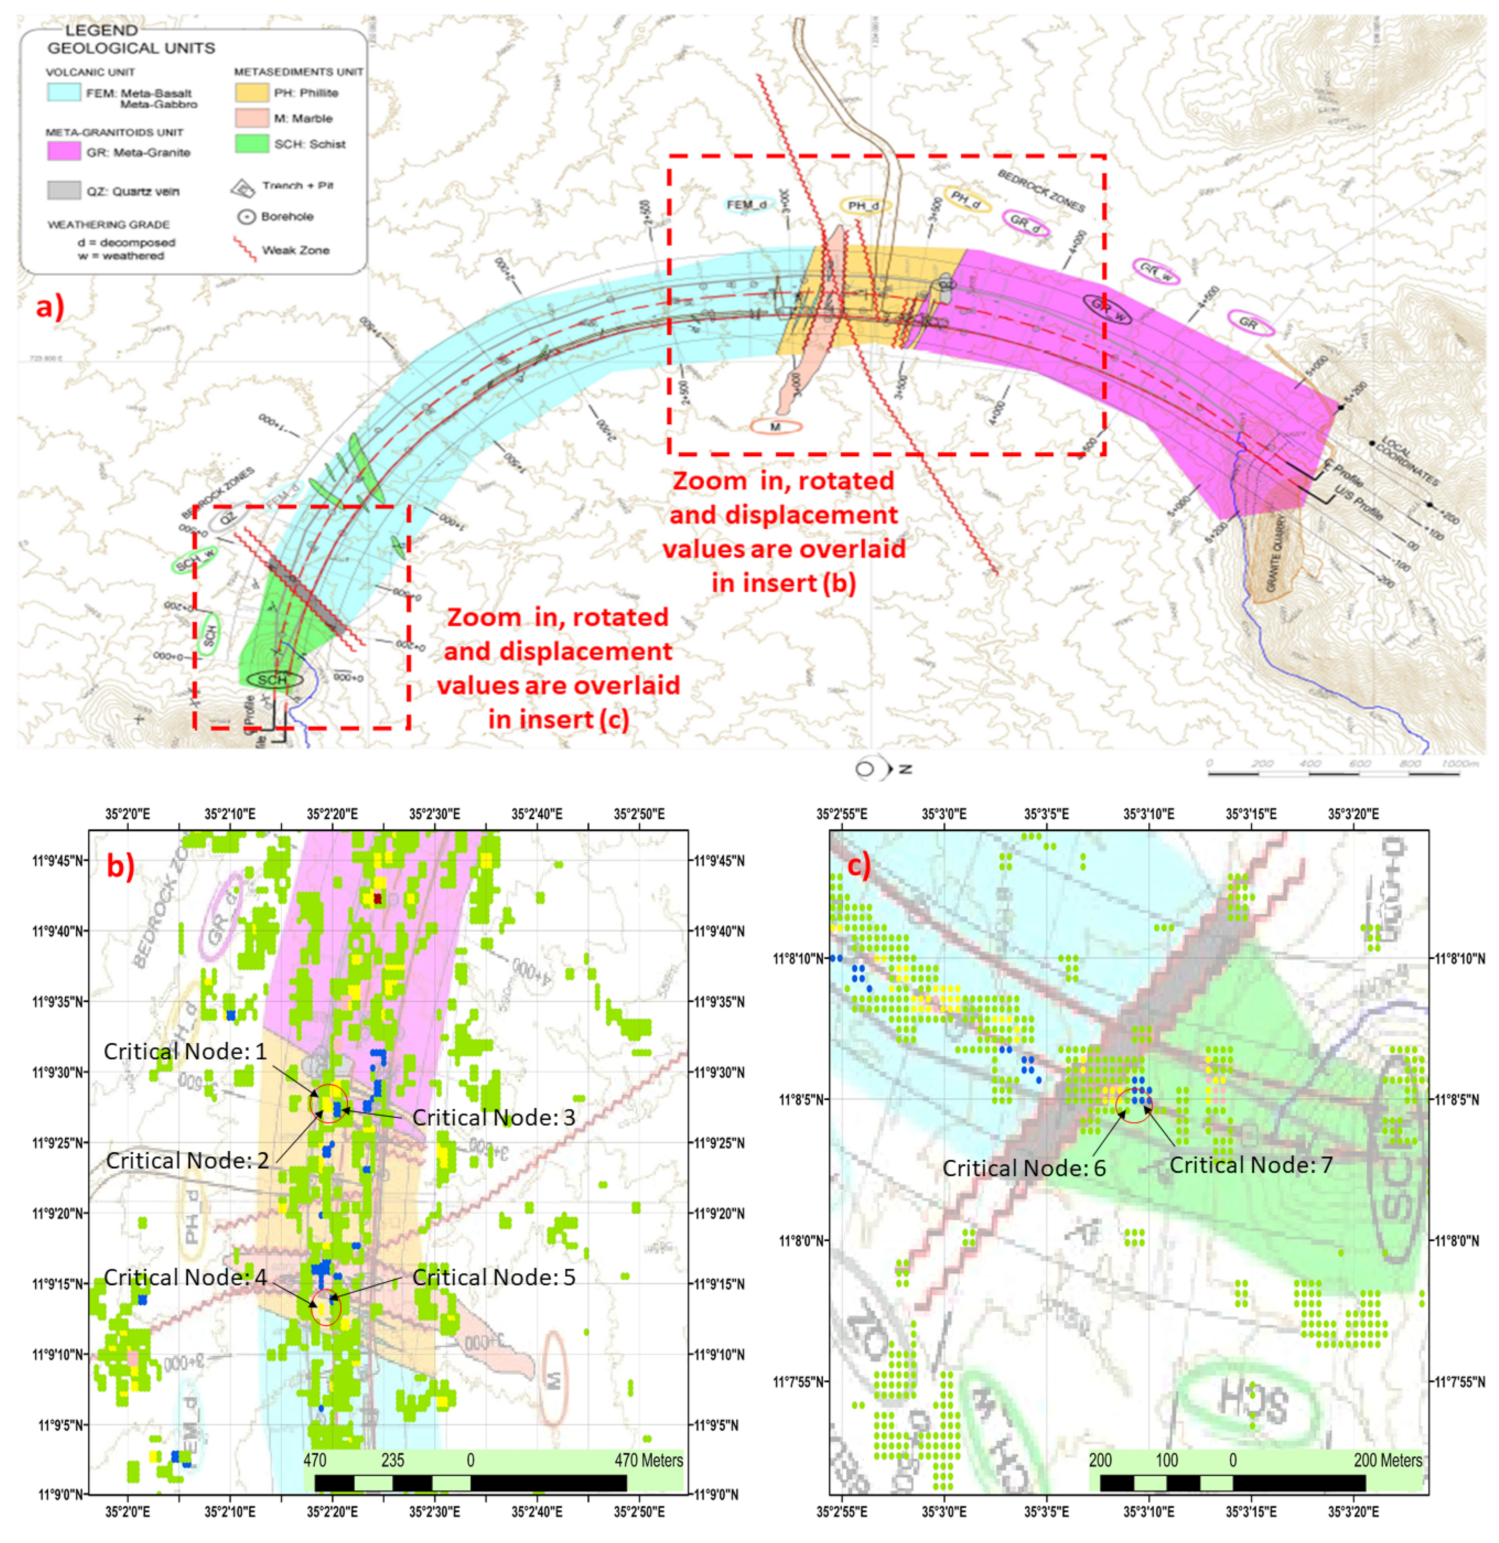
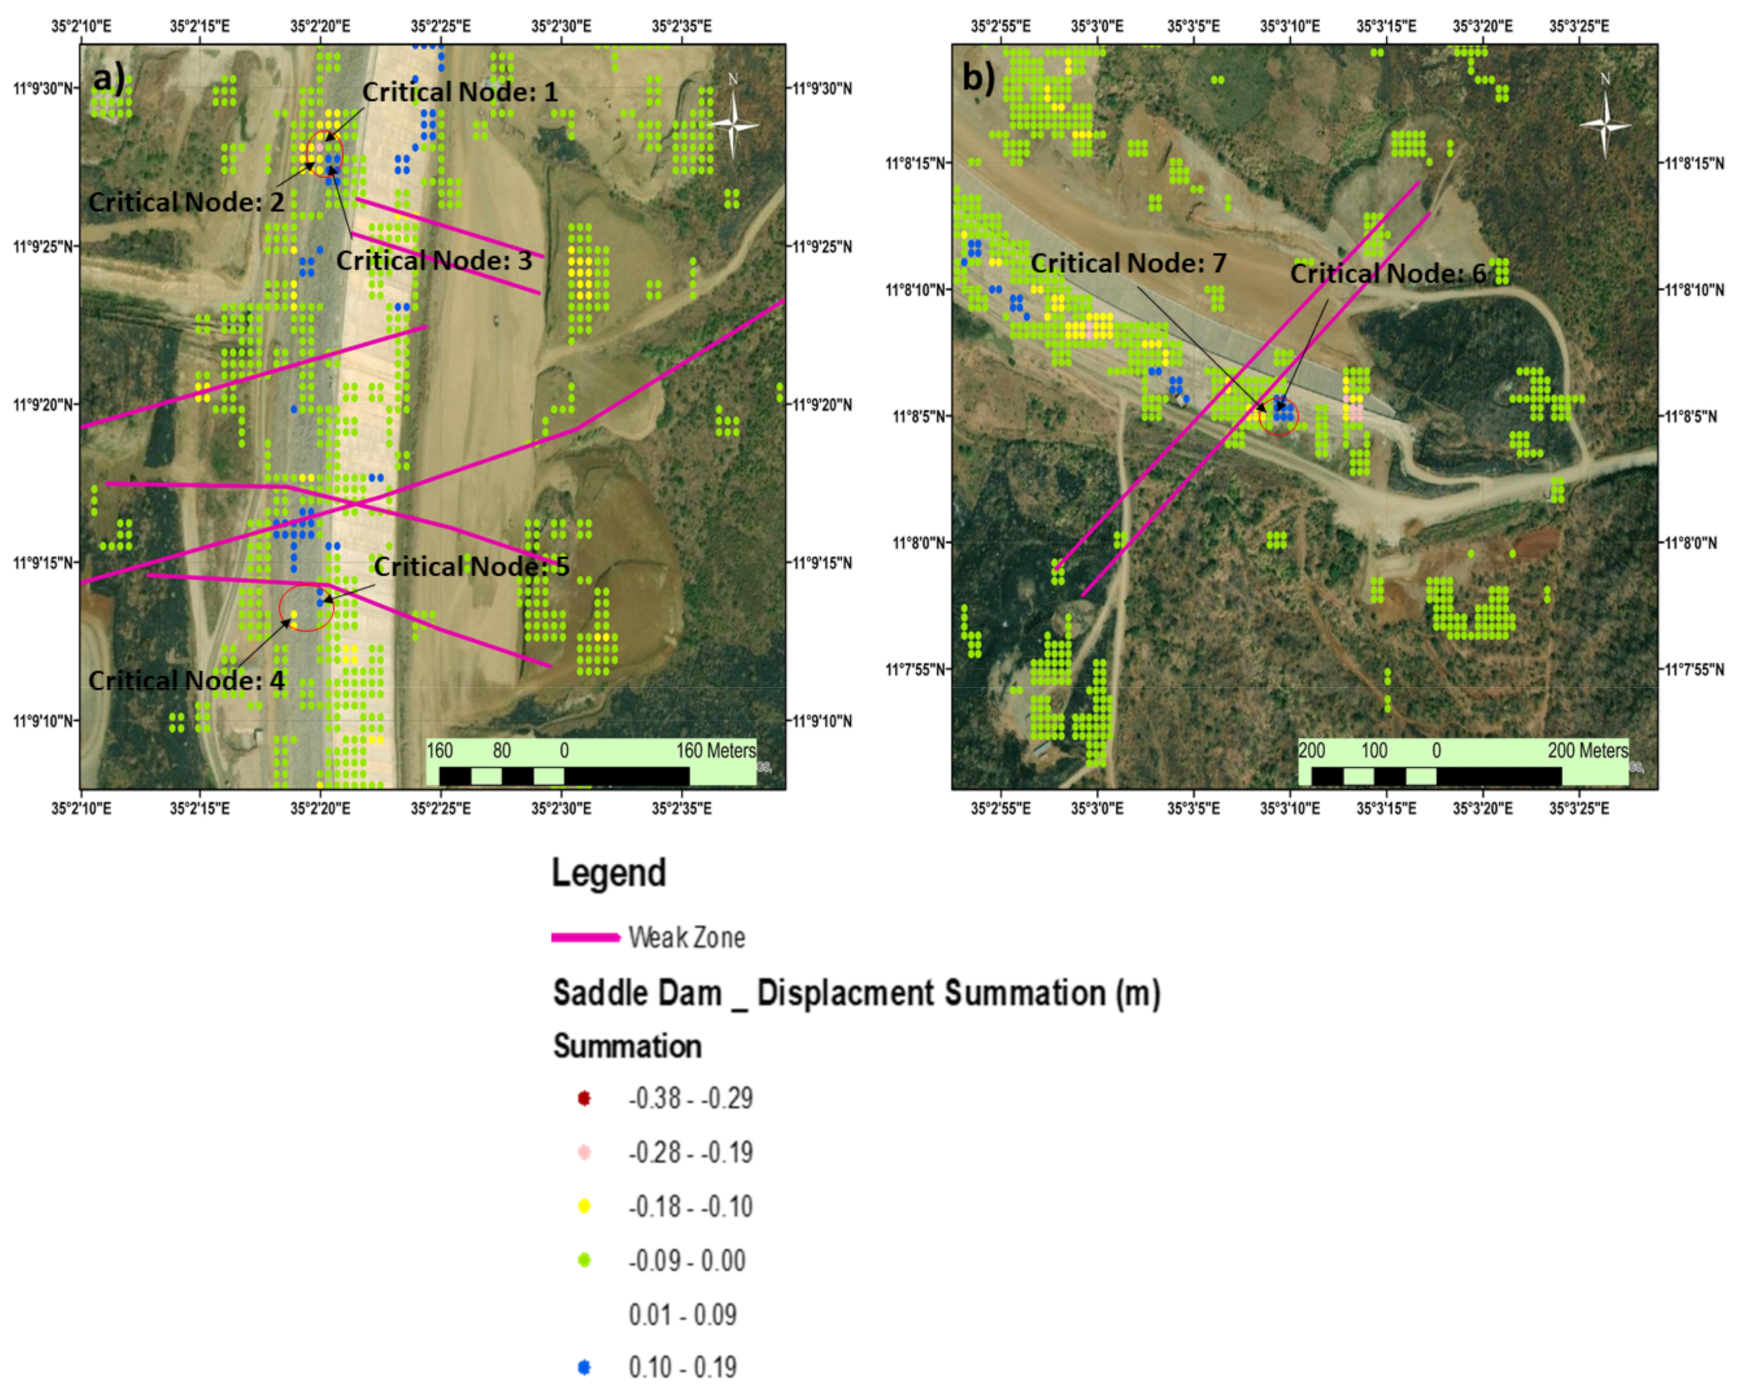
3.4. Analysis of Local Geological Conditions and Impact on Saddle Dam

The GERD region exhibits a complex tectonic history including both compression stress regimes—orogenic cycle: (Pre-Cambrian time, 870 to 550 Ma) and tensional stress regimes—rifting (Triassic-Cretaceous and Neogene-Quaternary time) [41,42,43,44,45]. Previous analysis based on site visits conducted and reported by the Ethiopian government found that the maximum pressure orientation was NW-SE and in the GERD pan African area, the main lineation pattern and foliation trending are NE-SW. Moreover, the N-S trending lineaments become more crucial upstream from the site (southern area), forcing the Blue Nile direction, as shown in the Blue Nile structural map (Figure 8a). A closer zoom on tectonic elements of the Blue Nile shows weak zones where the Saddle Dam is located (Figure 8b).
The area enclosing the elements highlighted in purple is a critical area to understand the effect of loading represented by the weight of the dam’s body on the soil. The goal of this analysis is to find out whether the data from DInSAR point to a causal link and to monitor changes over a longer period. Ultimately, the goal is to analyze the behavior of the soil and geological layers after the establishment of the Saddle Dam.
Since the very beginning of the construction of GERD, there have been many critical comments about the project location in view of its geological characteristics and technical issues. Studies have confirmed the existence of heterogeneity that may affect GERD safety particularly at Saddle Dam location, where there are a number of faults and weak zones across the Saddle Dam body [6,35,46]. The dam construction occurred upon a surface where low-metamorphic rocks are colliding with the high metamorphic zone, making it a contact zone. Moreover, the geomorphology suggests the presence of varying rock species between the two dam shoulders namely schist on the left side and meta-granite on the right (Figure 9a).
Figure 9a shows the schematic geological plan of the Saddle Dam. It shows that the foundation is composed of five main geological units assembled on top of each other by a pre-Cambrian compression regime that includes folds, faults and boudinage, and extension formed structures. As observed in Figure 9a, the five main geological units from left to right bank are schist, the volcanic unit (meta-basalt and meta-gabbro), phyllite, marble and meta-granite. The left and central sections of the foundation have a presence of minor quarzitic veins as well. Thus, the dam was built on a 3.6 km stretch of residual soil, followed by a 1.6 km stretch of rock. These geological units also contain tectonic contacts, which are continuous from upstream to downstream encompassing the complete foundation of the dam. These show high permeability as well as a possibility of erodible material presence [46]. We have identified five critical nodes between tunnel 1 and 2 of the Saddle Dam and two critical nodes near the south abutment (Figure 9b,c, respectively).
Despite their different sources, the results indicate a correspondence between the results of the calculated DInSAR displacement and the geological characteristics of the Saddle Dam. We identified the seven critical points and closely monitored them as they represented the largest vertical difference between the points, most of which are located on the geological weak zones (Figure 10).
Figure 10 presents a closer look at the same area in Figure 9 in order to shed light on critical nodes 1 to 5 that are located between tunnels 1 and 2. Figure 10a highlights the observed large difference in vertical displacements at the critical nodes even when located in close proximity to each other. On the other hand, Figure 10b displays the displacements along critical nodes 6 and 7, which are located near the South abutment of the Saddle Dam. The annual displacement summation of the most critical points was identified based on the vertical displacement analysis and was found to be located on Saddle Dam’s weak zones according to the local geology (Figure 11). By reviewing the structural progress of the Saddle Dam, the crest level was reached during 2017, which is in line with DInSAR results, and which indicates a subsidence in most of the critical points because of the soil response to the weight of the dam. However, the results varied between subsidence to uplift for the rest of the years, which could possibly be due to the rainy season and the underground water table movement beneath the Saddle Dam (Embankment Dam type). Using the same data and the same reference starting in January 2017, we observed a large difference in displacement levels. Critical nodes 1 and 3 showed a maximum vertical difference of about 0.35 m, while critical nodes 4 and 5 showed a maximum vertical displacement difference by about 0.26 m, followed by critical nodes 6 and 7 with the maximum vertical difference of about 0.16 m. As with the previous analysis, there appears to be inconsistency in the observed vertical displacements around the same area, something that calls for attention. Hence, we then divided the critical nodes into 3 groups based on their proximity with each other. Group one contains critical nodes 1, 2 and 3 (shades of blue), a second group contains critical nodes 4 and 5 (shades of green), while critical nodes 6 and 7 form a third group (shades of orange). The results show that there is inconsistent displacement even within the same group, where one or more critical node displays subsidence while the other critical node in the same group displays uplift. The results from this analysis along with the previous comparison show great consistency between the results of DInSAR analysis and the geological nature of the area. We believe this result calls for an urgent enhanced monitoring of potential construction problems at the dam site.

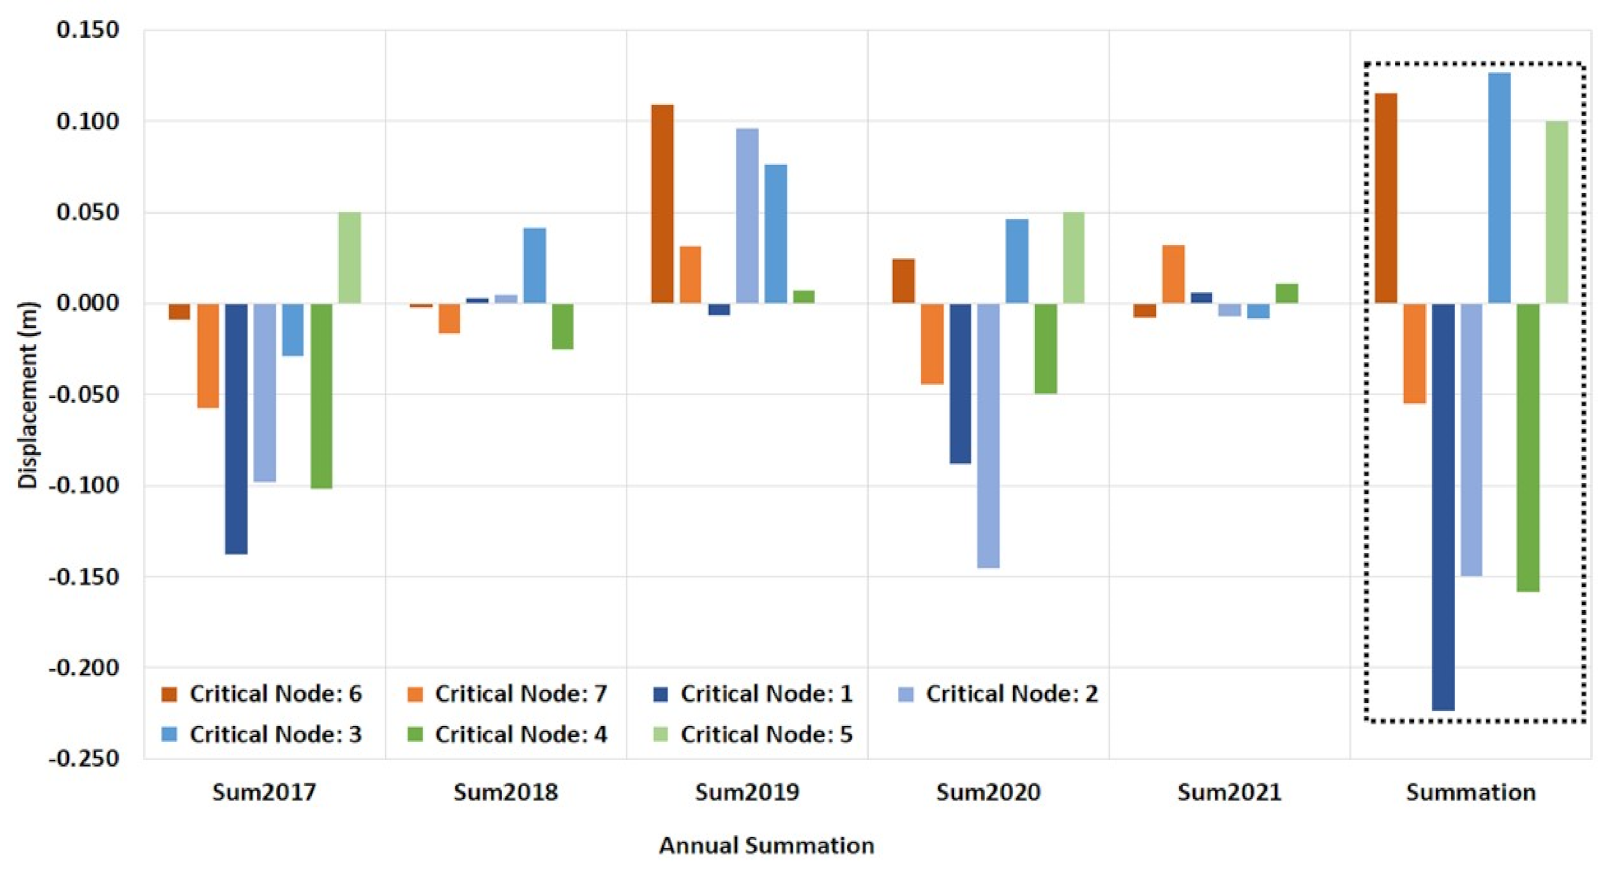
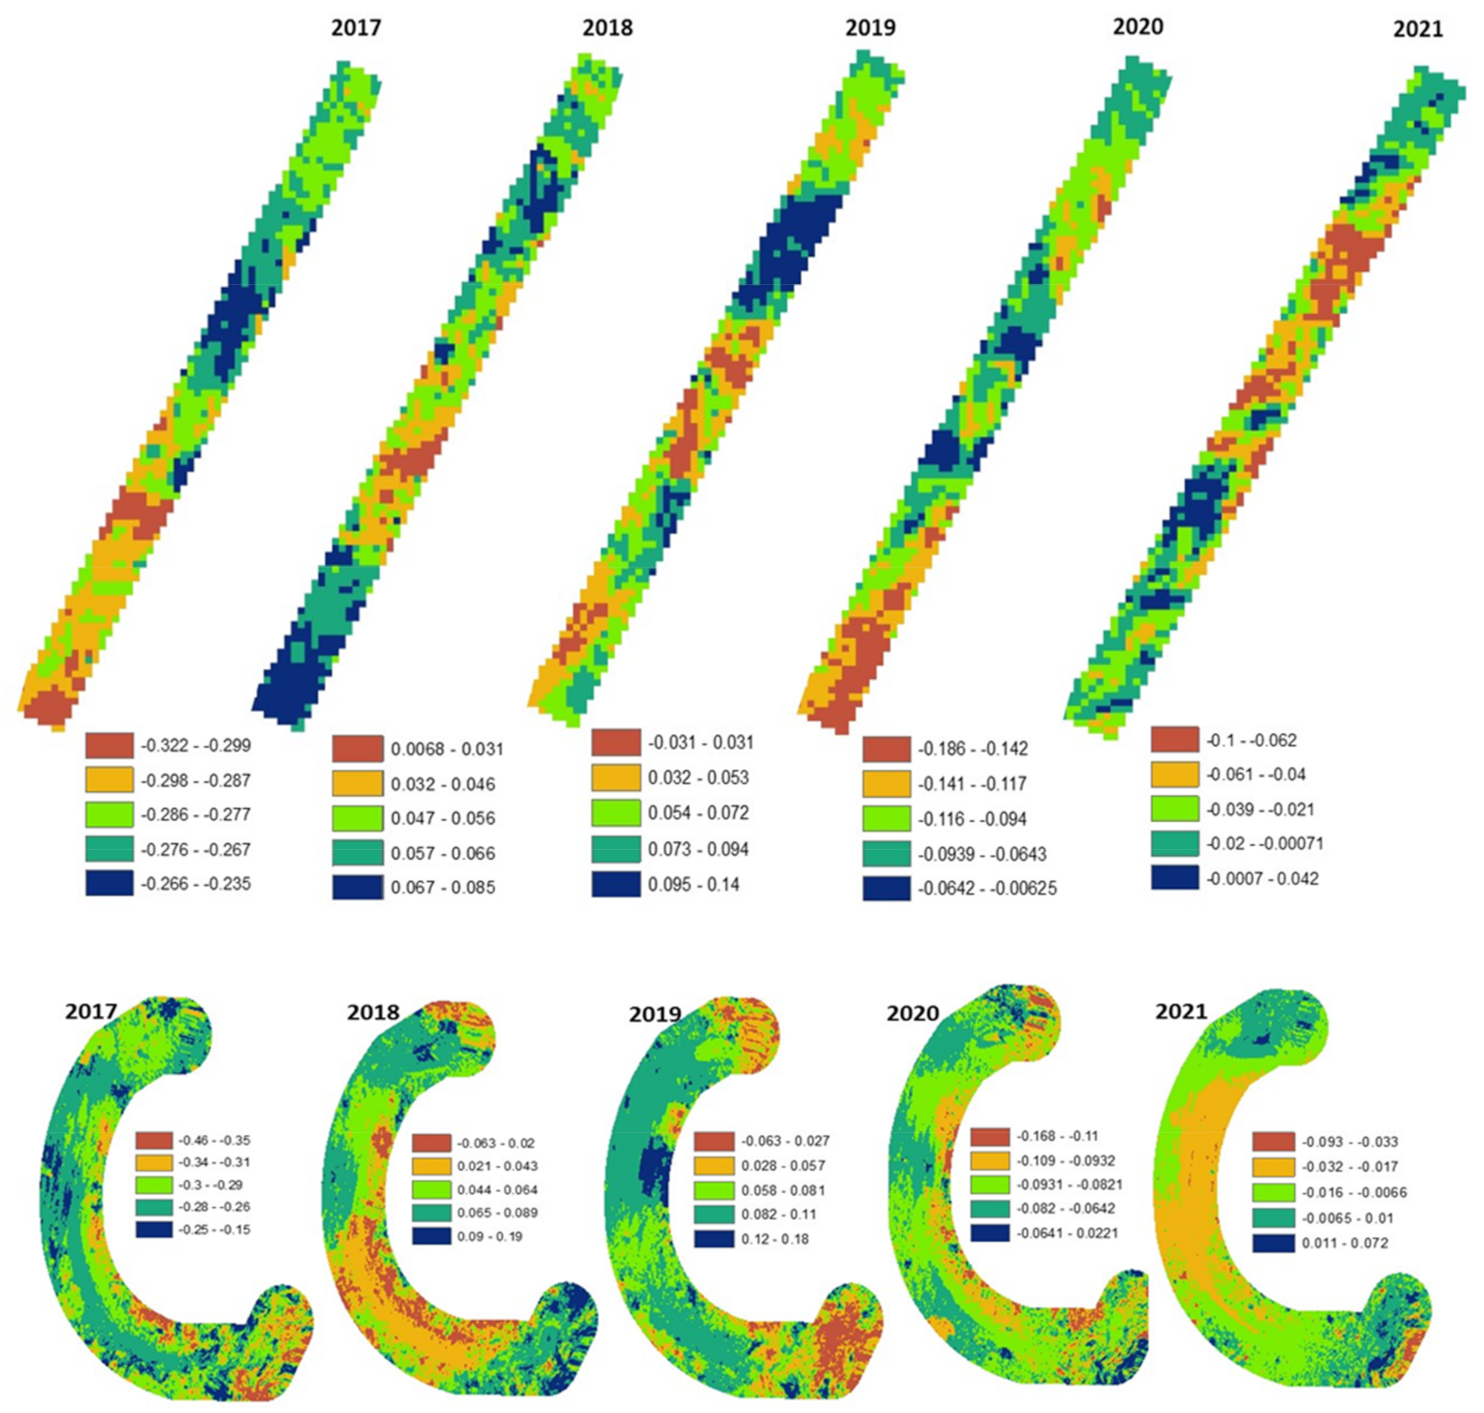
3.5. Annual Ground Displacement over the GERD Location

In order to investigate the general trend over the GERD’s Main and Saddle Dams, we used raw images, and just in this case, we decided to avoid setting coherence threshold values to have a continuity in the sequence of images. Figure 12 shows the accumulated vertical displacement over the GERD’s Main and Saddle Dams from December 2016 to June 2021. Complementing the results from Section 3.3, Figure 12a shows a critical change in displacement (~0.4 m) at cross section 6 marked by red color. Again, it is necessary to highlight that the subsidence observed is at different rates along the crest. On the other hand, the structure between cross-sections 3 and 4 also shows critical subsidence but it is known that the construction is still ongoing at these cross-sections during this study (July 2021), and therefore we ignored results obtained on that section. Similarly, Figure 12b displays the different rates of subsidence along the GERD’s Saddle Dam. Figure 13 displays annual change in vertical displacements from 2017 until June 2021. We have decided to keep separate scales for each year so that differences in displacement within each year can be analyzed. We observed major subsidence (~0.3 m) over the Main Dam (Figure 13 Top) in the year 2017 across all cross-sections, followed by two years of uplift (~0.5 m to 0.1 m). In the year 2020, the year of the first filling period, there has been a non-homogenous displacement across all the cross-sections of the Main Dam. The west abutment of the Main Dam displayed the most subsidence (~0.2 m) in that year. Since the beginning of 2021, there has been some uplift (~0.02 m), observed with a slight subsidence (~0.09 m) in some parts. As with the Main Dam, the Saddle Dam (Figure 13 Bottom) displayed the most subsidence (~0.4 m) in the year 2017, followed by uplifts (~0.02 m to 0.19 m) in the following two years. The Saddle Dam displayed a slight mix of uplift (~0.02 m) and subsidence (~0.1 m) in the year 2020 while an uplift (~0.1 m) in the year 2021. This work suggests that the GERD’s Main and Saddle Dams are exhibiting varying displacements either in direction or in rate across the time of this investigation.

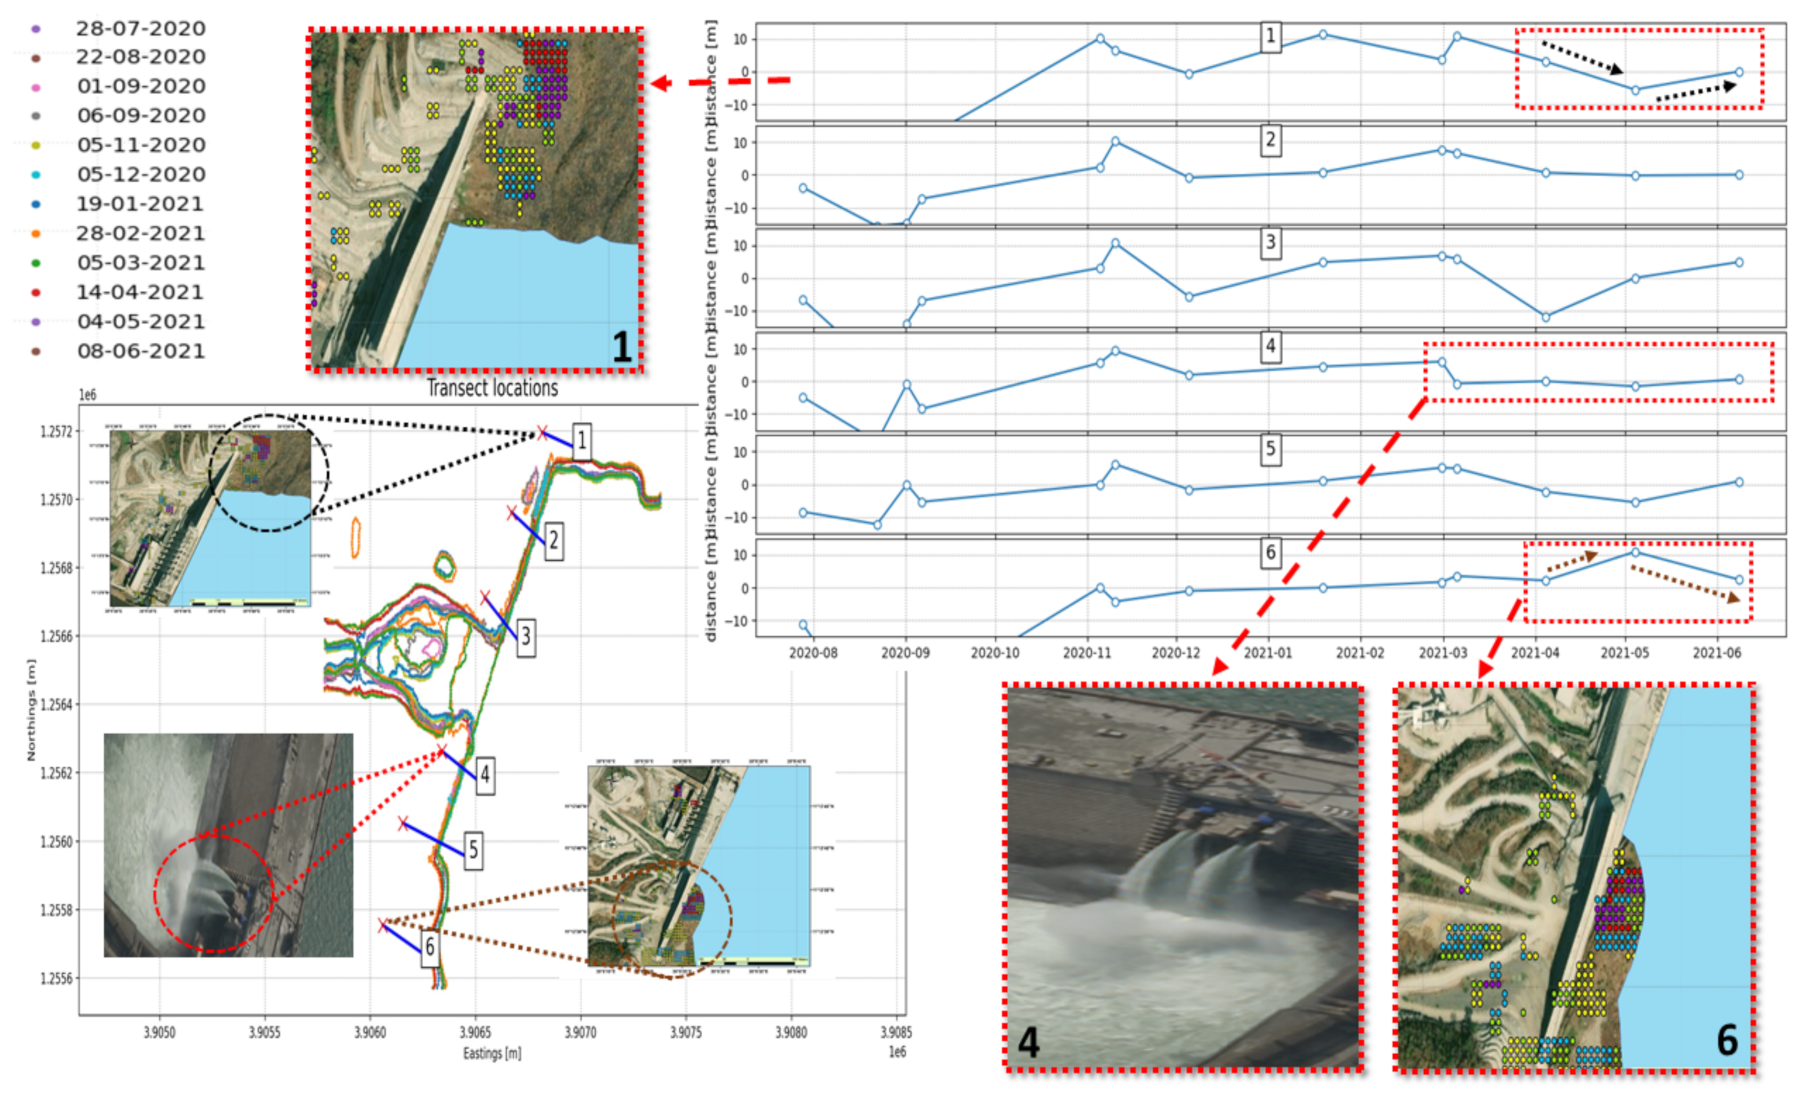
3.6. Water Edge Analysis at Different Transects of the GERD’s Main Dam

As it is well known, different vertical displacements will influence the water edge. Thus, in this section we are analyzing the water edge profile at different locations on the GERD’s Main Dam, to independently confirm the results we have highlighted in the previous sections. Figure 14 displays the change in water edge with respect to the GERD’s Main Dam, as well as a time series for the change in water edge at the six transect locations as referenced earlier in Figure 4. The time period for this analysis is since the beginning of the first filling period (July 2020) until June 2021. On the bottom left of Figure 14, the water edge during different satellite acquisitions is presented along with the legend for the colors representing a specific acquisition on the top left. For the same color (unique timestamp), a discontinuation between transects 3 and 4 indicates the gates being closed.
The time-series graph shows a difference in trend since April 2021 over transects 1 and 6, which correspond to the cross-section pair of the east and west abutment of the Main Dam, respectively. This complements the results obtained in Section 3.1 of this manuscript where the difference in rate of subsidence at these opposing cross-sections were highlighted, especially the cross-section pair of (1,6). The hypothesis here is that the acceptable displacements across a dam wall should be uniform, especially the opposing sections. Moreover, the analysis conducted in Figure 14 can be further validated for accuracy by focusing on transect 4, which is the low flow outlet in the GERD’s Main Dam. There is a dip observed in transect 4 (shown in dotted red box), which corresponds to the same time when the bottom outlet of the Main Dam was opened in April 2021 [47,48]. As the bottom outlet (transect 4) was opened, there was a reduction in water edge because of the water being sucked out through the bottom outlets. A satellite image, numbered 4 below the time-series graph, taken in April 2021 of the water flowing through the bottom outlet presents the causality for the change in water edge observed in the time series plot of Section 4. It is important to mention that we could not conduct a similar analysis for the Saddle Dam, since currently; there is no water body behind the Saddle Dam.

4. Discussion

This work addresses the vertical displacement associated with the ongoing construction and filling of the GERD Dam. The time series graphs mentioned in Section 3.1 and Section 3.2 (Figure 5 and Figure 6) showed a notable difference in the vertical displacement across the cross-sections identified in the study, over the GERD’s Main and Saddle Dams. We observed a more pronounced difference in the vertical displacements at some cross-sections of the GERD’s Main Dam after the start of the first filling period that took place during July 2020. Furthermore, a detailed analysis of the crest of the Main Dam showed varying subsidence in the range of 0.2 m to 0.9 m on the west abutment (Figure 7b). This is a cause of concern and calls for a thorough investigation, as a dam’s crest, especially when made of concrete, should not display such varying rates of displacement. This analysis was done by keeping a threshold of coherence value at 0.9, which is much higher than the recommended threshold of >0.4 for reliability of results. As mentioned earlier in Section 3.3, coherence value represents the level of similarity between two given satellite acquisitions. A threshold of 0.9 indicates that the results obtained in this study are highly reliable and accurate. Additionally, the west abutment is located close to the low flow outlets and the emergency spillway, which may cause more stress on the soil layers, and which could further lead to displacement increase. Analysis performed by CoastSat over the Main Dam also complimented the results obtained previously with a difference in trend observed along the water edge over the Main Dam’s east and west abutment (Cross-sections 1 and 6). Even the analysis performed without setting any threshold for coherence values displayed a varying displacement across the Main Dam’s crest (Figure 12). The threshold was removed only in that part of the analysis to obtain a continuity of images to observe the change in trend of annual displacement across the Main Dam (Figure 13 Top). The results again showed varying subsidence and uplift across different sections of the Main Dam since the beginning of the first filling period in July 2020. It also reflected the effect of two major factors namely the water table change according to the rainy or drought seasons, and the construction progress. We believe that results of the Main Dam middle section displacement are less reliable since the Main Dam was under construction at the time of the study (July 2021). However, the displacement results for the Main Dam extremities and the Saddle Dam are accurate and can be depended upon for studying the local land displacement over the project location. Over time, with an increase in construction and continued filling periods, these varying levels of displacements might turn into a direct threat and danger to the stability of the structure and could consequently pose a threat to downstream areas such as Sudan, in case of possible failure. A recent study by Heggy et al. [49] discussed water deficit for Egypt by almost 31 BCM/year, which equaled to a third of Egypt’s then water budget. Yet another study by Kahsay et al. [50] found that there would be negative effects on Egypt’s economy until the GERD filling is completed. This is with a caveat that further major climatic changes do not disrupt any of its operations. Considering these major consequences to downstream countries, it is imperative that these questions around varying vertical displacements must be investigated and answered by the concerned authorities for a peaceful and productive cooperation between all the countries involved.
It is noteworthy that embankment dams are generally more vulnerable to land displacement due to the quality of the construction materials and water-impermeable items. The Saddle Dam, which is a rockfill dam, presents the most controversial component of GERD. We believe that the unusual geometric dam shape and the nature of the geological characteristics of the surrounding soil contribute to issues around the safety of the Saddle Dam. Egypt and Sudan widely and globally shared and discussed these arguments through international venues and media outlets in the light of the lack of scientific documents addressing these concerns that we can rely on. A non-partisan Eastern Nile Working Group, consisting of seventeen world-renowned water resources scholars, had convened for a workshop in Massachusetts Institute of Technology, Cambridge, Massachusetts USA, to discuss the various aspects of GERD in line with its technical design, cooperation and shared benefits. One of the four issues laid out in the report was regarding the technical issues associated with the GERD, where they discussed the long length of the Saddle Dam and its foundation, which gives rise to weak zones. They further mentioned that the risks posed by the Saddle Dam may not have been fully appreciated or analyzed [35]. Our study highlighted these weak zones, identified critical nodes over them (Figure 8, Figure 9 and Figure 10), and the results displayed varying levels of non-uniform subsidence across the nine cross-sections of the Saddle Dam (Figure 6). The analysis conducted at the seven critical nodes showed varying levels of subsidence and uplift. In fact, the displacements over sections at closer proximity to each other displayed both, subsidence as well as uplift (Figure 11). These observed displacements have occurred in absence of water pressure or its weight on the Saddle Dam structure. We believe that these displacements over Saddle Dam coincide with the tectonic faults underneath, accompanied by rain and the weight of the dam itself. We acknowledge that we can enhance our findings using higher resolution SAR height images such as TeraSAR-X or COSMO. This enhancement is a work in progress as part of our future investigations. We believe that this study presents the most adequate source of information for the GERD dams’ construction experts and reviewers to evaluate GERD’s stability. It only lacks ground data validation and intercomparison due to the absence of such data.

5. Conclusions

This study presents a comprehensive monitoring of the vertical displacement of the GERD during the filling process and its implications on the downstream countries. The analysis showed the alarming differential displacement at different sections of the GERD’s Main and Saddle Dams using the Sentinel-1 SAR DInSAR technology. The uneven vertical displacement in different places, especially in the Saddle Dam weak zones, requires the development of a careful monitoring system. Based on the wide gap of displacement at the east and west abutment of the Main Dam, we believe that rapid filling of the dam may lead to major problems and irregular subsidence, which makes the safety of the dam at high risk. This study raises questions regarding the stability and consequently, the safety concerning its structure, as the consequences in event of a failure are dire. This study presents an early warning on the massive risk posed on a huge population in Sudan soon and calls for further appropriate scientific investigations. Additionally, there is a serious need for daily coordination and data exchange with downstream countries regarding levels, rainfall rates, and water incoming from the dam and its quality.

Author Contributions

Conceptualization, H.E.-A. and A.F.; data analysis, H.E.-A., A.F., R.T. and W.L.; funding acquisition, H.E.-A. and D.S.; methodology, A.F., R.T., W.L., H.E.-A. and T.P.; software, H.E.-A., A.F., R.T., N.L., and E.L.; resources, H.E.-A., E.L., D.S.; validation, H.E.-A., A.F., R.T., N.L., E.L. and W.L.; writing—original draft, H.E.-A., R.T., and W.L.; writing—review and editing, H.E.-A., A.F., R.T., W.L., T.P., M.A.S. and D.S. All authors have read and agreed to the published version of the manuscript.

Funding

We would like to acknowledge the support from the Earth Systems Science and Data Solutions (EssDs) Lab, Schmid College of Science and Technology, Chapman University.

Data Availability Statement

Data available in a publicly accessible repository that does not issue DOIs. Publicly available datasets were analyzed in this study. This data can be found here: https://search.asf.alaska.edu/#/.

Acknowledgments

The authors acknowledge the support from the Earth Systems Science and Data Solutions (EssDs) Lab, Schmid College of Science and Technology, Chapman University. The authors would like to extend their appreciation to the use of the Samueli Laboratory in Computational Sciences in the Schmid College of Science and Technology, Chapman University for data processing and analysis. The authors would like to acknowledge using the Ethiopian Government, Ethiopian Electric Power Cooperation (EEPCO) document named “202 GEN R SP 010 A, MD1, rev22mar12.doc” by Salini Construttori S.p.A, and Studio Pietrangeli consulting engineers for providing the geology map and tectonic elements shown in this paper as Figure 8.

Conflicts of Interest

The authors declare no conflict of interest.

References

  1. Madson, A.; Sheng, Y. Reservoir induced deformation analysis for several filling and operational scenarios at the grand Ethiopian renaissance dam impoundment. Remote Sens. 2020, 12, 1886. [Google Scholar] [CrossRef]
  2. Siddig, K.; Basheer, M.; Luckmann, J. Economy-wide assessment of potential long-term impacts of the Grand Ethiopian Renaissance Dam on Sudan. Water Int. 2021, 46, 325–341. [Google Scholar] [CrossRef]
  3. Kansara, P.; Li, W.; El-Askary, H.; Lakshmi, V.; Piechota, T.; Struppa, D.; Abdelaty Sayed, M. An Assessment of the Filling Process of the Grand Ethiopian Renaissance Dam and Its Impact on the Downstream Countries. Remote Sens. 2021, 13, 711. [Google Scholar] [CrossRef]
  4. Elsayed, H.; Djordjević, S.; Savic, D.; Tsoukalas, I.; Makropoulos, C. The Nile Water-Food-Energy Nexus under Uncertainty: Impacts of the Grand Ethiopian Renaissance Dam. J. Water Resour. Plan. Manag. 2020, 146, 04020085. [Google Scholar] [CrossRef]
  5. Abtew, W.; Dessu, S.B. Grand Ethiopian renaissance dam site importance. In The Grand Ethiopian Renaissance Dam on the Blue Nile; Springer: Berlin/Heidelberg, Germany, 2019; pp. 63–77. [Google Scholar]
  6. Basheer, M.; Wheeler, K.G.; Elagib, N.A.; Etichia, M.; Zagona, E.A.; Abdo, G.M.; Harou, J.J. Filling Africa’s Largest Hydropower Dam Should Consider Engineering Realities. One Earth 2020, 3, 277–281. [Google Scholar] [CrossRef]
  7. Dandrawy, M.E.; Omran, E.-S.E. Integrated Watershed Management of Grand Ethiopian Renaissance Dam via Watershed Modeling System and Remote Sensing. In Environmental Remote Sensing in Egypt; Springer: Berlin/Heidelberg, Germany, 2020; pp. 533–574. [Google Scholar]
  8. Wheeler, K.G.; Jeuland, M.; Hall, J.W.; Zagona, E.; Whittington, D. Understanding and managing new risks on the Nile with the Grand Ethiopian Renaissance Dam. Nat. Commun. 2020, 11, 5222. [Google Scholar] [CrossRef]
  9. Zhang, Y.; Block, P.; Hammond, M.; King, A. Ethiopia’s Grand Renaissance Dam: Implications for downstream riparian countries. J. Water Resour. Plan. Manag. 2015, 141, 05015002. [Google Scholar] [CrossRef]
  10. Gabriels, D.; Cornelis, W.M. Human-induced land degradation. In Land Use, Land Cover and Soil Sciences—Volume III: Land Use Planning; EOLSS Publications: Abu Dhabi, UAE, 2009; pp. 131–143. [Google Scholar]
  11. Harris, A. What Is Deformation in Earth Science? Available online: https://sciencing.com/deformation-earth-science-21924.html (accessed on 10 July 2021).
  12. Gökalp, E.; Taşçı, L. Deformation Monitoring by GPS at Embankment Dams and Deformation Analysis. Surv. Rev. 2009, 41, 86–102. [Google Scholar] [CrossRef]
  13. Sjödahl, M.; Gren, P.; Sárady, I.; Miroshnicova, N. Laser hole drilling process studied using laser speckle correlation. In Speckle06: Speckles, From Grains to Flowers; International Society for Optics and Photonics: Bellingham, WA, USA, 2006; Volume 6341, p. 63412M. [Google Scholar]
  14. Borghero, C. Feasibility Study of Dam Deformation Monitoring in Northern Sweden Using Sentinel1 SAR Interferometry. Master’s Thesis, University of Gävle, Gävle, Sweden, 2018. [Google Scholar]
  15. Maltese, A.; Pipitone, C.; Dardanelli, G.; Capodici, F.; Muller, J.-P. Toward a Comprehensive Dam Monitoring: On-Site and Remote-Retrieved Forcing Factors and Resulting Displacements (GNSS and PS–InSAR). Remote Sens. 2021, 13, 1543. [Google Scholar] [CrossRef]
  16. Wang, G.; Li, P.; Li, Z.; Ding, D.; Qiao, L.; Xu, J.; Li, G.; Wang, H. Coastal Dam Inundation Assessment for the Yellow River Delta: Measurements, Analysis and Scenario. Remote Sens. 2020, 12, 3658. [Google Scholar] [CrossRef]
  17. Chen, Y.; Ahmed, M.; Tangdamrongsub, N.; Murgulet, D. Reservoir-Induced Land Deformation: Case Study from the Grand Ethiopian Renaissance Dam. Remote Sens. 2021, 13, 874. [Google Scholar] [CrossRef]
  18. Gama, F.F.; Mura, J.C.; Paradella, W.R.; de Oliveira, C.G. Deformations Prior to the Brumadinho Dam Collapse Revealed by Sentinel-1 InSAR Data Using SBAS and PSI Techniques. Remote Sens. 2020, 12, 3664. [Google Scholar] [CrossRef]
  19. GUPTA, N.; SYED, T.H.; ATHIPHRO, A. Monitoring subsurface coal fires in Jharia coalfield using observations of land subsidence from differential interferometric synthetic aperture radar (DInSAR). J. Earth Syst. Sci. 2013, 122, 1249–1258. [Google Scholar] [CrossRef] [Green Version]
  20. Zhou, L.; Zhang, D.; Wang, J.; Huang, Z.; Pan, D. Mapping Land Subsidence Related to Underground Coal Fires in the Wuda Coalfield (Northern China) Using a Small Stack of ALOS PALSAR Differential Interferograms. Remote Sens. 2013, 5, 1152–1176. [Google Scholar] [CrossRef] [Green Version]
  21. Jiang, L.; Lin, H.; Ma, J.; Kong, B.; Wang, Y. Potential of small-baseline SAR interferometry for monitoring land subsidence related to underground coal fires: Wuda (Northern China) case study. Remote Sens. Environ. 2011, 115, 257–268. [Google Scholar] [CrossRef]
  22. Rudy, A.C.A.; Lamoureux, S.F.; Treitz, P.; Short, N.; Brisco, B. Seasonal and multi-year surface displacements measured by DInSAR in a High Arctic permafrost environment. Int. J. Appl. Earth Obs. Geoinf. 2018, 64, 51–61. [Google Scholar] [CrossRef]
  23. Moghaddam, N.; Nourollah, H.; Vasco, D.W.; Samsonov, S.V.; Rüdiger, C. Interferometric SAR modelling of near surface data to improve geological model in the Surat Basin, Australia. J. Appl. Geophys. 2021, 194, 104444. [Google Scholar] [CrossRef]
  24. Attalla, R. Grand Ethiopian Renaissance Dam (GERD); Worcester Polytechnic Institute: Worcester, MA, USA, 2015; pp. 23–24. [Google Scholar]
  25. Grand Ethiopian Renaissance Dam (Ethiopia) | Studio Pietrangeli. Available online: https://www.pietrangeli.com/gerdp-hydroelectric-plant-ethiopia-africa (accessed on 12 July 2021).
  26. Sentinel-1—Data Products—Sentinel Online—Sentinel Online. Available online: https://sentinel.esa.int/web/sentinel/missions/sentinel-1/data-products (accessed on 16 July 2021).
  27. Sentinel-2—Missions—Sentinel Online—Sentinel Online. Available online: https://sentinel.esa.int/web/sentinel/missions/sentinel-2 (accessed on 17 July 2021).
  28. Vos, K.; Splinter, K.D.; Harley, M.D.; Simmons, J.A.; Turner, I.L. CoastSat: A Google Earth Engine-enabled Python toolkit to extract shorelines from publicly available satellite imagery. Environ. Model. Softw. 2019, 122, 104528. [Google Scholar] [CrossRef]
  29. Maneja, R.H.; Miller, J.D.; Li, W.; Thomas, R.; El-Askary, H.; Perera, S.; Flandez, A.V.B.; Basali, A.U.; Alcaria, J.F.A.; Gopalan, J.; et al. Multidecadal analysis of beach loss at the major offshore sea turtle nesting islands in the northern Arabian Gulf. Ecol. Indic. 2021, 121, 107146. [Google Scholar] [CrossRef]
  30. Braun, A.; Veci, L. TOPS Interferometry Tutorial; SkyWatch Space Applications Inc.: Waterloo, ON, Canada, 2021; 25p, Available online: https://step.esa.int/docs/tutorials/S1TBX%20TOPSAR%20Interferometry%20with%20Sentinel-1%20Tutorial_v2.pdf (accessed on 3 September 2021).
  31. Goldstein, R.M.; Werner, C.L. Radar interferogram filtering for geophysical applications. Geophys. Res. Lett. 1998, 25, 4035–4038. [Google Scholar] [CrossRef] [Green Version]
  32. Otsu, N. A Threshold Selection Method from Gray-Level Histograms. IEEE Trans. Syst. Man Cybern. 1979, 9, 62–66. [Google Scholar] [CrossRef] [Green Version]
  33. Lorensen, W.E.; Cline, H.E. Marching cubes: A high resolution 3D surface construction algorithm. ACM SIGGRAPH Comput. Graph. 1987, 21, 163–169. [Google Scholar] [CrossRef]
  34. Cipolletti, M.P.; Delrieux, C.A.; Perillo, G.M.E.; Cintia Piccolo, M. Superresolution border segmentation and measurement in remote sensing images. Comput. Geosci. 2012, 40, 87–96. [Google Scholar] [CrossRef]
  35. MIT Abdul Latif Jameel World Water and Food Security Laboratory. The Grand Ethiopian Renaissance Dam: An Opportunity for Collaboration and Shared Benefits in the Eastern Nile Basin; MIT Abdul Latif Jameel World Water and Food Security Laboratory: Cambridge, MA, USA, 2015. [Google Scholar]
  36. Ullo, S.L.; Addabbo, P.; Martire, D.D.; Sica, S.; Fiscante, N.; Cicala, L.; Angelino, C.V. Application of DInSAR Technique to High Coherence Sentinel-1 Images for Dam Monitoring and Result Validation Through In Situ Measurements. IEEE J. Sel. Top. Appl. Earth Obs. Remote Sens. 2019, 12, 875–890. [Google Scholar] [CrossRef]
  37. Fárová, K.; Jelének, J.; Kopačková-Strnadová, V.; Kycl, P. Comparing DInSAR and PSI Techniques Employed to Sentinel-1 Data to Monitor Highway Stability: A Case Study of a Massive Dobkovičky Landslide, Czech Republic. Remote Sens. 2019, 11, 2670. [Google Scholar] [CrossRef] [Green Version]
  38. Rocca, F. DINSAR: Differential SAR Interferometry; Earth ESA: Paris, France, 2007; 32p, Available online: https://earth.esa.int/landtraining07/D1LB5-1-Rocca.pdf (accessed on 3 September 2021).
  39. Yang, Y.; Pepe, A.; Manzo, M.; Bonano, M.; Liang, D.N.; Lanari, R. A simple solution to mitigate noise effects in time-redundant sequences of small baseline multi-look DInSAR interferograms. Remote Sens. Lett. 2013, 4, 609–618. [Google Scholar] [CrossRef]
  40. Gama, F.F.; Paradella, W.R.; Mura, J.C.; de Oliveira, C.G. Advanced DINSAR analysis on dam stability monitoring: A case study in the Germano mining complex (Mariana, Brazil) with SBAS and PSI techniques. Remote Sens. Appl. Soc. Environ. 2019, 16, 100267. [Google Scholar] [CrossRef]
  41. Abebe, T.; Mazzarini, F.; Innocenti, F.; Manetti, P. The Yerer-Tullu Wellel volcanotectonic lineament: A transtensional structure in central Ethiopia and the associated magmatic activity. J. Afr. Earth Sci. 1998, 26, 135–150. [Google Scholar] [CrossRef]
  42. Davidson, A. compiler. The Omo river project, reconnaissance geology and geochemistry of parts of Ilubabor, Kefa, Gemu Gofa and Sidamo, Ethiopia. Ethiop. Inst. Geol. Surv. Bull 1983, 2, 1–89. [Google Scholar]
  43. Stratigraphic and Structural Evolution of the Blue Nile Basin, Northwestern Ethiopian Plateau—Gani—2009—Geological Journal—Wiley Online Library. Available online: https://onlinelibrary.wiley.com/doi/abs/10.1002/gj.1127 (accessed on 18 July 2021).
  44. Holmes, A. The sequence of Precambrian orogenic belts in South and central Africa. Proceed 18th Intern. Geol. Congr. Lond. 1948 1951, 14, 254–269. [Google Scholar]
  45. Tefera, M.; Chernet, T.; Haro, W. Explanation of the Geological Map of Ethiopia; Geological Survey of Ethiopia: Addis Ababa, Ethiopia, 1996. [Google Scholar]
  46. Pietrangeli, G.; Pittalis, G.; Rinaldi, M.; Cifra, R. Design and construction of composite cut-off system at Grand Ethiopian Renaissance Dam, Ethiopia. In Tunnels and Underground Cities: Engineering and Innovation Meet Archaeology, Architecture and Art; CRC Press: Boca Raton, FL, USA, 2019; ISBN 978-0-429-42444-1. [Google Scholar]
  47. Editor, E.C. Two Bottom Outlets Of GERD Completed, Become Operational (18 April 2021)—Embassy of Ethiopia 2021. Available online: https://ethiopianembassy.org/two-bottom-outlets-of-gerd-completed-become-operational-april-18-2021/ (accessed on 3 September 2021).
  48. Egypt: Ethiopian Claim that 2 GERD Bottom Outlets are Capable of Enabling Average Flow of Blue Nile “Incorrect”. Available online: https://www.egypttoday.com/Article/1/101074/Egypt-Ethiopian-claim-that-2-GERD-bottom-outlets-are-capable (accessed on 17 July 2021).
  49. Heggy, E.; Sharkawy, Z.; Abotalib, A.Z. Egypt’s water budget deficit and suggested mitigation policies for the Grand Ethiopian Renaissance Dam filling scenarios. Environ. Res. Lett. 2021, 16, 074022. [Google Scholar] [CrossRef]
  50. Kahsay, T.N.; Kuik, O.; Brouwer, R.; van der Zaag, P. Estimation of the transboundary economic impacts of the Grand Ethiopia Renaissance Dam: A computable general equilibrium analysis. Water Resour. Econ. 2015, 10, 14–30. [Google Scholar] [CrossRef]
Figure 1. Insert Figure (a) shows the Nile River basin and the sub-basins—White Nile River basin and Blue Nile River basin. The White Nile River and the Blue Nile River merge at Khartoum, Sudan, which is shown as the Junction Point in the figure. Inset Figure (b) shows the Blue Nile River basin along with the location of GERD Dam near the Ethiopian-Sudanese border. Insert Figure (c) shows the GERD project location and GERD components including the Main and Saddle Dams. Inserts (a,b) are adopted from [3] with permission.
Remotesensing 13 04287 g001
Figure 2. Preliminary analysis of the quality of the ground displacement output of GERD for 109 Sentinel-1 SAR images during the period (December 2016–July 2021).
Remotesensing 13 04287 g002
Figure 3. Processing of two Sentinel-1 acquisitions displayed over the GERD location showing (a) phase difference and (b) coherence.
Remotesensing 13 04287 g003aRemotesensing 13 04287 g003b
Figure 4. A base map showing the cross-sections where the vertical displacements are calculated and presented for the GERD’s (a) Main Dam and (b) Saddle Dam.
Remotesensing 13 04287 g004
Figure 5. Observed vertical displacement over the GERD’s Main Dam at (a) east and west abutment, (b) west and east sides and (c) low flow outlet and early generation turbines.
Remotesensing 13 04287 g005
Figure 6. Observed vertical displacement over the GERD’s Saddle Dam at (a) tunnels 1 to 5, (b) North and South abutment and their extensions.
Remotesensing 13 04287 g006
Figure 7. DInSAR displacement spatially observed over the GERD’s Main Dam (a,b) and Saddle Dam (c,d).
Remotesensing 13 04287 g007
Figure 8. Tectonic elements for the Blue Nile Valley showing (a) the structural map as obtained from the Hillshade onstained from Shuttle DTM (b) zoom in shot over the Saddle Dam region and all weak zones.
Remotesensing 13 04287 g008
Figure 9. Saddle Dam general layout with (a) schematic geological plan of the Saddle Dam adopted from [46] with permission, (b) Identified critical nodes 1 to 5 within weak zone with associated vertical displacement overlaid from this current research between tunnels 1 and 2; and (c) Identified critical nodes 6 and 7 within weak zones with associated vertical displacement overlaid from this current research on the South abutment.
Remotesensing 13 04287 g009
Figure 10. Vertical displacement observed over the seven critical nodes identified on the Saddle Dam showing (a) zoomed scene on critical nodes 1 to 5 and (b) focused scene on critical nodes 6 and 7.
Remotesensing 13 04287 g010
Figure 11. Vertical displacement analysis over the seven critical nodes identified at the Saddle Dam for the period from 2017 till 2021.
Remotesensing 13 04287 g011
Figure 12. Accumulated vertical displacement from January 2017 till July 2021 over the GERD’s (Top) Main Dam and (Bottom) Saddle Dam.
Remotesensing 13 04287 g012
Figure 13. Annual accumulated vertical displacements from 2017 till 2021 over the GERD’s Main Dam (Top) and Saddle Dam (Bottom).
Remotesensing 13 04287 g013
Figure 14. CoastSat analysis over the GERD’s Main Dam showing the change in water edge along different locations identified from 1 to 6 following same cross-sections presented in Figure 4a.
Remotesensing 13 04287 g014
Publisher’s Note: MDPI stays neutral with regard to jurisdictional claims in published maps and institutional affiliations.

