
State of Trade 2023: Inclusive Trade
ISSN 2562-8321
Table of contents
- Message from the Minister
- Executive summary
- Part 1: 2022 in review
- Part 2: Inclusive trade
- Acknowledgements
- Bibliography
Message from the Minister
I am excited to present Canada's State of Trade 2023 on behalf of the Government of Canada.
Despite the year's challenges, Canadian trade reached record highs again in 2022. This year, the report highlights Canada's inclusive approach to trade, our progress, and the results it brings. As we build on this momentum, we recognize that trade works best when everyone benefits.
Even with Russia's illegal and unjustified invasion of Ukraine last year, which has caused a horrific humanitarian crisis and sent economic shockwaves around the world, global trade has remained resilient. Canada continues to uphold and promote rules-based trade, providing confidence and predictability for our businesses.
Both exports and imports reached record levels, with Canada's two-way goods and services trade expanding to nearly $1.9 trillion in 2022. Throughout the year, supply chain pressures eased, creating increased opportunity for investment in vehicle manufacturing, among other sectors. In addition, services trade has surpassed its pre-pandemic levels, helping tourism and transportation trade see strong growth.
With all this positive momentum, we are building on our commitment of diversifying trade and creating more opportunities for Canadian businesses — including those owned by women, Black and other racialized entrepreneurs, Indigenous Peoples, members of the 2SLGBTQI+ community, and young people — to benefit from international trade. Take the Indo-Pacific Strategy, for example, which received support in Budget 2023. The Strategy will help Canadians and businesses benefit from engagement with the fastest-growing region in the world. It will create good jobs and inclusive opportunities on both sides of the Pacific.
The State of Trade 2023 shares our latest research and understanding of how small and medium enterprises (SMEs), women, Indigenous Peoples, and other diverse groups engage in international trade. This understanding guides our trade policies and shapes the customized supports we offer through our Trade Commissioner Service. As the momentum of our economic recovery continues — and as our economic resilience grows — it is critical to ensure that everyone can benefit from building a stronger, more sustainable and more secure Canadian economy. That's why our government will continue to create opportunities that open doors for Canadians and Canadian businesses around the world.
The Honourable Mary Ng
Minister of Export Promotion, International Trade and Economic Development
Executive summary
The global and Canadian economies continued to adapt to the realities of COVID-19 while new challenges emerged in 2022. The year 2022 began with the Omicron variant continuing to slow progress toward the full reopening of many economies, affecting China particularly hard. February 2022 brought further turmoil as Russia began its illegal invasion of Ukraine. The war led to immense human tragedy and economic challenges, including soaring commodity prices. This added fuel to the fire of rising global inflation, which peaked in 2022. The good news stories – including the continued administration of COVID-19 vaccines, the reopening of borders, the easing of supply chain issues, and strong demand – helped keep the global economy afloat. Nonetheless, the slowdown was widespread. Advanced economies, and emerging markets and developing economies saw growth slow to 2.7% and 4.0% in 2022, respectively. Overall, global economic growth advanced by 3.5% in 2022, following the 6.3% rebound witnessed in 2021.
In Canada, economic growth kept pace with the rest of the world. The Canadian economy expanded by 3.4% in 2022, although the expansion came to a halt and the economy contracted in the final quarter of the year as heightened inflation affected interest-rate-sensitive sectors. Indeed, the Bank of Canada had raised interest rates to 4.25% by the end of 2022 in response to inflation reaching a 40-year high on an annual average basis. Meanwhile, a robust labour market – with unemployment at an over 45-year low – supported consumer spending throughout 2022.
Canada's services industries grew faster, at 3.7%, than goods industries, at 3.4%, in 2022. Services growth was led by professional and technical services and public-facing industries, such as accommodation and food services, which benefited from the removal of COVID-19-related restrictions. Goods industries growth was widespread, with manufacturing posting the strongest contribution to growth as supply-chain challenges brought on by the pandemic and semi-conductor shortages eased.
With a surge in commodity prices and a strong U.S. economic performance, Canadian trade broke records for the second year in a row. Canada's goods and services exports increased by 21.2% to reach $940.4 billion in 2022. In part due to the war in Ukraine, commodity prices soared such that Canadian resource products accounted for over three-quarters of goods export growth. Overall, price increases drove the advance in goods exports, and to a lesser extent in goods imports, in 2022. The removal of COVID-19-related restrictions helped growth in services exports, led by travel services. However, travel services remain below their pre-pandemic levels.
Canada's goods and services imports advanced 20.5% to reach $936.2 billion in 2022. Growth in consumer goods, energy products and vehicles led goods import growth, while travel services dominated the services import expansion.
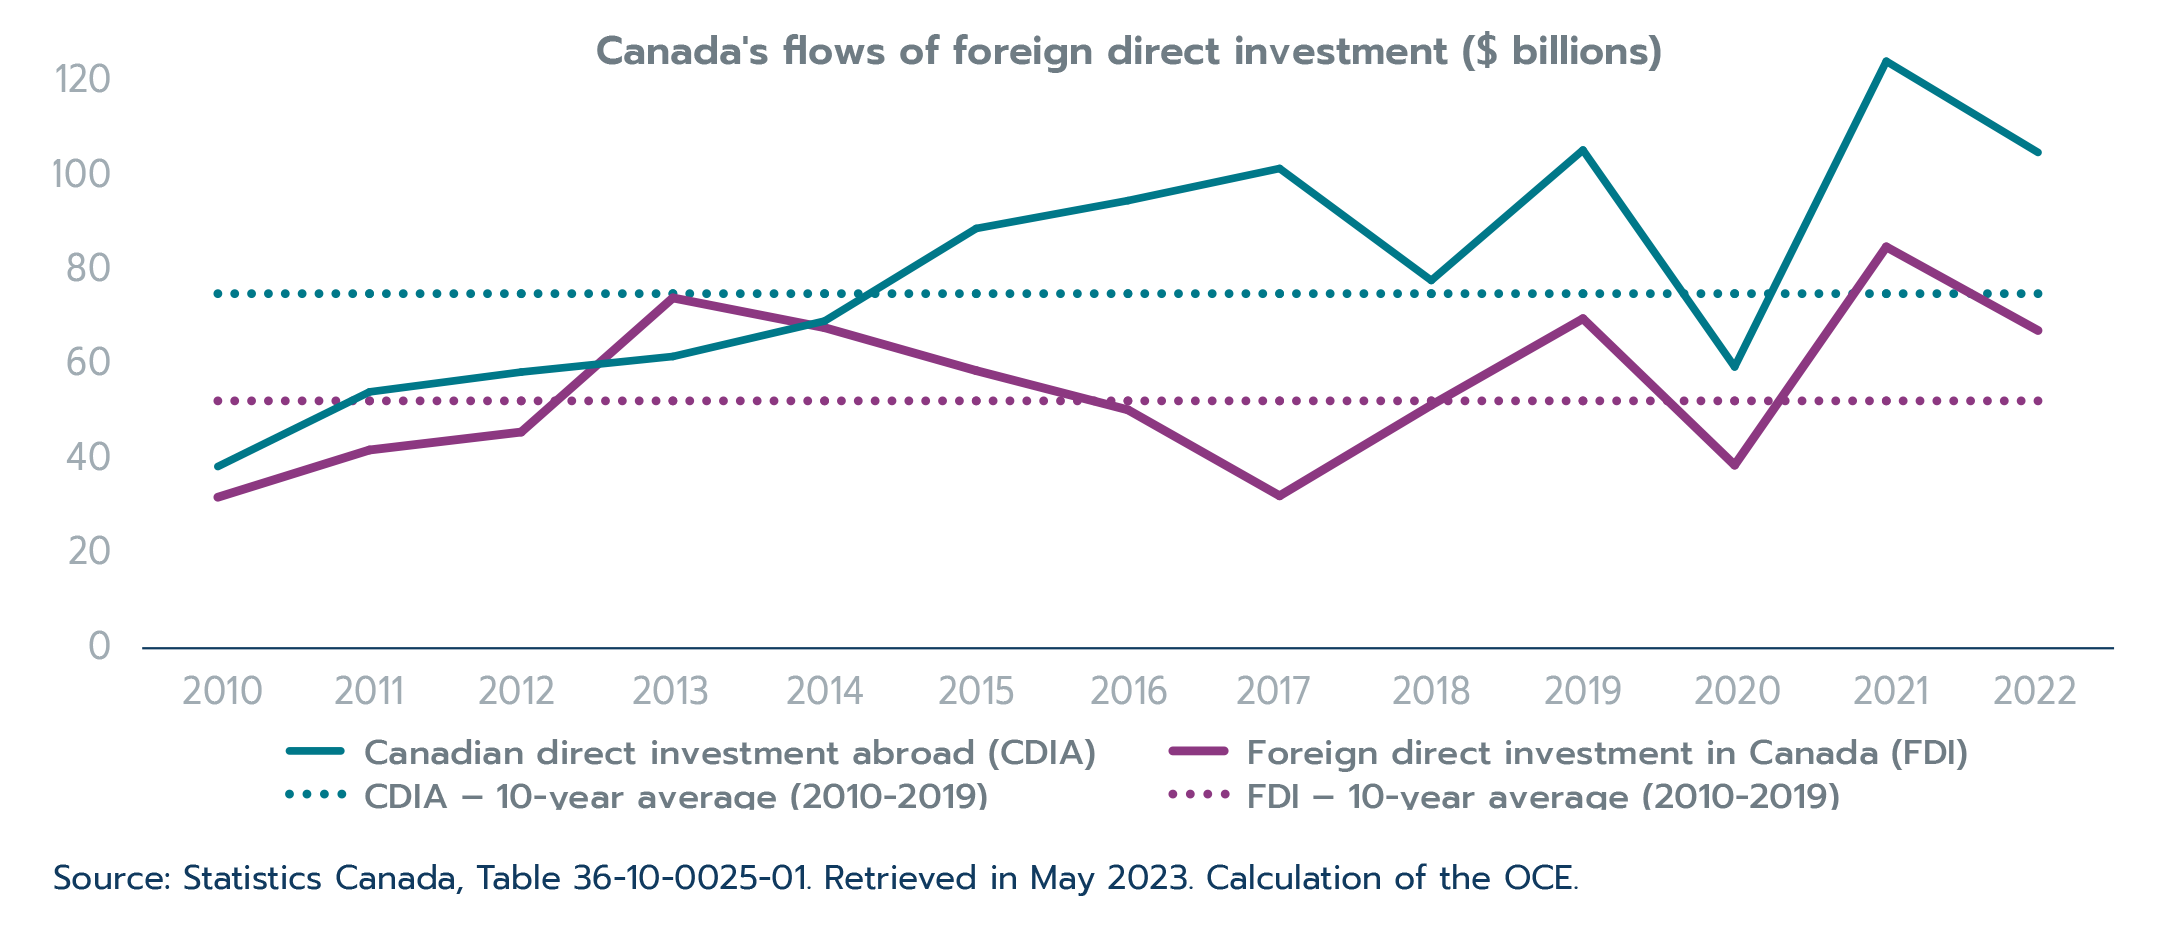
Canada's two-way international investment flows slowed in 2022, following a significant rebound in 2021. Direct investment flows into Canada contracted by 21.5%, while Canadian direct investment abroad decreased by 15.8%. Canadian investment flows followed the overall trends in global investment in 2022. Nevertheless, both inward and outward investment flows remained above their average levels seen in the pre-pandemic decade (2010–2019).
Canada is a trading nation, and trade brings many benefits to businesses, workers and consumers. However, we cannot take for granted that these benefits will automatically flow to everyone. The State of Trade 2023 features inclusive trade research by the Office of the Chief Economist (OCE). Inclusive trade research is centered on understanding how women, Indigenous and other racialized people, youth, 2SLGBTQI+, and small and medium enterprises (SMEs) benefit from trade and investment. The focus is on identifying both the challenges and success strategies for underrepresented groups in going global to inform policies and programs designed to ensure that everyone has the opportunity to benefit from Canada's international trade.
OCE's inclusive research reveals Canada's progress on the inclusive trade front. Canadian SMEs were more likely to export in 2020 (12.1%) than they were a decade ago (10.4%), and the share of their revenues coming from export sales has increased. In the same timeframe, women-owned SMEs more than doubled their likelihood to export, from 5.0% to 10.4%. Recent OCE work in partnership with the Canadian Council for Aboriginal Business emphasizes that Indigenous-owned SMEs put a strong focus on global markets, and finds that Indigenous women-owned SMEs tend to export at similar rates to Indigenous men-owned SMEs.
Another part of Canada's inclusive trade strategy involves a quantitative assessment of the inclusive elements under a trade agreement. The OCE conducts this analysis both before and after trade policies are implemented. Economic modelling conducted before negotiations reveals net positive gain for workers, including women, associated with the implementation of free trade agreements. Analysis of the Comprehensive and Progressive Agreement for Trans-Pacific Partnership (CPTPP)'s first year of implementation reveals that Canadian SMEs increased their dutiable goods exports to new CPTPP markets by 12.3%, while SMEs with high export growth increased their hiring of women by 11.4%.
While the expanded involvement of underrepresented groups in trade signifies meaningful progress, we know that gaps remain. For example, SMEs—particularly Indigenous-owned SMEs—are underrepresented among exporting firms, and women-owned SMEs are less export intensive. OCE research has identified specific challenges facing each of these groups, ranging from a lack of market knowledge among women to difficulties in obtaining access to financing and a lack of digital and physical infrastructure for Indigenous entrepreneurs.
Importantly, OCE research has also uncovered enabling factors and successful strategies. For example, SMEs using e-commerce are 13.1% more likely to export, with an even stronger effect for women-owned SMEs (Sekkel and Wang, forthcoming). Virtual sales are also important for Indigenous-owned SMEs and are associated with a six-fold increase in the odds of exporting (Canadian Council for Aboriginal Business and Global Affairs Canada, 2023).
With this enhanced understanding, Global Affairs Canada is providing support to underrepresented groups to participate fully in international trade by continuing to ensure that trade agreements specifically reflect the needs of these groups, by offering customized programs through its Trade Commissioner Service, and by working across government to develop evidence-based policies and programs for these groups. This work recognizes that an inclusive trade approach is not a zero-sum game; increased participation in trade by more groups generates broader economic opportunities and prosperity for all Canadians.
Part 1: 2022 in review
Part 1: At a glance
Global economic growth slowed in 2022 amidst continued waves of COVID-19, the war in Ukraine, and rising inflation and interest rates – growth will slow further in 2023.
- Global growth slows: As global inflation reached decade highs, economic growth slowed to 2.7% in advanced economies and 4.0% in emerging markets and developing economies in 2022.
- The International Monetary Fund expects global growth to slow from 3.5% in 2022 to 3.0% in 2023.
- Trade holds up: World merchandise trade volumes (up 2.7%) fared better than expected in 2022, but growth slowed toward the end of the year, dragged down by waves of COVID-19, the war in Ukraine, high commodity prices, and tightened monetary policy.
Text version
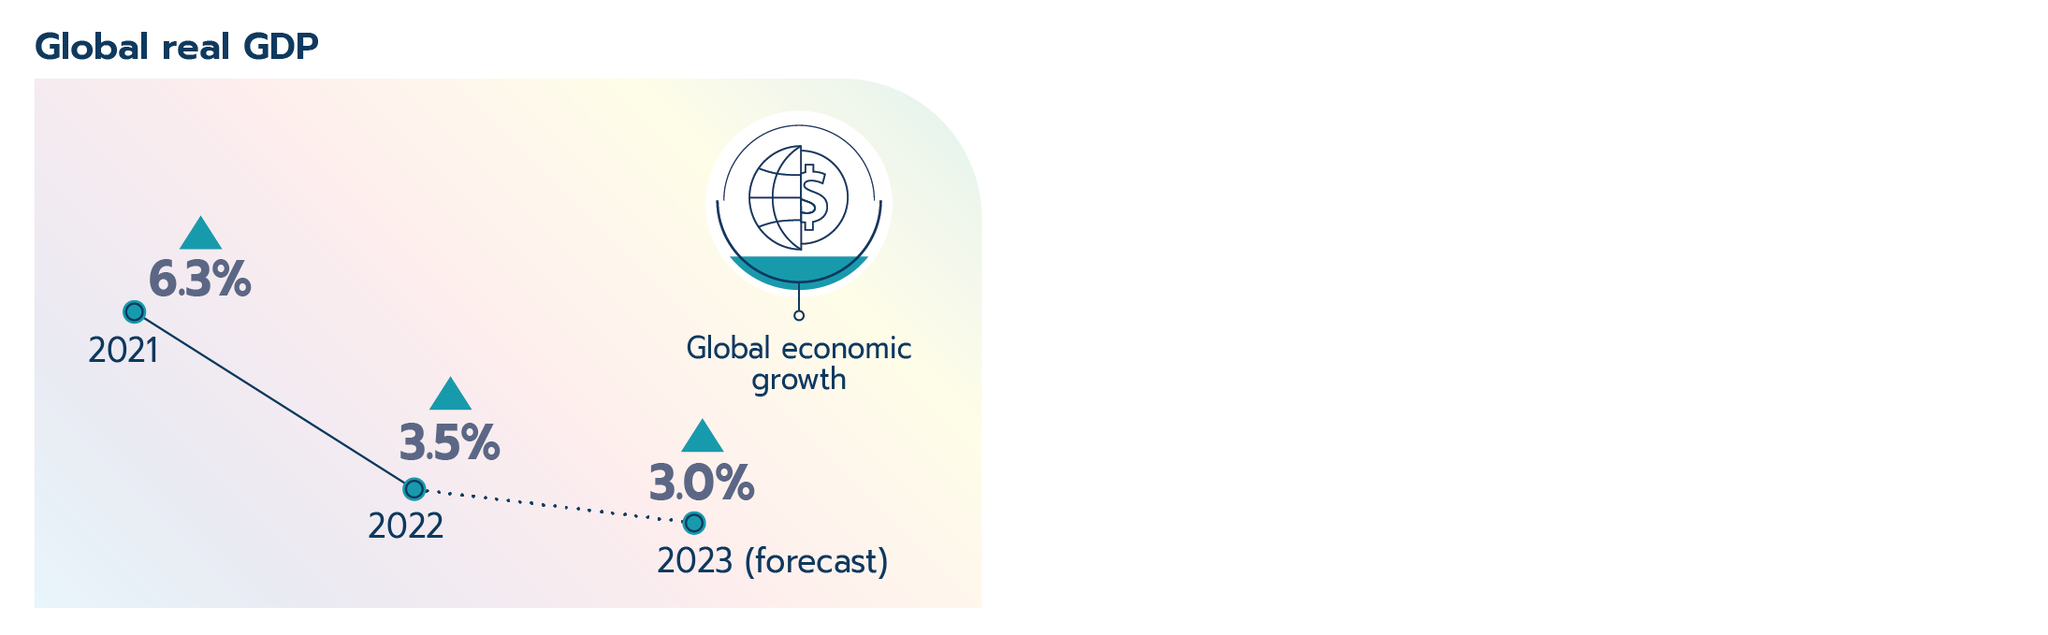
Global real GDP:
- 2021: 6.3%
- 2022: 3.5%
- 2023: 3.0%
Canadian economic performance was robust in 2022, advancing 3.4% – compared to its G7 peers, Canada has seen the second strongest recovery from the pandemic shock.
- Services led growth: Services industries – helped by the removal of COVID-19-related restrictions – led Canadian growth in 2022, expanding by 3.7%.
- Goods growth continues: Growth in goods industries (3.4%) was robust in 2022, supported by the easing of supply-chain issues and high commodity prices, among other factors.
- Tight labour markets: The Canadian labour market was historically tight in 2022, with low unemployment (5.3%) and high employment and job vacancies.
- Record inflation: Inflation reached a 40-year high at 6.8% in 2022. This led the Bank of Canada to raise its target rate to 4.25 % – the highest in nearly 15 years.
Text version
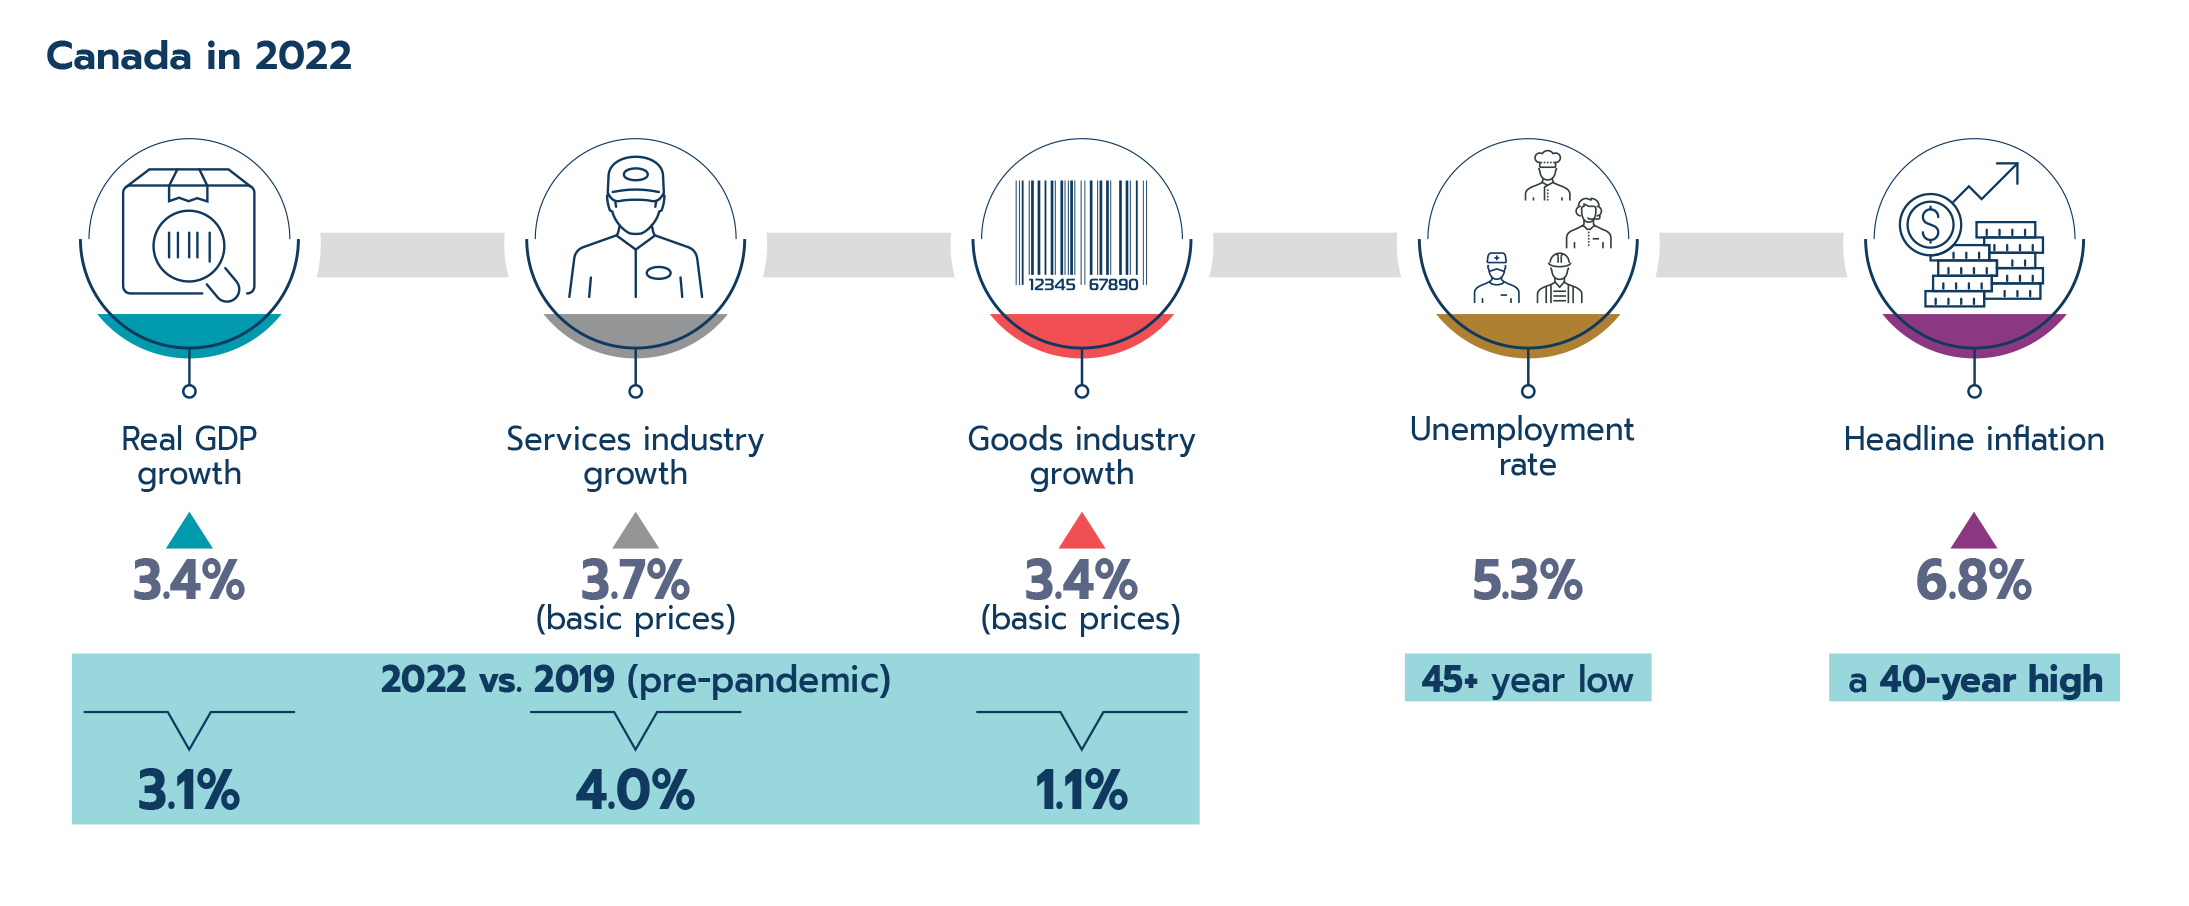
Canada in 2022
- Real GDP growth: 3.4%
- +3.1% versus 2019 (pre-pandemic)
- Services industry growth: 3.7% (basic prices)
- +4.0% versus 2019 (pre-pandemic)
- Goods industry growth: 3.4% (basic prices)
- +1.1% versus 2019 (pre-pandemic)
- Unemployment rate: 5.3% (an over 45-year low)
- Headline inflation: 6.8% (a 40-year high)
Canadian exports and imports reached record highs – two-way goods and services trade reached nearly $1.9 trillion in 2022. Canada is also back on track to meet its export diversification targets.
- Record trade: Led by energy products, Canadian goods and services exports increased by 21.2% in 2022. Meanwhile, goods and services imports expanded by 20.5%.
- With the elimination of Canada's COVID-19-related restrictions in 2022, services exports and imports surpassed their 2019 levels, while goods exports and imports had already done so the year before.
- Trade with Russia collapses: In response to the war in Ukraine, Canada implemented sanctions on trade with Russia, resulting in a significant annual drop in merchandise exports (-67.2%) to and imports (-64.5%) from that country in 2022.
- Investment slows: Canada's two-way international investment flows declined in 2022. Trade and transportation drove the contraction in investment abroad while a decline in other industries, manufacturing, and energy and mining led the investment contraction in Canada.
- Nevertheless, international investment inflows and outflows remain above their pre-pandemic historical average (2010–2019).
- 2023 slowdown: The challenges that emerged in 2022 are expected to slow global growth in 2023; Canadian trade and investment are likely to follow suit.
Text version
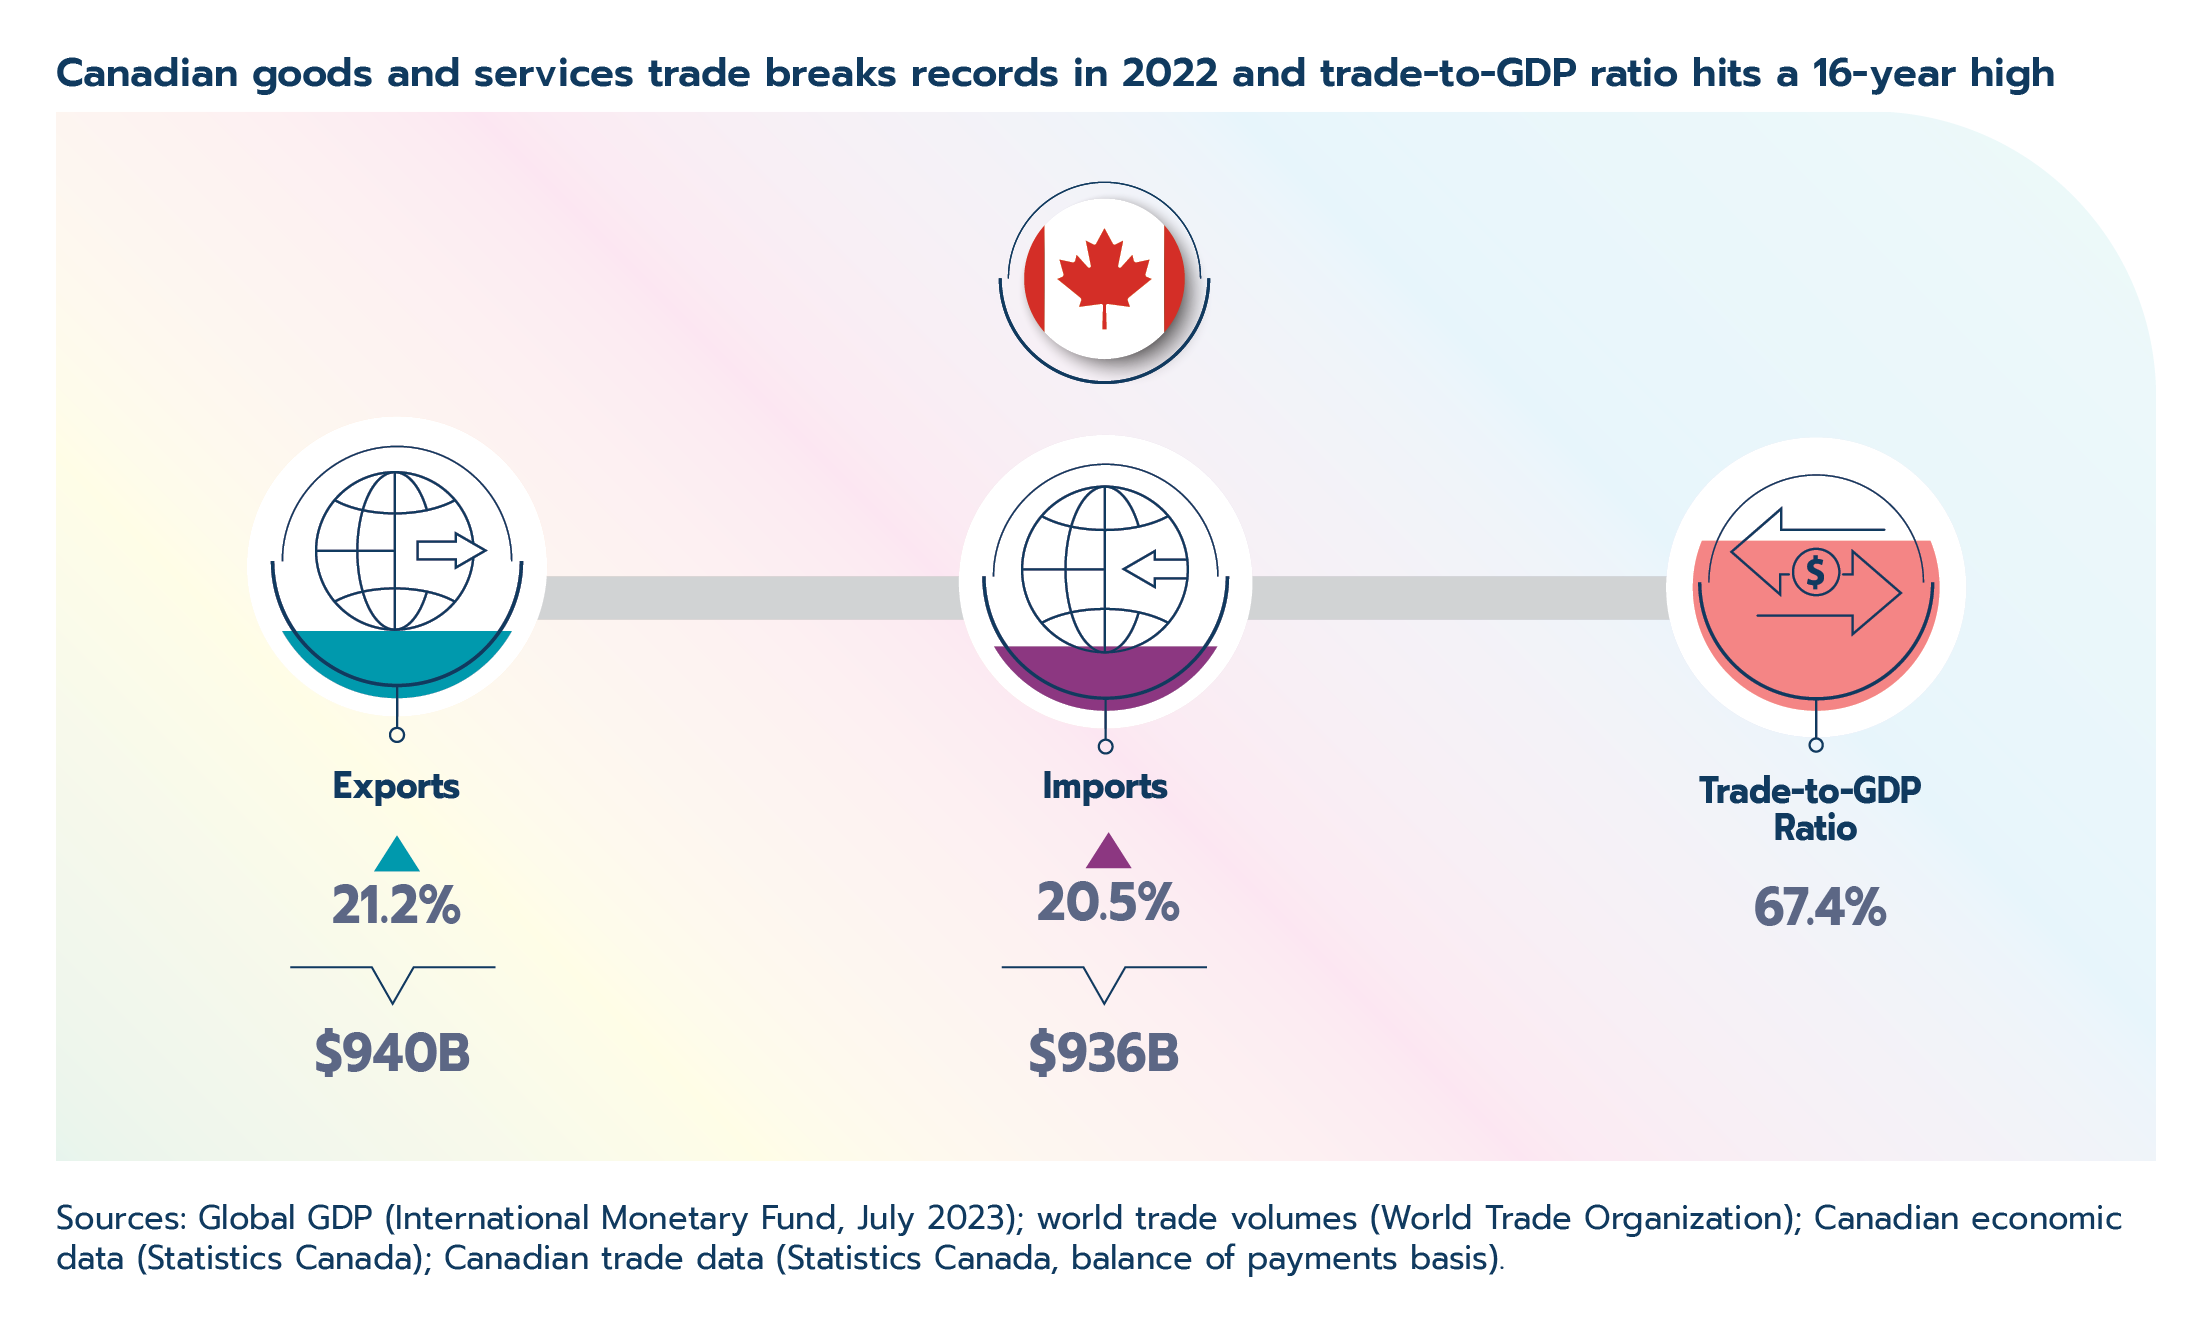
Canadian goods and services trade breaks records in 2022 and trade-to-GDP ratio reached a 16-year high
- Exports: $940 billion (+21.2%)
- Imports: $936 billion (+20.5%)
- Trade-to-GDP ratio: 67.4%
1.1 Introduction
During the course of 2022, most countries lifted the last of the public health measures implemented to stop the spread of COVID-19. This helped spur growth in sectors hit hardest by the pandemic, as did the easing of supply chain challenges. At the same time, however, goods and services prices soared in 2022, and Russia’s invasion of Ukraine in February 2022 dishearteningly marked the start of the biggest armed conflict in Europe since World War 2. The war has already had incalculable costs and continues to wage on. In brief, two simultaneous stories marked 2022: one of continued economic recovery and the other of rising macroeconomic and geopolitical challenges.
While the year began on an optimistic note of strong economic growth, it ended with widespread expectations of recessions in advanced economies and forecasts of slowing global growth. In Part 1 of the State of Trade 2023 report, we look back at the events that unfolded in the global and Canadian economies in 2022, focusing on trends in trade and investment.
1.2 Global context
Several positive developments supported global growth in 2022. An increasing number of vaccine doses were administered throughout the year, helping to save lives and increase confidence in the safety of in-person activities. Most countries also removed or relaxed their COVID-19-related restrictions that inhibited in-person services and travel throughout the prior two years, igniting a recovery in several industries. Moreover, supply chain issues that peaked at the end of 2021, including the semiconductor shortage, eased during 2022, which supported growth in industries like vehicle manufacturing.
Unfortunately, factors inhibiting global growth outweighed those supporting it in 2022. Just a few short months into the year, Russia invaded Ukraine, devastating the lives of millions of people and weighing on global economic activity. In addition, the COVID-19 Omicron variant constrained growth in advanced and emerging markets at the start of the year. In China, ongoing lockdowns muted economic growth all year. Possibly the most important factor, advanced and emerging markets alike experienced decades-high inflation in 2022. Compared to the International Monetary Fund’s estimate of average inflation in the decade before the pandemic (2010‒2019), inflation in advanced economies and emerging markets and developing economies was nearly five times and two times higher, respectively, in 2022. In response to record inflation, central banks around the world began tightening monetary policy at a rapid rate.
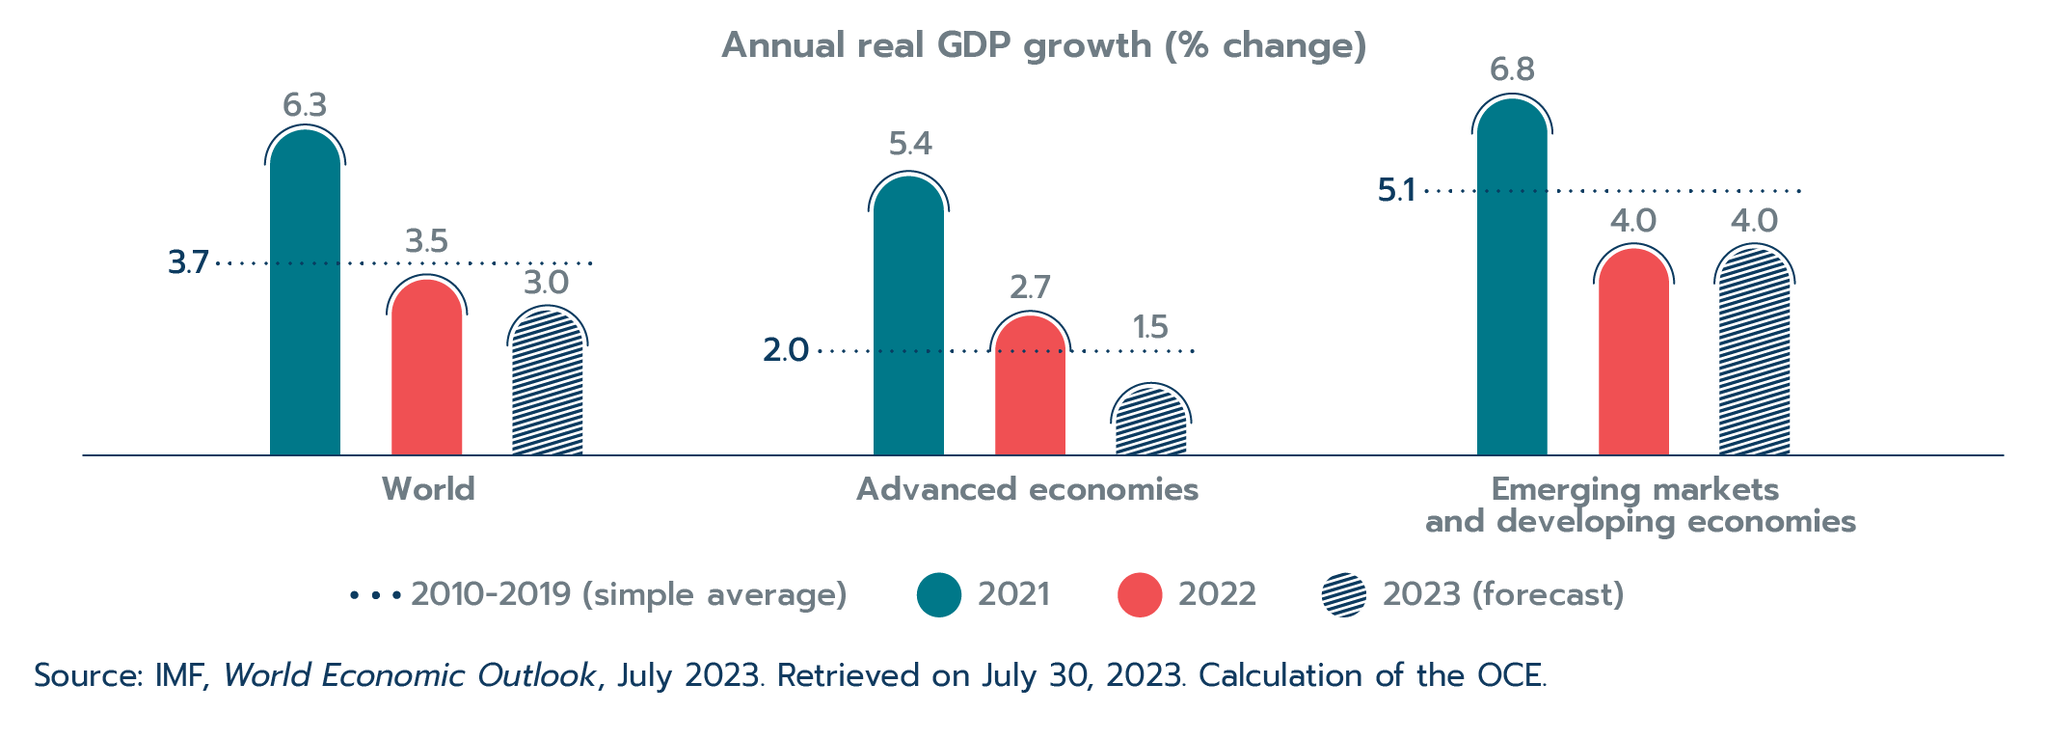
Overall, the global economy grew by 3.5% in 2022, slightly below the IMF’s estimated 3.7% average annual growth between 2010 and 2019 and significantly lower than the 4.4% growth forecasted in their January 2022 report. Advanced economies and emerging markets contributed to the slowdown. Advanced economies expanded by 2.7% in 2022 compared to 5.4% in 2021, while emerging markets advanced 4.0% in 2022 compared to 6.8% in 2021 (Figure 1.1).
Figure 1.1: Economic growth slowed in advanced economies and emerging markets
Text version
Annual real GDP growth (% change)
| Average 2010‒2019 | 2021 | 2022 | 2023 (forecast) | |
|---|---|---|---|---|
| World | 3.7 | 6.3 | 3.5 | 3.0 |
| Advanced economies | 2.0 | 5.4 | 2.7 | 1.5 |
| Emerging markets and developing economies | 5.1 | 6.8 | 4.0 | 4.0 |
Source: IMF, World Economic Outlook, July 2023. Retrieved on July 30, 2023. Calculation of the OCE.
In advanced economies, growth in the Euro area (3.5%) surprised on the upside, posting a slightly faster-than-average growth rate in 2022. Despite the challenges brought on by the war in Ukraine, private consumption and fixed capital investment powered ahead, albeit with some loss of momentum in the region during the second half of the year as high energy prices and the fallout from the war took their toll. The United States slowed sharply in 2022 compared to 2021, growing by only 2.1%, as inflation and tightened financial conditions outweighed the positive impacts of robust labour markets and strong consumer spending. Inflation, contracting investment, and weak exports plagued Japanese economic growth, which slowed to 1.0% in 2022.
In emerging markets, continued lockdowns linked to COVID-19 through much of the year and challenges in its property market dragged down growth in China. The year 2022 marked the first time in more than 40 years that China’s economy expanded at a slower rate than the global average. Tight global financial conditions and the increasing cost of goods and services, particularly for energy and food, pulled down growth in other emerging markets and developing economies overall. Energy price strength supported decades-high economic growth in energy exporters such as Kuwait and Saudi Arabia, while slowing growth in net energy import markets, such as India and Mexico.
Global trade and investment
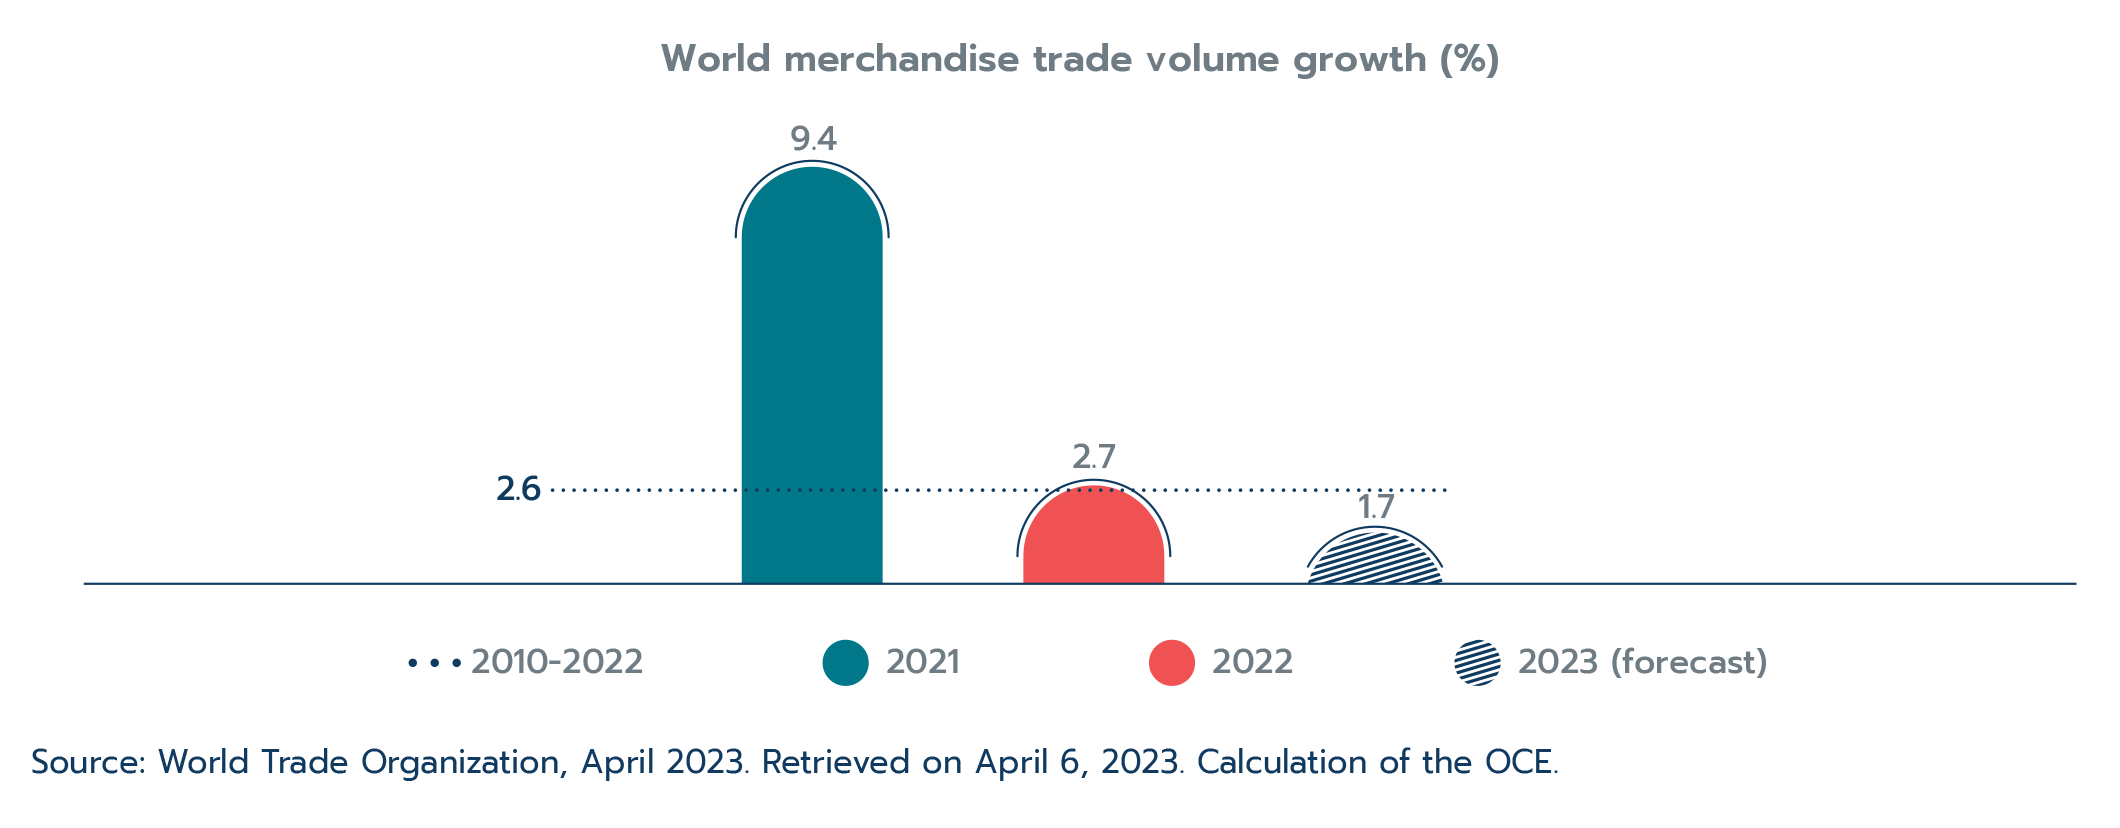
Global trade proved resilient in the face of 2022’s challenges. World merchandise trade volumes increased by 2.7% overall in 2022 (Figure 1.2), which is roughly in line with the World Trade Organization’s (WTO) estimate of trade growth between 2010 and 2022, and is close to their April 2022 forecast. Stronger than expected spending in many advanced economies, the easing of supply chain issues, and the success of countries in finding alternative suppliers for goods impacted by the war (e.g., gas, cereals, wheat) all helped to avoid a faster deceleration of trade in 2022 (WTO, 2023). Trade volume growth was significantly slower in the final quarter of the year as the impacts of the war in Ukraine, high commodity prices, continued COVID-19 outbreaks, and tightening monetary policy acted in concert.
Figure 1.2: World trade volumes grow steadily despite macroeconomic and geopolitical challenges
Text version
World merchandise trade volume growth (%)
| Average 2010‒2022 | 2021 | 2022 | 2023 (forecast) | |
|---|---|---|---|---|
| Merchandise trade volume growth | 2.6 | 9.4 | 2.7 | 1.7 |
Source: World Trade Organization, April 2023. Retrieved on April 6, 2023. Calculation of the OCE.
Like global trade, global investment appears to have held up overall in 2022 but showed signs of struggle in the second half of the year. Preliminary data from the United Nations Conference on Trade and Development (UNCTAD) shows that greenfield investment was up marginally at the end of the year while cross-border mergers and acquisitions (M&A) contracted slightly. Amidst rising interest rates and financial market uncertainty, M&A sales worldwide decreased by roughly 6.0%; especially notable was the decrease of over 50% in U.S. M&A sales. Furthermore, many Western multinationals announced departures or suspension of activities in Russia in response to its invasion of Ukraine.Footnote 1 On the upside, several mega-projects were announced in the renewables industry (in response to increasing climate concerns) and in the semiconductors industry (reflecting the reconfiguration of supply chains) (UNCTAD, 2023).
Looking ahead
The world emerged from 2022 with added sources of uncertainty that will continue to plague the outlook for 2023. The IMF expects global economic growth to slow to 3.0% in 2023, following the 3.5% growth posted in 2022 (Figure 1.1). The challenges that emerged in 2022, including tightening financial conditions and the war in Ukraine, will continue to drag down growth and could potentially worsen. Moreover, if the instability in financial markets observed at the beginning of 2023 spreads further, it could worsen the already challenging global macroeconomic environment.
The IMF forecasts a more severe slowdown in advanced economies, with growth reduced by almost half to 1.5% in 2023, the lowest rate of growth since 2013, excluding the contraction caused by the initial shock of the COVID-19 pandemic in 2020. Growth in the Euro area will fall to 0.9% in 2023 from 3.5% in 2022 as the war in Ukraine continues and higher interest rates take hold. Notably, a full recession is expected in Germany (-0.3%), which remains vulnerable to energy price volatility and will be negatively impacted by weak foreign demand. Inflation and high interest rates are expected to trigger a slowdown in U.S. economic growth (1.8%) and the United Kingdom (0.4%).
Growth in emerging markets will stay at 4.0% in 2023. After lifting its zero-COVID policy in December 2022, China's reopening will support growth in emerging markets. Economies in emerging Europe are also expected to support growth. Meanwhile, slowdowns in Latin America, the Middle East, and Sub-Saharan Africa, will pull down growth. Debt vulnerabilities continue to cloud the outlook for over half of low-income developing economies and about a quarter of emerging market economies (IMF, 2023).
With global growth decelerating, the WTO forecasts global trade growth will slow to 1.7% in 2023, markedly lower than the 3.9% annual average rate seen between 2010 and 2019. Additionally, UNCTAD predicts that FDI is likely to weaken in 2023, mirroring global economic and trade growth.
1.3 Canadian economic performance
The year 2022 was marked by another strong performance for the Canadian economy, which advanced by 3.4% following the 5.0% growth posted in 2021. Despite robust headline growth, the economy contracted by the end of 2022 as the Bank of Canada raised interest rates to contain accelerating inflation.
Despite the negative impacts brought on by the spread of Omicron and associated containment measures, the Canadian economy grew by 2.6% (seasonally adjusted at annual rates) in the first quarter of 2022. Another two quarters of robust expansion followed, with the economy increasing by 3.6% and 2.3% in the second and third quarters, respectively.
Strong labour and housing markets and government stimulus from the pandemic that continued into 2022 supported growth in consumption during the first three quarters of the year. However, the Canadian economy stalled by the fourth quarter of 2022, contracting by 0.1% as interest-rate-sensitive sectors began to falter. A significant contraction in inventories and business investment in housing and machinery and equipment outweighed positive contributions from consumption and net exports in the fourth quarter.
Throughout the year, inflation continued to accelerate, driven by robust consumer demand and elevated commodity prices following Russia's invasion of Ukraine in February of 2022. Halfway through the year, Canada's headline inflation reached a 40-year high on an average annual basis. Goods and services inflation were too high, averaging 8.7% and 5.0% in 2022, respectively.
Correspondingly, the Bank of Canada tightened monetary policy. The policy interest rate increased by 4 percentage points during the year, ending 2022 at a 15-year high of 4.25%. On a more positive note, supply-chain pressures significantly decreased in 2022, nearing their pre-pandemic norms, which provided some relief for goods price growth.
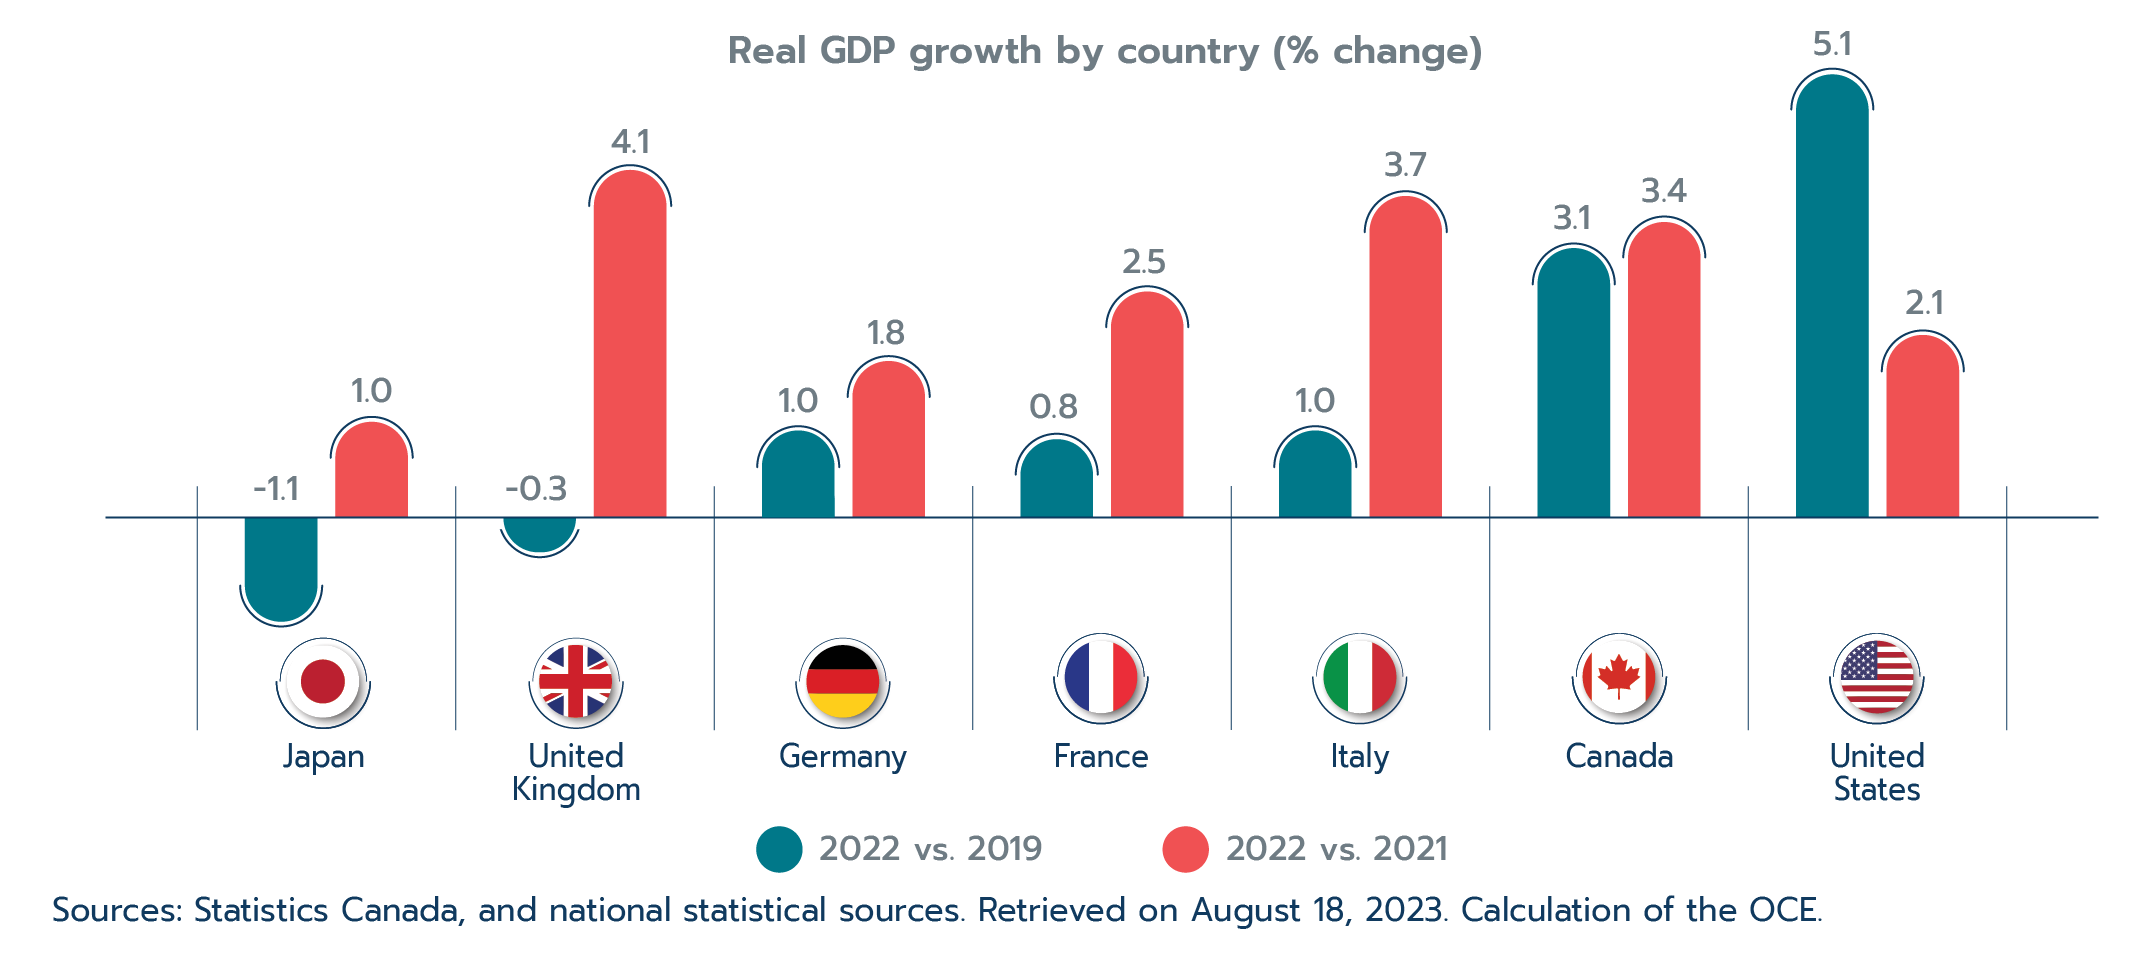
Canada was not alone in this experience, with most major economies seeing record inflation and increasing interest rates throughout the year. Nonetheless, two consecutive years of solid growth pushed the Canadian economy beyond its pre-pandemic size – Canada’s real GDP was 3.1% greater in 2022 compared to 2019, reaching $2.2 trillion. This is the second-strongest performance among G7 nations, behind only the United States. (Figure 1.3).
Figure 1.3: Canada posts second-strongest recovery among G7 countries
Text version
Real GDP growth by country (% change)
| 2022 vs. 2019 | 2022 vs. 2021 | |
|---|---|---|
| Japan | -1.1% | 1.0% |
| United Kingdom | -0.3% | 4.1% |
| Germany | 1.0% | 1.8% |
| France | 0.8% | 2.5% |
| Italy | 1.0% | 3.7% |
| Canada | 3.1% | 3.4% |
| United States | 5.1% | 2.1% |
Sources: Statistics Canada, and national statistical sources. Retrieved on August 18, 2023. Calculation of the OCE.
Industry performance
Economic growth was widespread in 2022 – with every major industry advancing, except for management of companies and enterprises.
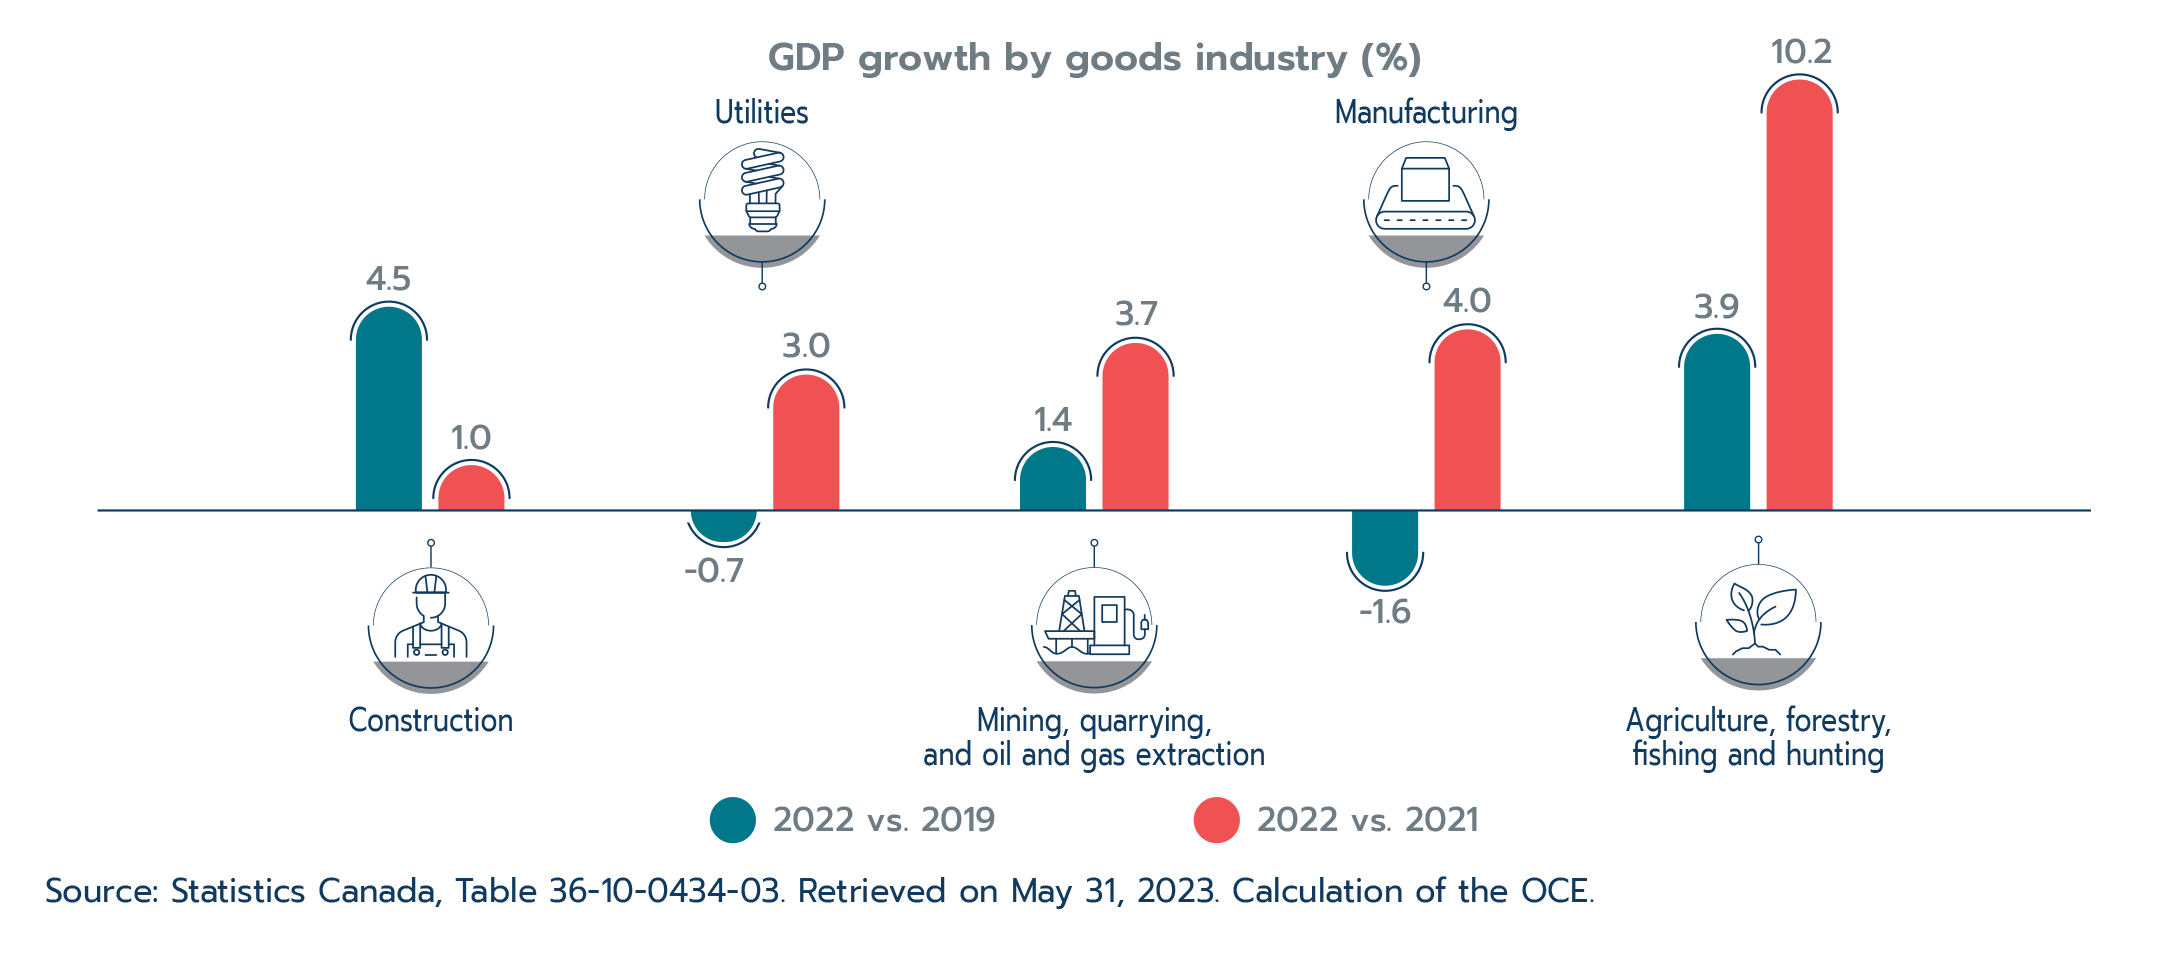
Goods industries advanced by 3.4% in 2022 compared to 2021, led by growth in manufacturing of 4.0%. Supply-chain challenges brought on by the pandemic and semi-conductor shortages moderated in 2022, helping to start a recovery in motor vehicle and parts manufacturing. Despite another year of growth, manufacturing remains below its pre-pandemic level (Figure 1.4).
Favourable weather throughout the year boosted crop production and led to significant growth in agriculture, forestry, fishing, and hunting, helping Canada contribute to filling the gap in global food supplies caused by Russia’s invasion. Mining, quarrying, and oil and gas extraction also posted significant growth in 2022, driven in part by the increase in prices and demand caused by the war in Ukraine. Agriculture, forestry, fishing and hunting, and mining, oil and gas each surpassed their pre-pandemic levels.
Figure 1.4: All goods sectors expanded in 2022, but manufacturing and utilities have yet to recover to their pre-pandemic levels
Text version
GDP growth by goods industry (% change for the economic recovery, 2022 compared to 2019, and % change for 2022 compared to 2021)
| 2022 vs. 2019 | 2022 vs. 2021 | |
|---|---|---|
| Construction | 4.5% | 1.0% |
| Utilities | -0.7% | 3.0% |
| Mining, quarrying, and oil and gas extraction | 1.4% | 3.7% |
| Manufacturing | -1.6% | 4.0% |
| Agriculture, forestry, fishing and hunting | 3.9% | 10.2% |
Source: Statistics Canada, Table 36-10-0434-03. Retrieved on May 31, 2023. Calculation of the OCE.
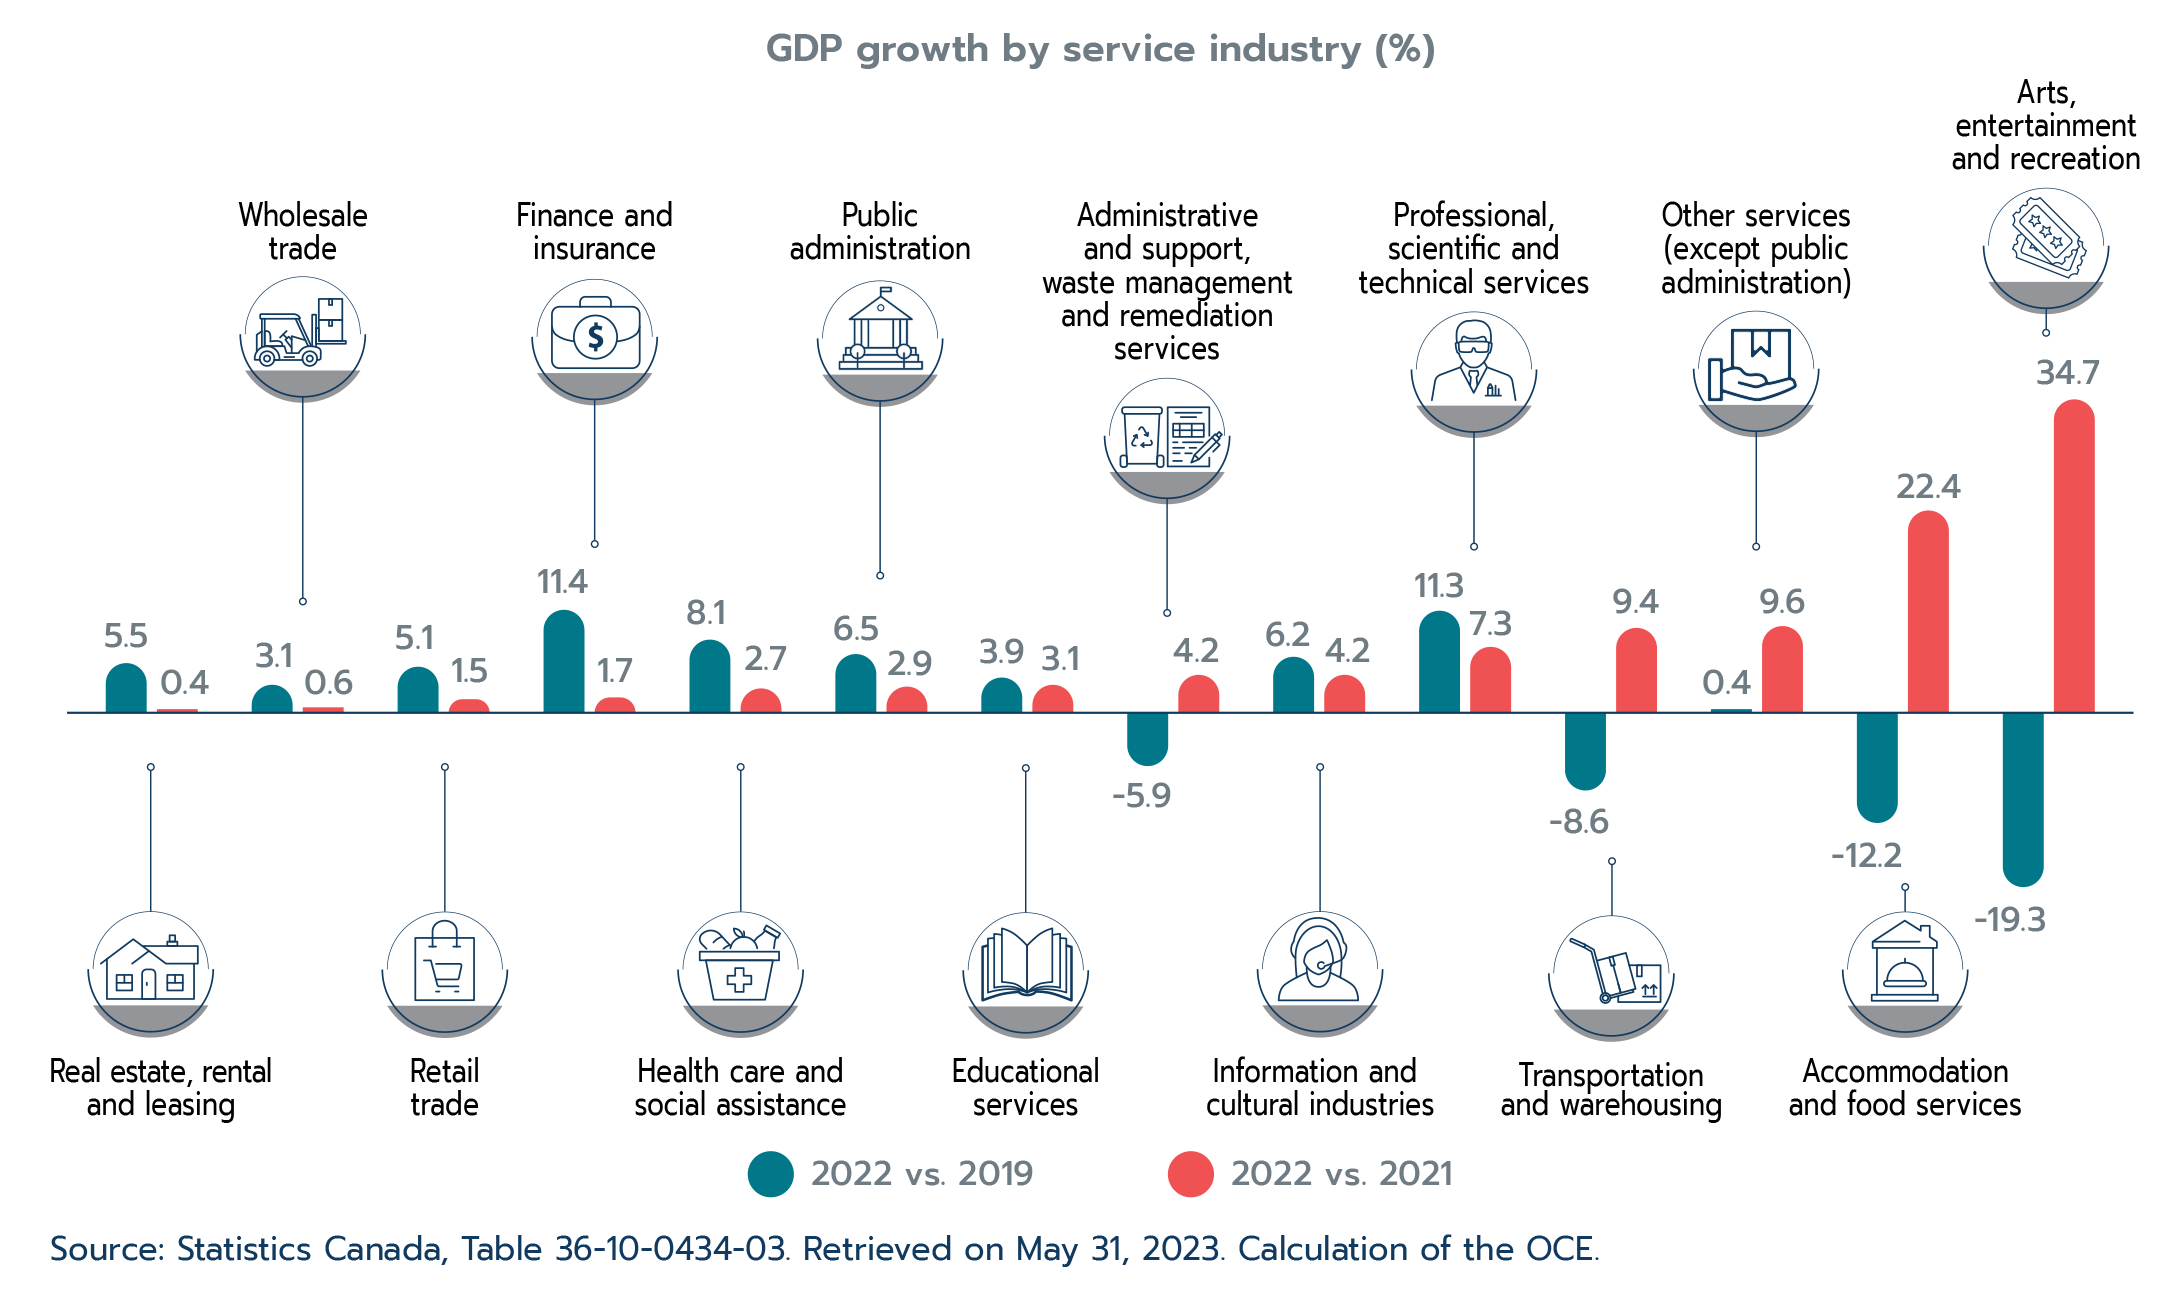
Services industries outperformed goods industries, expanding by 3.7% in 2022. Professional and technical services contributed the most to services industries growth. Meanwhile, public-facing industries hit hardest by the COVID-19 pandemic continued their recovery. Transportation and warehousing expanded by 9.4%, supported by air travel, which benefited from the removal of nearly all COVID-19-related restrictions. Accommodation and food services increased by 22.4% and was the third largest contributor to overall services industries growth in 2022. Despite these solid performances, accommodation and food services, transportation and warehousing, and arts, entertainment and recreation have yet to recover from the effects of the global pandemic (Figure 1.5).
Figure 1.5: Services industries continue their recovery, but several have not reached their pre-pandemic levels
Text version
GDP growth by services industry (% change for the economic recovery, 2022 compared to 2019, and % change for 2022 compared to 2021)
| 2022 vs. 2019 | 2022 vs. 2021 | |
|---|---|---|
| Arts, entertainment and recreation | -19.3% | 34.7% |
| Accommodation and food services | -12.2% | 22.4% |
| Other services (except public administration) | 0.4% | 9.6% |
| Transportation and warehousing | -8.6% | 9.4% |
| Professional, scientific and technical services | 11.3% | 7.3% |
| Information and cultural industries | 6.2% | 4.2% |
| Administrative and support, waste management and remediation services | -5.9% | 4.2% |
| Educational services | 3.9% | 3.1% |
| Public administration | 6.5% | 2.9% |
| Health care and social assistance | 8.1% | 2.7% |
| Finance and insurance | 11.4% | 1.7% |
| Retail trade | 5.1% | 1.5% |
| Wholesale trade | 3.1% | 0.6% |
| Real estate and rental and leasing | 5.5% | 0.4% |
Source: Statistics Canada, Table 36-10-0434-03. Retrieved on May 31, 2023. Calculation of the OCE.
The labour market
After an impressively fast turnaround from the initial shock of the COVID-19 pandemic, the Canadian labour market continued to sprint forward. Indeed, 2022 marked one of the strongest years for the labour market on record. Employment expanded by over 750,000 jobs in 2022. The unemployment rate reached a record low of 4.9% in June of 2022 and averaged 5.3% for the year. Moreover, Canada’s labour force participation rate (i.e., the number of working-age individuals working or looking for work) stayed healthy throughout the year. This suggests that low unemployment was not due to workers dropping out of the labour market. Finally, there was a record-setting million job vacancies (i.e., unmet demand for labour) across the country in May of 2022. While job vacancies came down from this peak, they remained historically high through 2022.
This record strength supported consumer spending and economic activity throughout the year. However, even with this degree of labour market tightness, there were some signs that interest rate increases started to take hold in 2022. In the second half of the year, employment gains slowed, and interest-rate-sensitive sectors saw weaker employment growth. The expectation is for the labour market to cool in 2023 as the effects of higher interest rates fully materialize.
Box 1.1: Women make quick U-turn after initial pandemic-driven job loss
After hitting record unemployment in the wake of the COVID-19 pandemic, the Canadian labour market recovered to the point of record tightness in 2022. Women were a big part of this recovery. The initial shock of the COVID-19 pandemic affected female workers to a much larger extent than their male counterparts.Footnote 1 Several factors drove the contraction in female employment, including the fact that women were disproportionately employed in sectors impacted by COVID-19-related restrictions on in-person services and because of childcare challenges that arose during the pandemic.
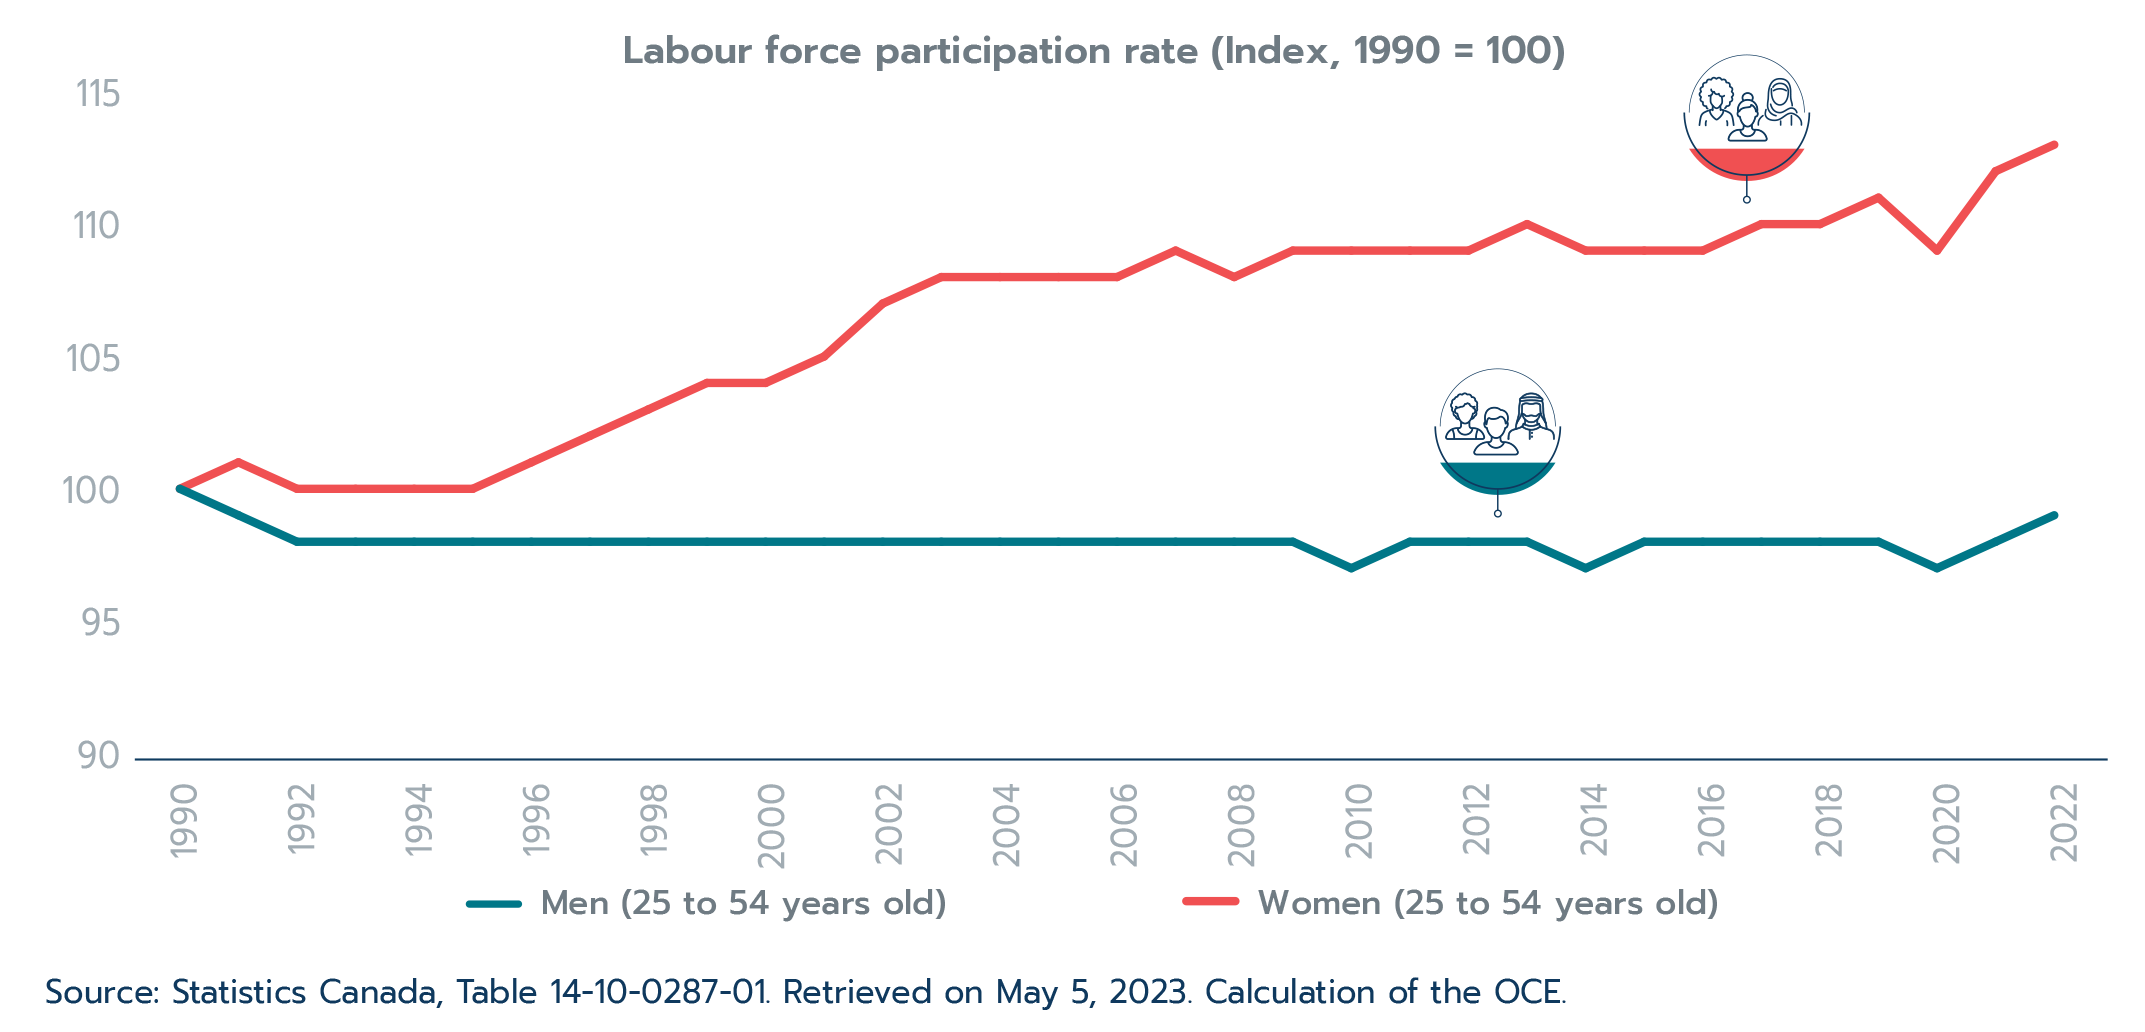
However, women were keen to get back to work. Female labour force participation rebounded at a faster rate than for men – the labour force participation rate of core-working-age women (i.e., women 25 to 54 years old) reached a record high of 85.1% in 2022 (Figure 1.6). Several factors could have driven the strong return of women to the job market. For example, the participation rate of women with young children increased substantially in 2022 compared to 2019, which may have been incentivized by additional childcare supports or greater flexibility of work arrangements. Footnote 2
Figure 1.6: Core-working-age women are participating in the labour market at a historic rate
Text version
Core-working-age women are participating in the labour market at a historic rate
Labour force participation rate (Index, 1990 = 100)
| Year | Men (25 to 54 years old) | Women (25 to 54 years old) |
|---|---|---|
| 1990 | 100 | 100 |
| 1991 | 99 | 101 |
| 1992 | 98 | 100 |
| 1993 | 98 | 100 |
| 1994 | 98 | 100 |
| 1995 | 98 | 100 |
| 1996 | 98 | 101 |
| 1997 | 98 | 102 |
| 1998 | 98 | 103 |
| 1999 | 98 | 104 |
| 2000 | 98 | 104 |
| 2001 | 98 | 105 |
| 2002 | 98 | 107 |
| 2003 | 98 | 108 |
| 2004 | 98 | 108 |
| 2005 | 98 | 108 |
| 2006 | 98 | 108 |
| 2007 | 98 | 109 |
| 2008 | 98 | 108 |
| 2009 | 98 | 109 |
| 2010 | 97 | 109 |
| 2011 | 98 | 109 |
| 2012 | 98 | 109 |
| 2013 | 98 | 110 |
| 2014 | 97 | 109 |
| 2015 | 98 | 109 |
| 2016 | 98 | 109 |
| 2017 | 98 | 110 |
| 2018 | 98 | 110 |
| 2019 | 98 | 111 |
| 2020 | 97 | 109 |
| 2021 | 98 | 112 |
| 2022 | 99 | 113 |
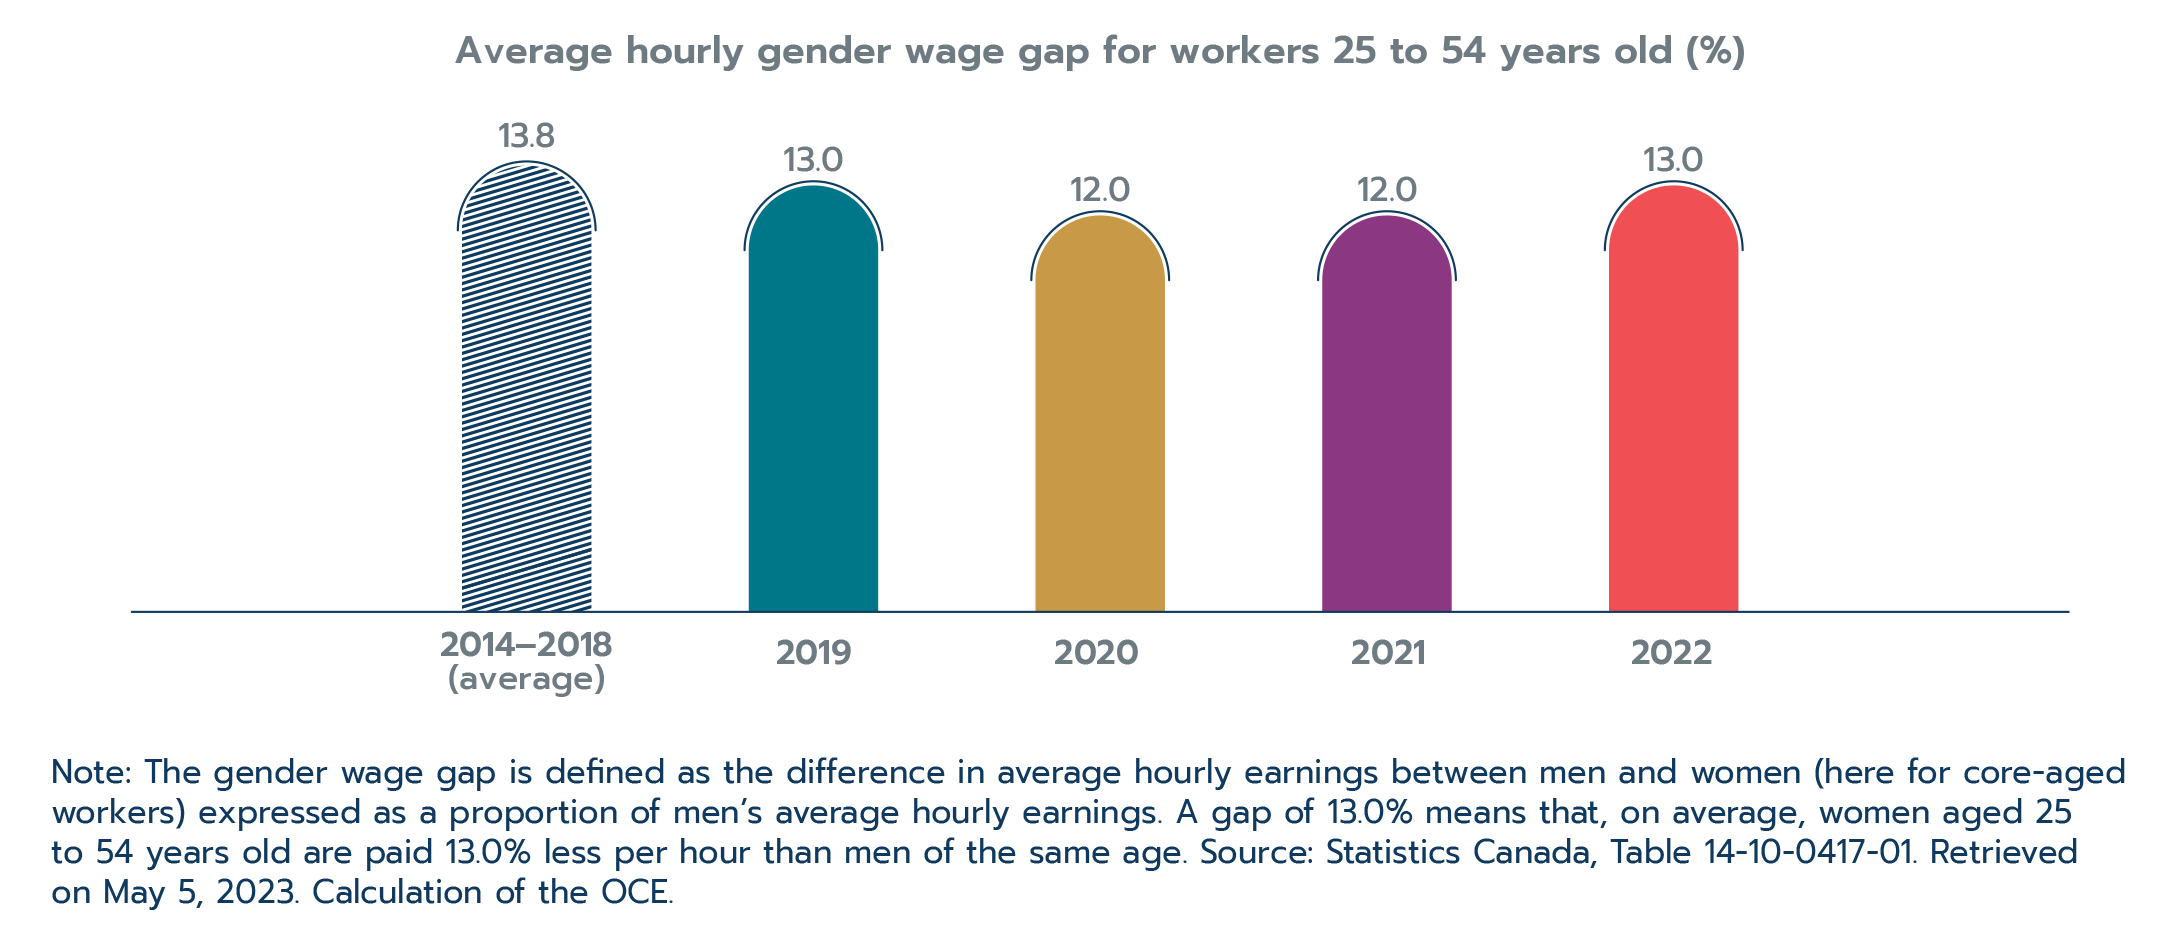
In addition, women shifted to higher-paying jobs as they returned to work. They moved from high-contact jobs, such as those in hospitality, to low-contact jobs, such as those in finance and professional services, which also tend to offer higher wages.Footnote 3 While this shift contributed to an estimated $9-billion advance in women’s wage income, men saw an even greater wage improvement, and the gender wage gap did not narrow over this period (Figure 1.7).Footnote 3 Unfortunately, one explanation of this earnings gap could be that fewer women are in senior management positions.Footnote 3
In sum, women made positive gains during the past several years, but several gender imbalances in the labour market persist.
Figure 1.7: The gender wage gap has not improved compared to 2019 despite changes in female labour market participation and occupational shifts
Text version
The gender wage gap has not improved compared to 2019 despite changes in female labour market participation and occupational shifts
| Year | Average hourly gender wage gap for workers 25 to 54 years old (%) |
|---|---|
| 2014–2018 | 13.8 |
| 2019 | 13.0 |
| 2020 | 12.0 |
| 2021 | 12.0 |
| 2022 | 13.0 |
Note: The gender wage gap is defined as the difference in average hourly earnings between men and women (here for core-aged workers) expressed as a proportion of men’s average hourly earnings. A gap of 13.0% means that, on average, women aged 25 to 54 years old are paid 13.0% less per hour than men of the same age. Source: Statistics Canada, Table 14-10-0417-01. Retrieved on May 5, 2023. Calculation of the OCE.
1.4 Highlights of Canada’s trade performance
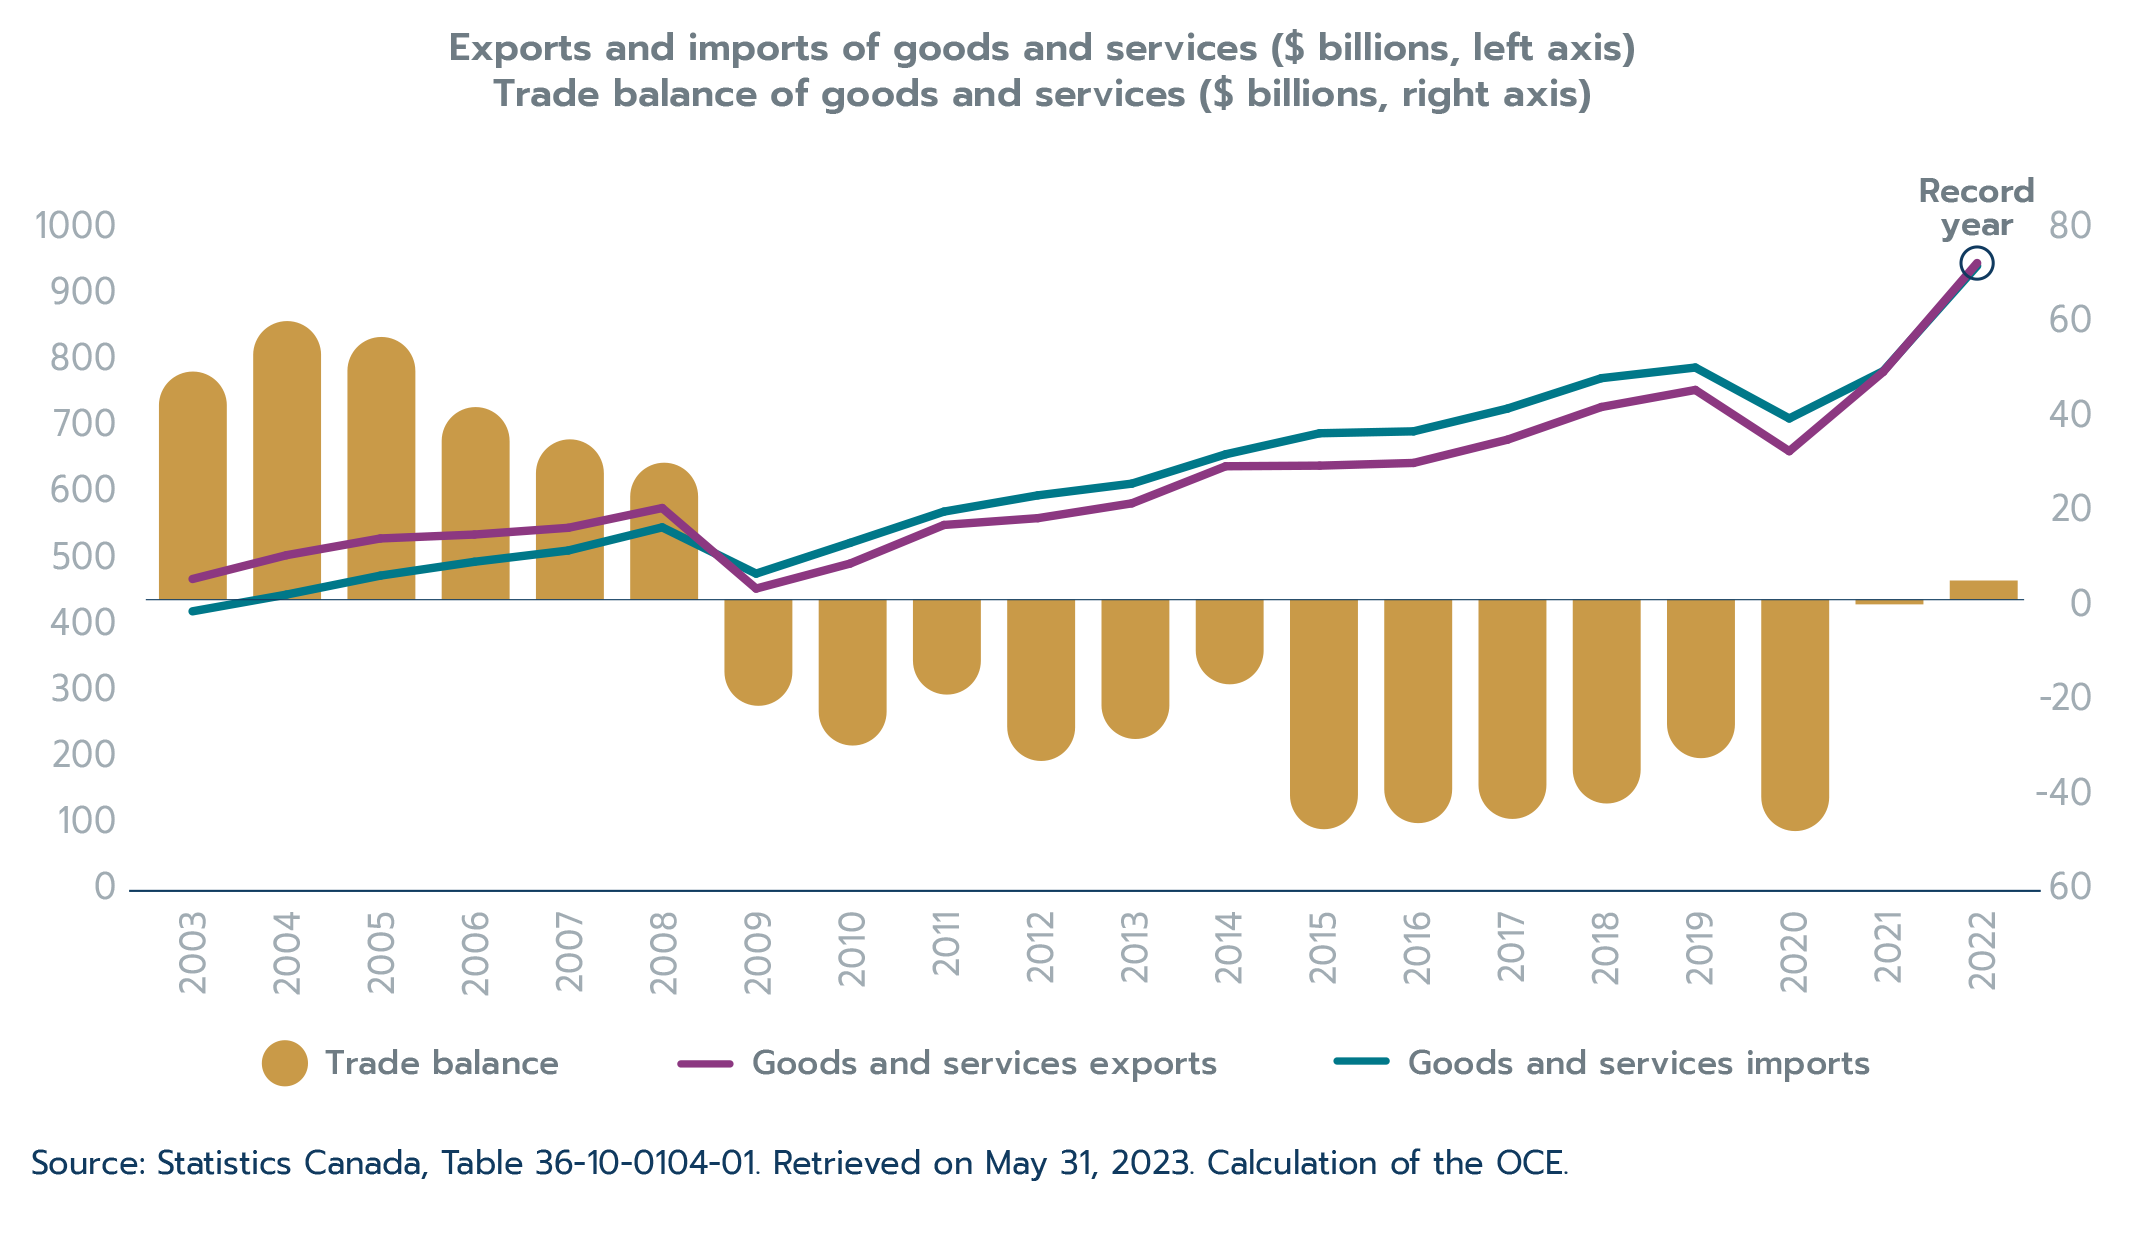
Canada’s international trade posted new records again in 2022. Increasing by 21.2% during the year, goods and services exports reached a record $940.4 billion (Figure 1.8). Goods and services imports also marked new highs, advancing by 20.5% to $936.2 billion in 2022. With exports progressing faster than imports, Canada posted a goods and services trade surplus amounting to $4.1 billion in 2022. Moreover, Canada’s trade-to-GDP ratio was 67.4% in 2022 – the highest level in sixteen years.
Strength in goods prices, particularly for resource exports, and a recovery in services exports and imports drove growth in Canada’s international trade during 2022. This section describes the year’s trends in goods and services trade on a balance-of-payments basis. See the Office of the Chief Economist (2023b) for a review of Canada’s goods trade in 2022 on a customs basis.
Figure 1.8: Canada’s goods and services trade reached new records in 2022
Text version
Canada’s goods and services trade reached new records in 2022
$ Billions (current dollars)
| Goods and services exports | Goods and services imports | Goods and services trade balance | |
|---|---|---|---|
| 2003 | 462.6 | 413.7 | 48.8 |
| 2004 | 498.6 | 439.0 | 59.6 |
| 2005 | 523.9 | 467.7 | 56.2 |
| 2006 | 529.8 | 488.6 | 41.2 |
| 2007 | 540.0 | 505.7 | 34.3 |
| 2008 | 569.9 | 540.7 | 29.3 |
| 2009 | 448.1 | 470.7 | -22.7 |
| 2010 | 485.9 | 517.2 | -31.2 |
| 2011 | 544.3 | 564.5 | -20.3 |
| 2012 | 554.6 | 589.1 | -34.5 |
| 2013 | 577.0 | 606.8 | -29.8 |
| 2014 | 633.1 | 651.2 | -18.1 |
| 2015 | 634.0 | 683.0 | -49.1 |
| 2016 | 638.1 | 685.9 | -47.8 |
| 2017 | 673.3 | 720.3 | -46.9 |
| 2018 | 722.7 | 766.3 | -43.6 |
| 2019 | 748.5 | 782.4 | -33.9 |
| 2020 | 655.9 | 705.4 | -49.5 |
| 2021 | 775.8 | 776.9 | -1.0 |
| 2022 | 940.4 | 936.2 | 4.1 |
Source: Statistics Canada, Table 36-10-0104-01. Retrieved on May 31, 2023. Calculation of the OCE.
Goods trade
Goods exports growth dominated by resource products
Resource exports dominated growth in Canadian goods exports in 2022. Canada’s goods exports increased by 22.4% that year and resource exports accounted for over three-quarters of this growth. Resource exports (28.9%) advanced more than twice as fast as non-resource exports (12.8%) despite both categories of goods showing strength in 2022. Commodity price increases (see Box 1.3), driven by Russia’s invasion of Ukraine, and favourable weather that resulted in high crop yields supported Canada’s resource export growth.
Canada’s goods exports increased by $142.8 billion in 2022. Exports increased across all 11 major goods product categories, with growth fastest in energy (57.0%), metal ores and non-metallic minerals (28.1%), and industrial machinery and equipment (19.1%) (Table 1.1). The war in Ukraine particularly affected oil prices as fears over Europe’s energy supplies mounted. The price of a barrel of crude oil peaked at roughly US$122.7 in June 2022-estimated using the Europe Brent spot price. For the full year, a barrel of crude averaged US$100.9, compared to US$70.9 in 2021. The price of Western Canada Select obtained by many Canadian oil producers followed a similar trend. Energy products alone accounted for over half of Canada’s goods export growth in 2022. Finally, despite recording slower-than-average growth, consumer goods, motor vehicles and parts, and metal and non-metallic mineral products, all posted substantial gains in export values in 2022.
Box 1.2: Goods prices drive export growth for the second consecutive year
Canada’s goods exports reached record levels in 2021 and again in 2022. However, elevated prices drove these records. In 2022, the value of goods exports advanced by roughly 22.5%, with prices increasing by 19.1% and quantities (volumes) gaining 2.7%. Goods export volumes are still modestly below their 2019 pre-pandemic levels, while prices have substantially increased (Figure 1.9).Footnote 1 Footnote 2
In 2022, prices advanced across most major export product categories, with energy product prices increasing notably faster. Export prices for farm and fishing products and for basic chemical products also increased substantially. Russia’s invasion of Ukraine partially drove price increases in energy and other resource product exports as fears around their supply mounted (see Box 1.3). However, record levels of inflation globally also contributed to the widespread increase in Canada’s goods export prices. Export prices were higher in 2022 compared to 2019 across all major goods categories. Meanwhile, export volumes in 2022 were higher in only 3 of 11 product categories compared to their pre-pandemic levels; volumes were higher for energy products, metal ores and non-metallic minerals, forestry products, and consumer goods.
Driven by the product mix of exports to Canada’s trading partners, the role of price and quantity growth differs for each of Canada’s export destinations. For example, prices accounted for the majority of the increase in the value of goods exported to the United States in 2022, but volumes increased too. Meanwhile, export price increases accounted for the entire gain in the value of Canada’s goods exports to China, as goods export quantities decreased significantly.
Figure 1.9: Contributions to Canadian goods export growthFootnote 2

Text version
Contributions to Canadian goods export growth
Ln change from 2019
| Date | Value | Prices | Quantities |
|---|---|---|---|
| 2019-01-01 | -0.036 | -0.030 | -0.006 |
| 2019-02-01 | -0.029 | 0.004 | -0.033 |
| 2019-03-01 | 0.013 | 0.024 | -0.012 |
| 2019-04-01 | 0.023 | 0.030 | -0.008 |
| 2019-05-01 | 0.054 | 0.021 | 0.032 |
| 2019-06-01 | 0.004 | -0.010 | 0.014 |
| 2019-07-01 | -0.004 | -0.015 | 0.010 |
| 2019-08-01 | 0.013 | -0.009 | 0.021 |
| 2019-09-01 | 0.000 | -0.003 | 0.002 |
| 2019-10-01 | -0.013 | -0.008 | -0.006 |
| 2019-11-01 | -0.019 | -0.004 | -0.016 |
| 2019-12-01 | -0.009 | -0.011 | 0.001 |
| 2020-01-01 | -0.047 | -0.020 | -0.028 |
| 2020-02-01 | -0.037 | -0.051 | 0.014 |
| 2020-03-01 | -0.123 | -0.090 | -0.033 |
| 2020-04-01 | -0.448 | -0.187 | -0.263 |
| 2020-05-01 | -0.374 | -0.131 | -0.245 |
| 2020-06-01 | -0.190 | -0.061 | -0.128 |
| 2020-07-01 | -0.105 | -0.038 | -0.068 |
| 2020-08-01 | -0.095 | -0.025 | -0.074 |
| 2020-09-01 | -0.083 | -0.032 | -0.052 |
| 2020-10-01 | -0.068 | -0.017 | -0.052 |
| 2020-11-01 | -0.055 | -0.013 | -0.043 |
| 2020-12-01 | -0.043 | 0.002 | -0.046 |
| 2021-01-01 | 0.034 | 0.035 | 0.011 |
| 2021-02-01 | 0.012 | 0.072 | -0.052 |
| 2021-03-01 | 0.004 | 0.068 | -0.054 |
| 2021-04-01 | 0.009 | 0.094 | -0.083 |
| 2021-05-01 | -0.004 | 0.108 | -0.115 |
| 2021-06-01 | 0.071 | 0.139 | -0.076 |
| 2021-07-01 | 0.081 | 0.154 | -0.088 |
| 2021-08-01 | 0.083 | 0.144 | -0.068 |
| 2021-09-01 | 0.060 | 0.164 | -0.109 |
| 2021-10-01 | 0.128 | 0.199 | -0.075 |
| 2021-11-01 | 0.159 | 0.200 | -0.038 |
| 2021-12-01 | 0.138 | 0.174 | -0.034 |
| 2022-01-01 | 0.154 | 0.233 | -0.080 |
| 2022-02-01 | 0.207 | 0.275 | -0.070 |
| 2022-03-01 | 0.261 | 0.313 | -0.053 |
| 2022-04-01 | 0.283 | 0.332 | -0.050 |
| 2022-05-01 | 0.318 | 0.346 | -0.029 |
| 2022-06-01 | 0.333 | 0.349 | -0.017 |
| 2022-07-01 | 0.292 | 0.315 | -0.024 |
| 2022-08-01 | 0.273 | 0.306 | -0.033 |
| 2022-09-01 | 0.288 | 0.307 | -0.020 |
| 2022-10-01 | 0.290 | 0.308 | -0.019 |
| 2022-11-01 | 0.256 | 0.293 | -0.038 |
| 2022-12-01 | 0.257 | 0.285 | -0.029 |
Statistics Canada, Tables 12-10-0128-01 and 12-10-0121-01. Balance of payments basis, seasonally adjusted. Retrieved in May 2023. Calculation of the OCE.
Canada’s goods imports also reached record levels in 2022. Compared to goods exports, however, the contributions from growth in prices and in quantities were more even. In 2022, goods import prices were up 12.4% while quantities (volumes) increased by 6.6%. Canada’s goods import prices and volumes were above their pre-pandemic levels in 2022.
Box 1.3: Commodity prices following Russia’s invasion of Ukraine
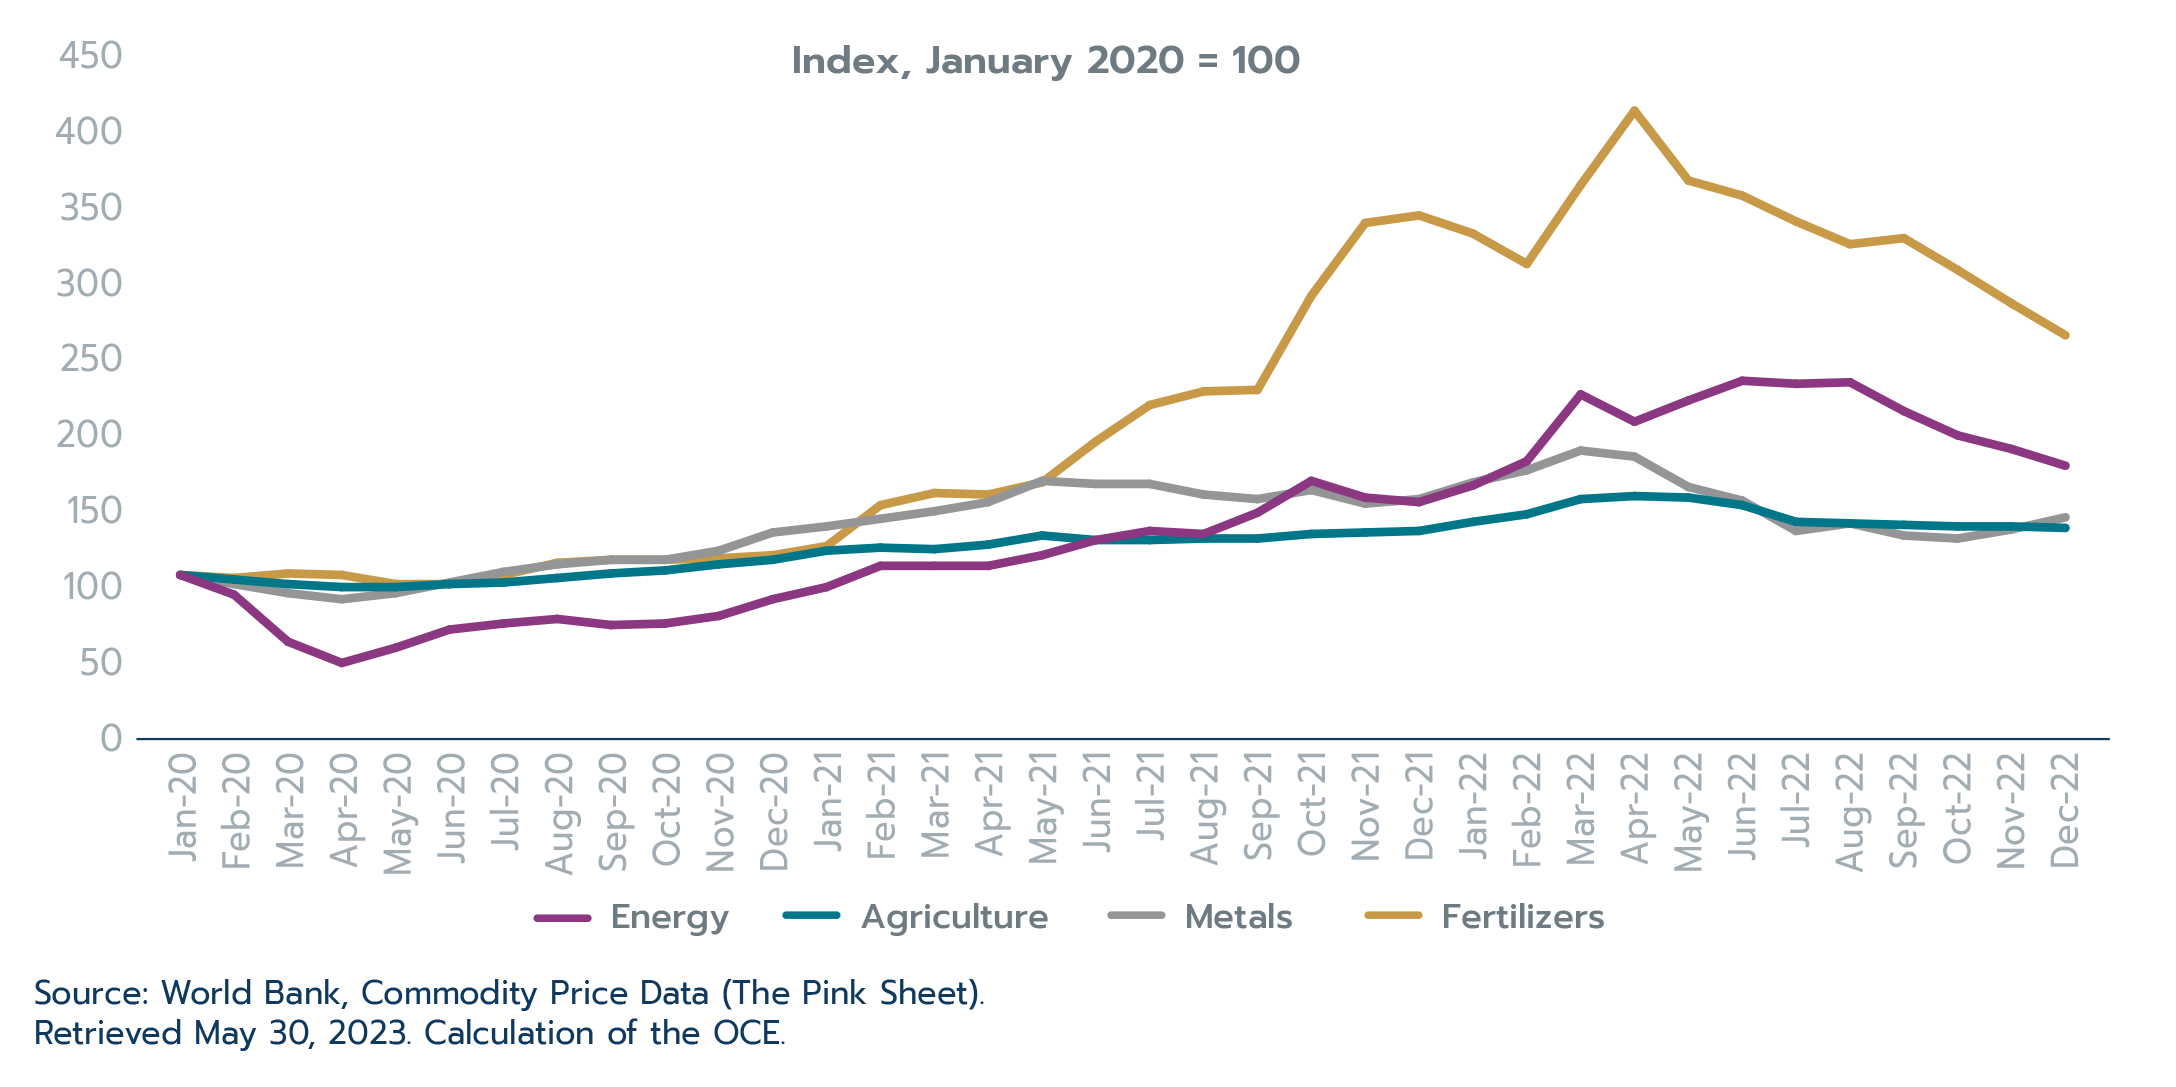
Commodity prices have an outsized impact on Canada’s trade performance as commodities account for a large share of our exports. Moreover, commodity prices are set globally and can experience fluctuations given the varied factors that influence the supply and demand for commodities. In 2022, the Russian invasion of Ukraine sent commodity prices into overdrive. Price increases were particularly strong for commodities where the two countries in conflict are large exporters, namely energy products, fertilizers, grains, and metals.Footnote 1
As a major exporter of many affected products, Canada’s monthly export values surged in 2022, especially in the first half of the year. Meanwhile, consumer countries were negatively impacted, for example emerging and developing economies that historically relied on Russia and Ukraine for food supplies. However, prices for many commodities retreated in the second half of 2022 (Figure 1.10). While overall commodity prices remain elevated by historical standards, prices for key products such as energy, metals, agricultural products and fertilizers all fell below pre-invasion levels by the end of the year.
Commodity price fluctuations also have important implications for exchange rates. Commodity exporting countries like Canada saw their currencies appreciate at the beginning of the year while those of importing countries, including Europe and Japan, witnessed exchange rate depreciations. The U.S. dollar strengthened both due to its traditional role as a safe haven in times of uncertainty, and to the fact that it was further supported as that country transitioned to an important energy supplier.
The impact of commodity prices on international trade and exchange rates highlights the interconnectedness of global markets. As a major exporter of commodities, Canada is particularly sensitive to their price fluctuations. Looking ahead, tighter markets in the aftermath of Russia’s invasion mean that commodity prices are likely to remain volatile in the near-term. Monitoring movements of commodity prices and understanding their implications for trade is crucial for navigating the challenges and opportunities of the global economic landscape.
Figure 1.10: Monthly commodity price indices, January 2020 to December 2022
Text version
Monthly commodity price indices, January 2020 to December 2022
Index, January 2020 = 100
| Energy | Agriculture | Metals | Fertilizers | |
|---|---|---|---|---|
| Jan-20 | 100 | 100 | 100 | 100 |
| Feb-20 | 87 | 97 | 94 | 98 |
| Mar-20 | 56 | 94 | 88 | 101 |
| Apr-20 | 42 | 92 | 84 | 100 |
| May-20 | 52 | 92 | 88 | 94 |
| Jun-20 | 64 | 94 | 95 | 94 |
| Jul-20 | 68 | 95 | 102 | 100 |
| Aug-20 | 71 | 98 | 107 | 108 |
| Sep-20 | 67 | 101 | 110 | 110 |
| Oct-20 | 68 | 103 | 110 | 110 |
| Nov-20 | 73 | 107 | 116 | 111 |
| Dec-20 | 84 | 110 | 128 | 113 |
| Jan-21 | 92 | 116 | 132 | 119 |
| Feb-21 | 106 | 118 | 137 | 146 |
| Mar-21 | 106 | 117 | 142 | 154 |
| Apr-21 | 106 | 120 | 148 | 153 |
| May-21 | 113 | 126 | 162 | 161 |
| Jun-21 | 123 | 123 | 160 | 188 |
| Jul-21 | 129 | 123 | 160 | 212 |
| Aug-21 | 127 | 124 | 153 | 221 |
| Sep-21 | 141 | 124 | 150 | 222 |
| Oct-21 | 162 | 127 | 156 | 284 |
| Nov-21 | 151 | 128 | 147 | 332 |
| Dec-21 | 148 | 129 | 150 | 337 |
| Jan-22 | 159 | 135 | 161 | 325 |
| Feb-22 | 175 | 140 | 169 | 305 |
| Mar-22 | 219 | 150 | 182 | 357 |
| Apr-22 | 201 | 152 | 178 | 406 |
| May-22 | 215 | 151 | 158 | 360 |
| Jun-22 | 228 | 146 | 149 | 350 |
| Jul-22 | 226 | 135 | 129 | 333 |
| Aug-22 | 227 | 134 | 134 | 318 |
| Sep-22 | 208 | 133 | 126 | 322 |
| Oct-22 | 192 | 132 | 124 | 301 |
| Nov-22 | 183 | 132 | 130 | 279 |
| Dec-22 | 172 | 131 | 138 | 258 |
Source: World Bank, Commodity Price Data (The Pink Sheet). Retrieved May 30, 2023. Calculation of the OCE.
On the imports side, resources played a less dominant role. Resources account for only about a third of Canada’s goods imports; as such, despite growing faster than non-resource imports (17.7%), resource imports (25.2%) accounted for just over 40% of Canada’s goods import expansion in 2022. Imports growth was much more widespread, with all 11 major product categories rising, and imports of 6 of 11 major product categories gaining over $10 billion each. Overall, goods imports expanded by $125.6 billion. Consumer goods, motor vehicles and parts, and energy products were the largest contributors to the increase in goods imports in 2022. The waning of supply chain issues and the global semiconductor shortage that began in 2021 supported the 20.7% growth in motor vehicles and parts imports.
Table 1.1: Value of Canada’s goods trade by product sector
| 2022 ($ billions) | 2022 vs. 2021 ($ change, billions) | 2022 vs. 2021 (% change) | |
|---|---|---|---|
| Goods exports | |||
| Total | 779.2 | 142.8 | 22.4 |
| Farm, fishing and intermediate food products | 54.5 | 6.9 | 14.6 |
| Energy products | 211.8 | 76.9 | 57.0 |
| Metal ores and non-metallic minerals | 32.9 | 7.2 | 28.1 |
| Metal and non-metallic mineral products | 85.6 | 9.0 | 11.7 |
| Basic and industrial chemical, plastic and rubber products | 44.6 | 5.7 | 14.7 |
| Forestry products, and building and packaging materials | 58.7 | 3.8 | 7.0 |
| Industrial machinery, equipment and parts | 45.2 | 7.2 | 19.1 |
| Electronic and electrical equipment and parts | 31.8 | 4.8 | 17.8 |
| Motor vehicles and parts | 81.0 | 9.0 | 12.5 |
| Aircraft and other transportation equipment and parts | 24.6 | 0.4 | 1.9 |
| Consumer goods | 88.6 | 9.4 | 11.8 |
| Goods imports | |||
| Total | 757.3 | 125.6 | 19.9 |
| Farm, fishing and intermediate food products | 27.9 | 4.1 | 17.4 |
| Energy products | 51.5 | 19.3 | 60.2 |
| Metal ores and non-metallic minerals | 19.3 | 3.9 | 25.2 |
| Metal and non-metallic mineral products | 64.1 | 5.4 | 9.1 |
| Basic and industrial chemical, plastic and rubber products | 67.1 | 15.3 | 29.5 |
| Forestry products, and building and packaging materials | 35.7 | 5.4 | 18.0 |
| Industrial machinery, equipment and parts | 84.6 | 15.8 | 22.9 |
| Electronic and electrical equipment and parts | 84.6 | 10.4 | 14.1 |
| Motor vehicles and parts | 114.8 | 19.7 | 20.7 |
| Aircraft and other transportation equipment and parts | 23.8 | 3.9 | 19.7 |
| Consumer goods | 156.3 | 19.9 | 14.6 |
Source: Statistics Canada, Table 12-10-0122-01. Retrieved on May 31, 2023. Calculation of the OCE.
U.S. economic strength drives growth in Canadian goods exports, while exports to trading partners in non-China Asia and Europe also expand
Total goods exports to Canada’s partners increased by approximately $142.8 billion in 2022, supported by a $118.5 billion increase in exports to the United States (Table 1.2). Growth in goods exports to that country (24.9%) outpaced overall export growth (22.4%). Outside the United States, Japan (+$3.6 billion), India (+$2.4 billion), and South Korea (+$2.4 billion) were the largest contributors to goods export growth. While Brazil falls outside Canada’s top 10 export markets, exports to that country grew rapidly in 2022, expanding by 76.8% as prices for fertilizers and energy rose. Meanwhile, periodic lockdowns linked to the COVID-19 pandemic and weakness in its property market resulted in significantly below-average growth for Canadian exports to China (2.2%), which is Canada’s second-largest goods export market.
The United States also led growth in Canadian goods imports, albeit to a lesser extent than exports. Canada’s goods imports from all countries increased by $125.6 billion in 2022. Imports from all countries (19.9%) and from the United States (20.0%) expanded at a similar pace. After the United States, China (+$12.5 billion, led by large gains in electrical machinery and equipment, and industrial machinery) was the largest contributor to goods import growth, followed by our CUSMA partner, Mexico (+$4.6 billion, predominantly vehicles and vehicle parts, and electrical machinery and equipment). Growth in imports from both countries was marginally faster than growth in imports overall. Growth in imports from the EU (20.9%), South Korea (25.9%), and India (41.1%) also outpaced average import growth and contributed substantially to Canada’s new goods imports record.
Table 1.2: Canada’s goods trade with top 10 trading partners
| 2022 ($ billions) | 2022 vs. 2021 ($ change, billions) | 2022 vs. 2021 (% change) | |
|---|---|---|---|
| Goods exports | |||
| Total, all countries | 779.2 | 142.8 | 22.4 |
| United States | 595.1 | 118.5 | 24.9 |
| China | 29.2 | 0.6 | 2.2 |
| United Kingdom | 19.9 | 1.7 | 9.3 |
| Japan | 18.2 | 3.6 | 24.3 |
| Mexico | 9.9 | 1.0 | 11.4 |
| South Korea | 8.8 | 2.4 | 36.9 |
| Germany | 7.6 | 0.6 | 8.3 |
| Netherlands | 6.6 | 1.7 | 35.1 |
| India | 5.4 | 2.4 | 78.8 |
| Belgium | 4.9 | 1.0 | 24.1 |
| All other countries | 73.6 | 9.4 | 14.7 |
| Goods imports | |||
| Total, all countries | 757.3 | 125.6 | 19.9 |
| United States | 471.4 | 78.5 | 20.0 |
| China | 69.6 | 12.5 | 21.8 |
| Mexico | 24.1 | 4.6 | 23.4 |
| Germany | 18.7 | 3.0 | 18.8 |
| Japan | 12.0 | 0.8 | 6.9 |
| South Korea | 10.9 | 2.2 | 25.9 |
| United Kingdom | 9.9 | -0.1 | -1.1 |
| Italy | 8.9 | 1.4 | 19.3 |
| Switzerland | 7.8 | 0.5 | 6.7 |
| Brazil | 7.5 | 0.8 | 11.7 |
| All other countries | 116.6 | 21.6 | 22.7 |
Source: Statistics Canada, Table 36-10-0023-01. Retrieved on May 30, 2023. Calculation of the OCE.
Box 1.4: Canadian goods and services exports back on the path needed to achieve overseas diversification target
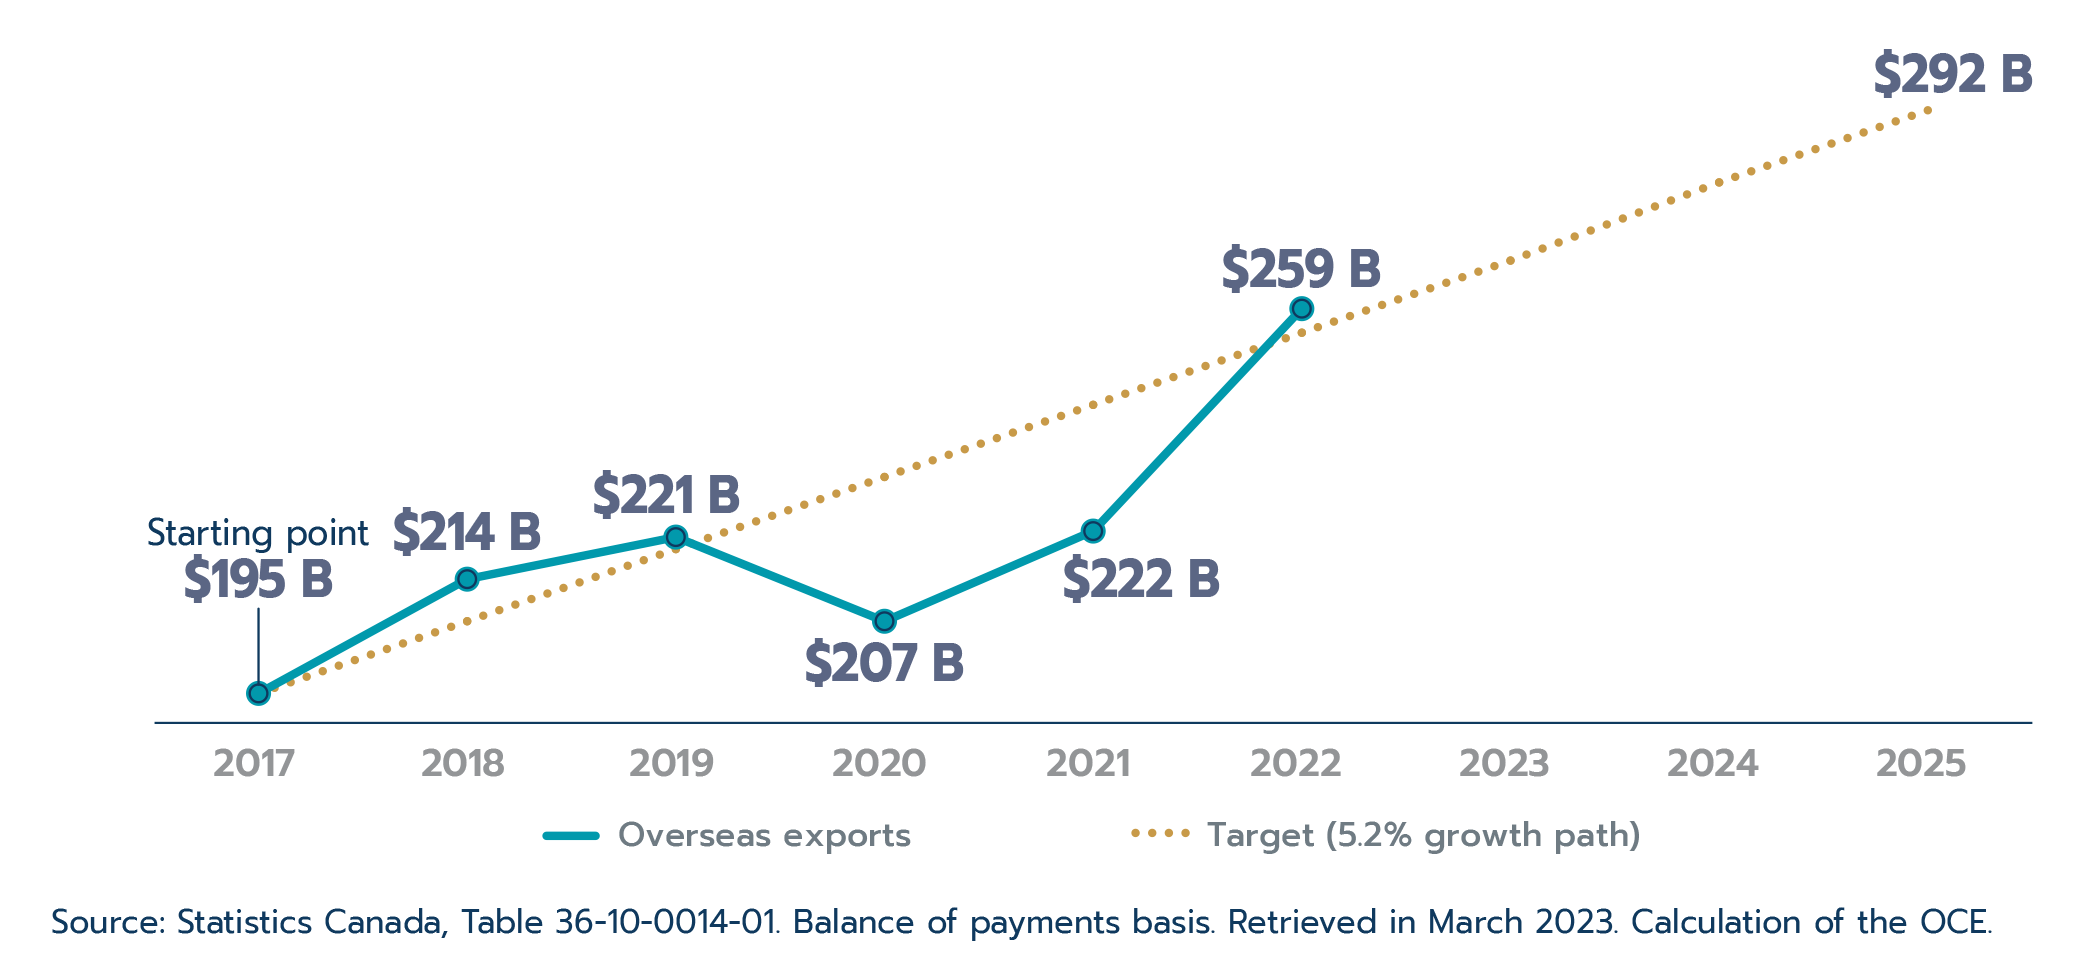
The Fall 2018 Economic StatementFootnote 1 set a target of increasing by 50% Canada’s overseas exports by 2025. This target requires that Canadian exports to overseas markets reach $291.8 billion by 2025. If constant growth were to take place, it implies that overseas exports growth would be 5.2% every year, starting in 2017.
After the significant disruption to trade caused by the global pandemic, Canadian overseas exports jumped 16.8% to reach $258.7 billion in 2022. This has not only returned Canadian trade to the path needed to achieve the stated target, but exceeded it (Figure 1.11). As a result, this suggests that Canadian exports to overseas markets would only need to grow by 4.1% annually on average from 2022 on to reach the target in 2025, in the absence of another negative global shock to international trade.
For additional details on the diversification target and Canada’s 2022 performance, see the Office of the Chief Economist’s Growing Canada’s exports to overseas markets by 50% – 2022 Update.
Figure 1.11: Canadian overseas exports rebounded strongly in 2022, getting back on track to reach the growth target
Text version
Contributions to Canadian goods export growth
$ billions
| Overseas exports | Target (5.2% growth path) | |
| 2017 | 195 | 195 |
| 2018 | 214 | 207 |
| 2019 | 221 | 219 |
| 2020 | 207 | 231 |
| 2021 | 222 | 243 |
| 2022 | 259 | 255 |
| 2023 | 267 | |
| 2024 | 280 | |
| 2025 | 292 |
Source: Statistics Canada, Table 36-10-0014-01. Balance of payments basis. Retrieved on May 30, 2023. Calculation of the OCE.
Box 1.5: Canadian merchandise trade with Russia in 2022
Sanctions related to Russia were imposed under the Special Economic Measures Act in order to respond to the gravity of Russia’s violation of the sovereignty and territorial integrity of Ukraine, and grave human rights violations that have been committed in Russia. On March 17, 2014, the Special Economic Measures (Russia) Regulations (“the Regulations”) came into force.
In 2022, the Regulations were amended several times to impose new asset freezes and dealing prohibitions on designated persons listed in Schedule 1, which include both individuals and entities. Furthermore, the 2022 amendments created new prohibitions on exports and imports of certain productsFootnote 1 to and from Russia as a consequence of Russia’s invasion of Ukraine. The prohibited export products include luxury goods, materials used in the production of weapons, advanced goods and technologies, and others. The prohibited import products include petroleum products, luxury goods, gold products, and others. In general, the sanction on these products aimed to limit Russia’s production and ability to raise funds for its war efforts. The majority of these export and import prohibitions were enacted between March and July 2022.
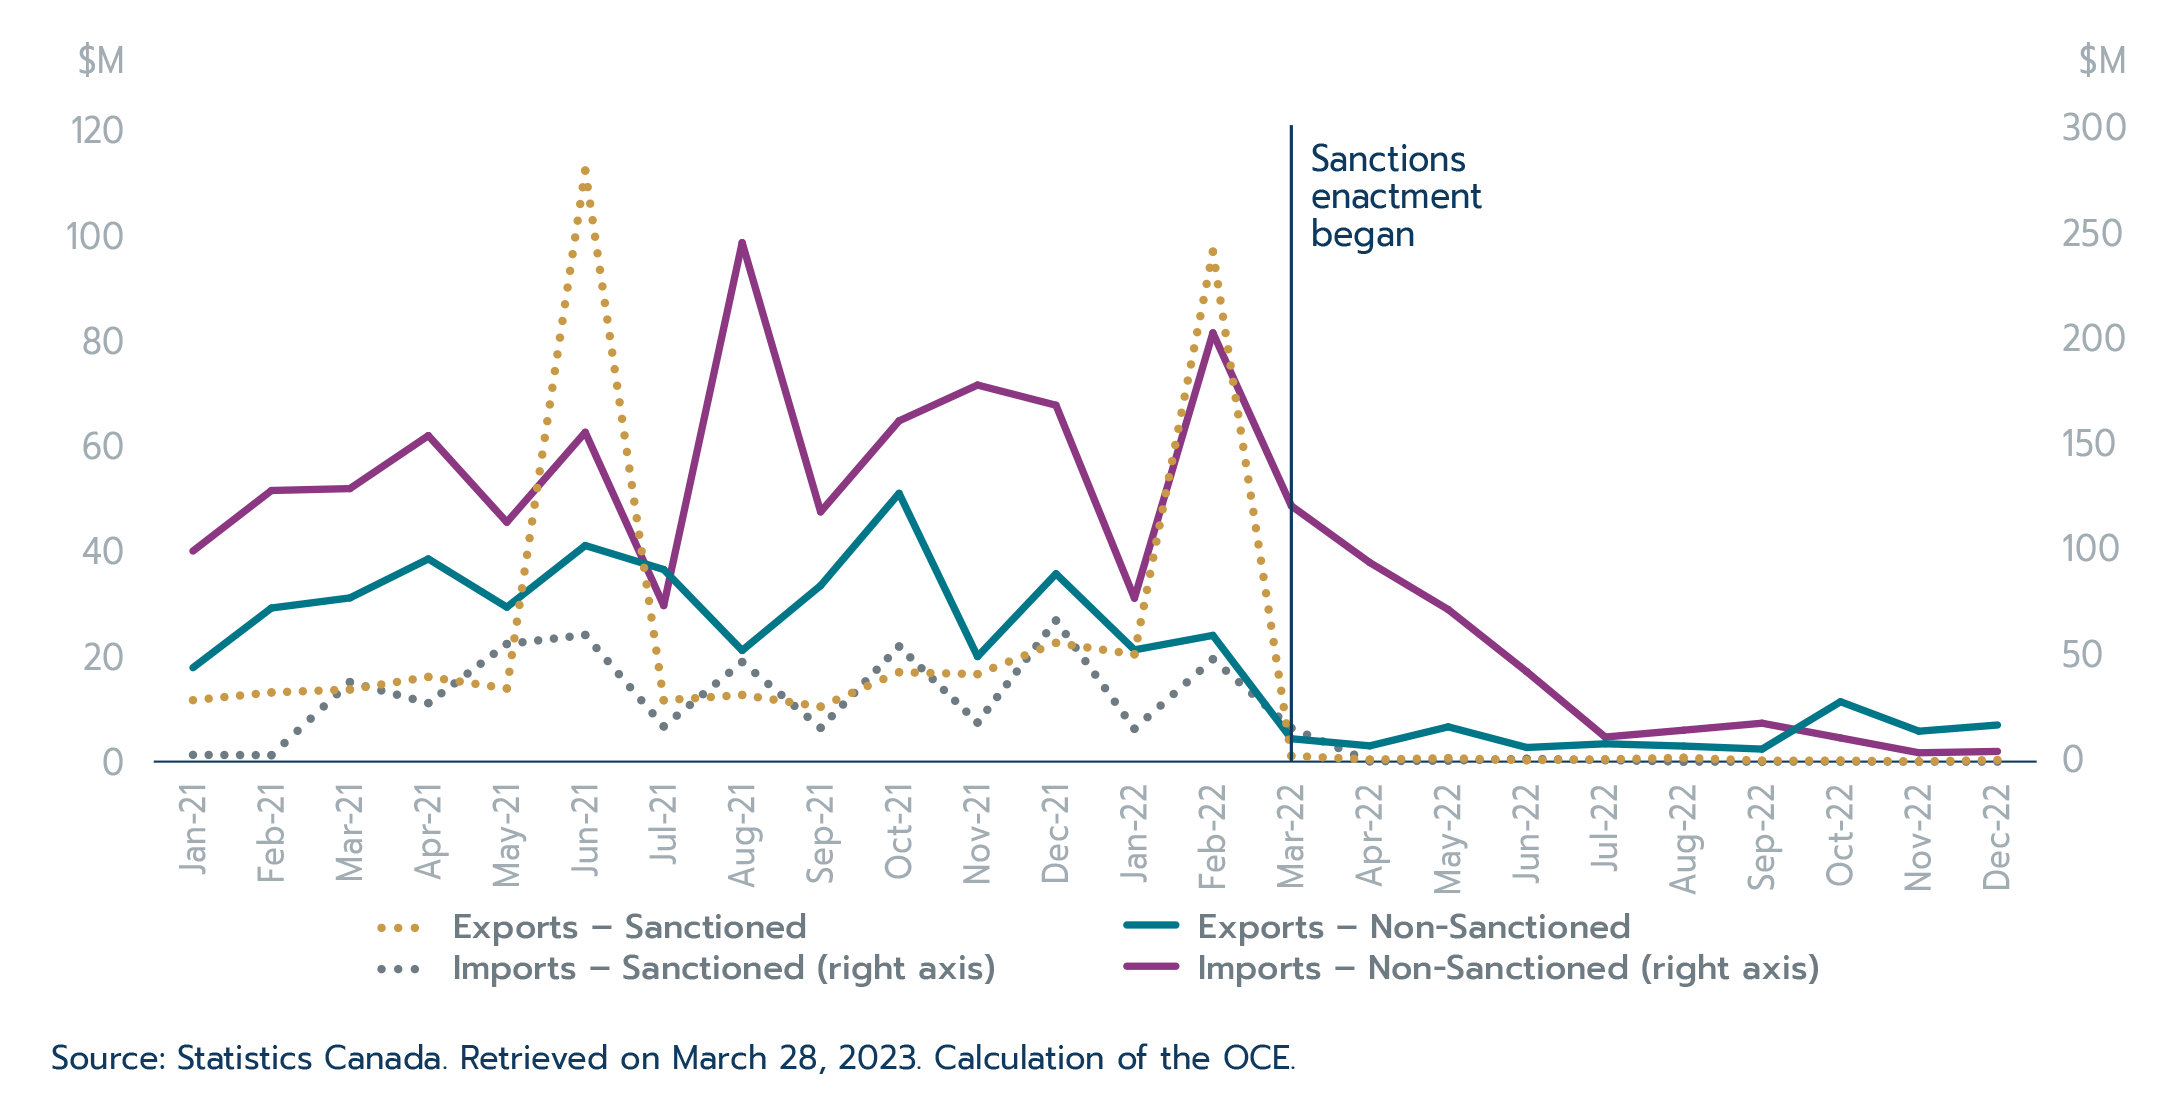
Canadian total merchandise trade with Russia in 2022 reflects the impact of these measures (Figure 1.12). It declined 65.1% in 2022, with exports decreasing 67.2% and imports down 64.5%. Trade for both sanctioned and non-sanctioned products fell significantly. Exports of sanctioned products declined 55.7% in 2022, and were close to zero in the later part of the year. Prior to the sanctions, exports of sanctioned products saw two significant spikes in June 2021 and February 2022; both were the result of higher sales of airplanes and other aircrafts (Harmonized System code 880230 and 880240), a product group that often display spikes in trade value due to the high-value nature of these products and the infrequency of sales. Even though there are still some exports of non-sanctioned products such as vaccines for human medicines and eggs of birds, these too dropped significantly in 2022.
On the import side, sanctioned products declined 79.7% in 2022 as the value of Canada’s imports of these products from Russia essentially fell close to zero in the second half of the year. The slower decline of imports may be due to importers needing to find alternative suppliers or to the lag between the time the orders were made (possibly before February 2022) and the time when the products were shipped and received. Imports of non-sanctioned products were down 60.9% in 2022, but there were still some imports occurring in the latter part of 2022.
Figure 1.12: Canadian merchandise trade with Russia
Text version
Canadian merchandise trade with Russia ($)
| Exports - Sanctioned | Exports - Non Sanctioned | Imports - Sanctioned | Imports - Non-Sanctioned | |
|---|---|---|---|---|
| Jan 2021 | 11,683,791 | 17,860,615 | 3,237,187 | 100,064,080 |
| Feb 2021 | 13,155,912 | 29,198,418 | 3,082,905 | 128,812,765 |
| Mar 2021 | 13,712,626 | 31,117,665 | 37,799,476 | 129,713,216 |
| Apr 2021 | 16,104,360 | 38,519,194 | 27,826,807 | 154,866,478 |
| May 2021 | 13,911,728 | 29,357,684 | 55,880,867 | 113,751,726 |
| Jun 2021 | 112,310,124 | 41,071,834 | 60,182,903 | 156,455,908 |
| Jul 2021 | 11,669,249 | 36,510,684 | 16,764,439 | 74,144,578 |
| Aug 2021 | 12,678,348 | 21,131,469 | 47,310,133 | 246,538,826 |
| Sep 2021 | 10,455,380 | 33,456,493 | 16,087,696 | 118,658,314 |
| Oct 2021 | 17,001,171 | 50,985,269 | 54,705,746 | 161,890,673 |
| Nov 2021 | 16,633,497 | 19,976,640 | 18,591,389 | 178,902,326 |
| Dec 2021 | 22,567,703 | 35,703,953 | 67,046,359 | 169,314,024 |
| Jan 2022 | 20,400,371 | 21,244,695 | 15,639,132 | 77,653,937 |
| Feb 2022 | 96,899,105 | 23,997,181 | 48,665,920 | 203,682,136 |
| Mar 2022 | 1,104,016 | 4,356,268 | 15,953,843 | 121,505,857 |
| Apr 2022 | 393,856 | 3,006,924 | 178,002 | 94,571,703 |
| May 2022 | 675,594 | 6,618,696 | 488,485 | 72,249,927 |
| Jun 2022 | 268,424 | 2,696,619 | 1,368,240 | 42,747,865 |
| Jul 2022 | 446,803 | 3,396,700 | 731,253 | 11,704,631 |
| Aug 2022 | 74,943 | 2,965,971 | 8 | 14,952,074 |
| Sep 2022 | 18,750 | 2,392,305 | 0 | 18,272,643 |
| Oct 2022 | 21,637 | 11,391,861 | 57,526 | 11,269,390 |
| Nov 2022 | 4,982 | 5,789,727 | 92 | 4,231,851 |
| Dec 2022 | 33,912 | 6,965,930 | 0 | 4,868,289 |
Source: Statistics Canada. Retrieved on March 28, 2023. Calculation of the OCE.
Services trade
Services trade recovery led by strength in the still recovering travel services sector
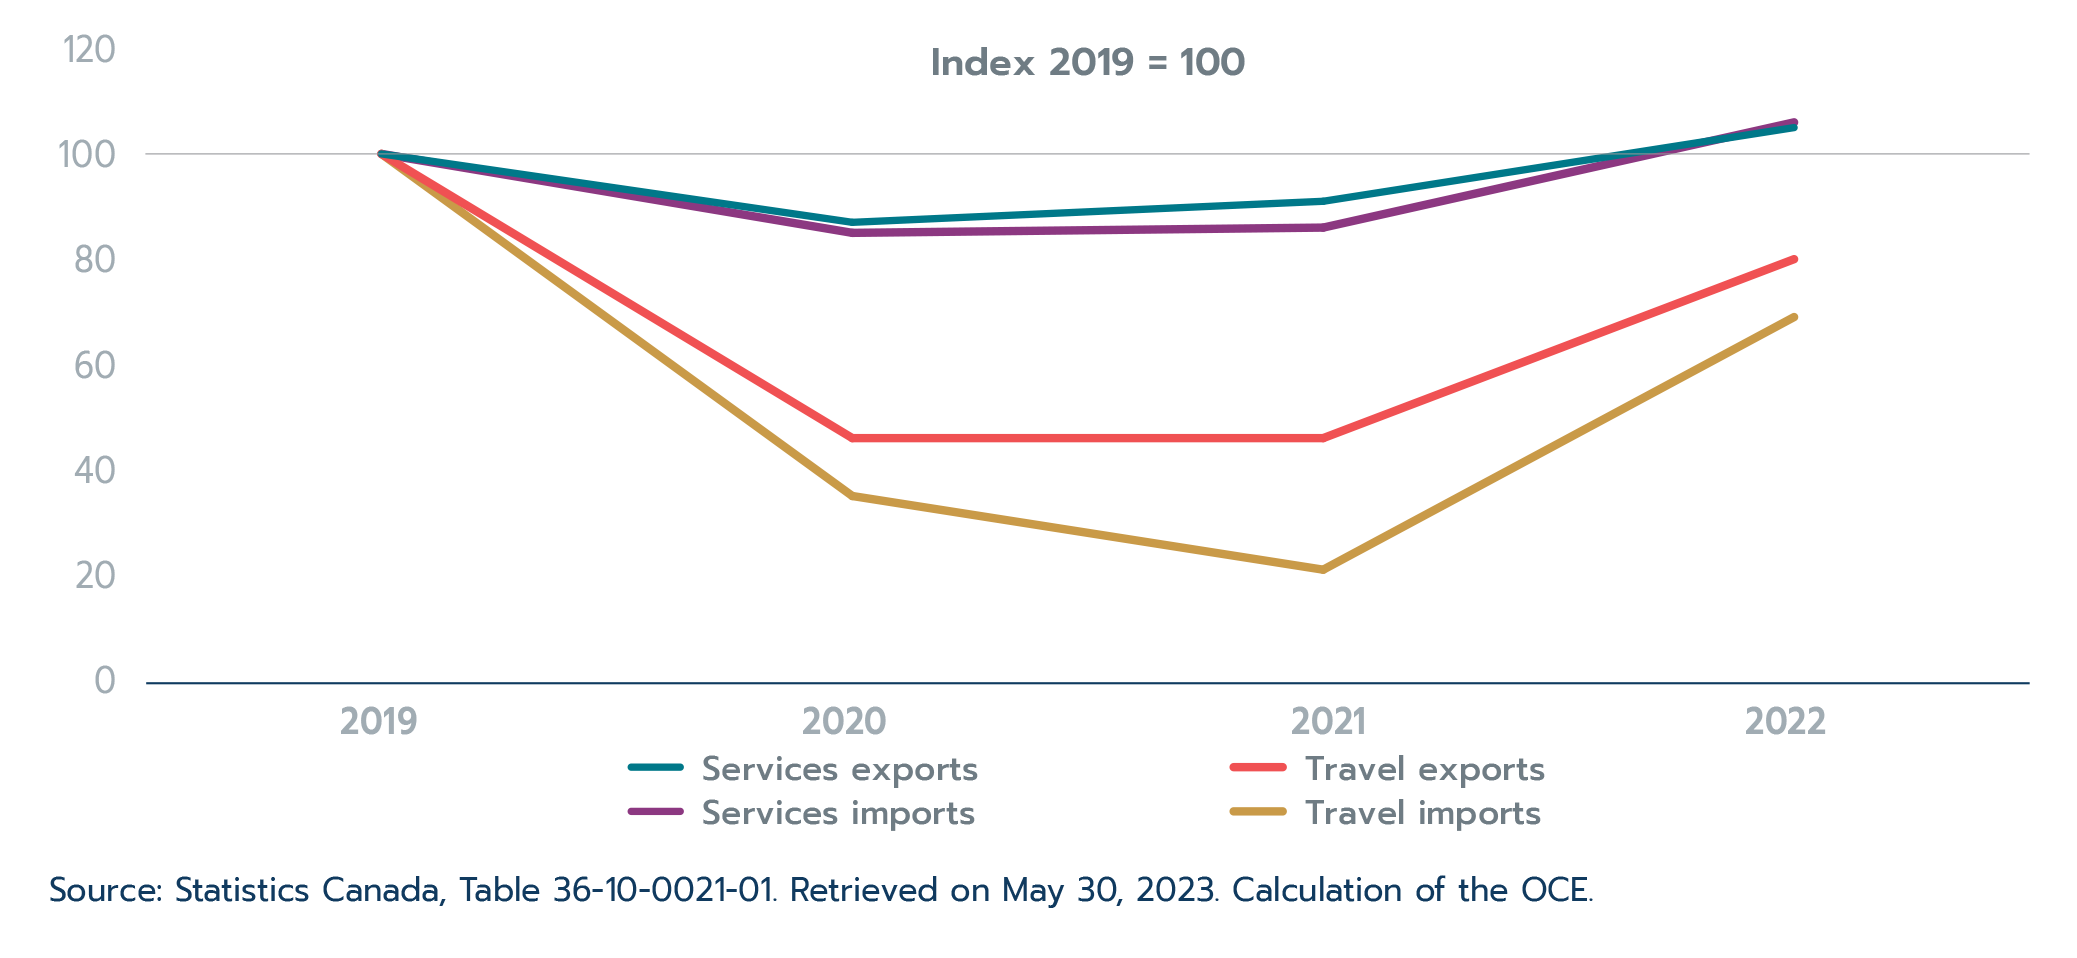
Compared to goods, the global pandemic had longer lasting effects on services trade. Restrictions on travel and in-person gatherings meant that many client-facing sectors suffered greatly during the past several years. With the elimination of Canada’s COVID-19-related restrictions in 2022, services exports and imports surpassed their 2019 levels (Figure 1.13), while goods exports and imports had already done so the year before. Travel services in particular are still in recovery mode, while commercial services were in fact one of the sectors least impacted by the pandemic (even compared to goods) and have seen steady growth over the past two years.
Figure 1.13: Services trade surpasses pre-pandemic levels but travel services are still struggling
Text version
Services trade surpasses pre-pandemic levels but travel services are still struggling
Index 2019 = 100
| 2019 | 2020 | 2021 | 2022 | |
|---|---|---|---|---|
| Services exports | 100 | 87 | 91 | 105 |
| Travel exports | 100 | 46 | 46 | 80 |
| Services imports | 100 | 85 | 86 | 106 |
| Travel imports | 100 | 35 | 21 | 69 |
Source: Statistics Canada, Table 36-10-0021-01. Retrieved on May 30, 2023. Calculation of the OCE.
Canada’s services exports reached new highs in 2022, increasing by 15.6% to $161.2 billion (Table 1.3). Exports across all four major services sectors increased, with travel services driving growth. Travel and transportation services posted strong growth in 2022 as they continued to recover alongside the removal of COVID-19-related restrictions. Travel services exports increased by a robust 74.8% to reach $31.7 billion, accounting for over sixty percent of overall services export growth. Transportation services exports (27.8%), which were also impacted by physical restrictions in place due to COVID-19, also increased faster than services exports overall. Government services exports, which also saw a significant contraction in 2020, expanded by 3.9% in 2022. Meanwhile, commercial services exports, which grew steadily throughout the pandemic, posted modest growth of 3.8% in 2022. The strong 2022 performance helped services exports surpass their pre-pandemic levels.
Overall, services exports were 5.4% above their pre-pandemic levels in 2022, but travel services were still 19.9% below their pre-pandemic levels. The number of travellers entering Canada reflects these trends (see Box 1.6). Government services exports, which account for only about one percent of services exports, also remained below their pre-pandemic levels in 2022.
Table 1.3: Canada’s services trade by sector
| 2022 ($ billions) | 2022 vs. 2021 ($ change, billions) | 2022 vs. 2021 (% change) | |
|---|---|---|---|
| Services exports | |||
| Total, services | 161.2 | 21.7 | 15.6 |
| Travel services | 31.7 | 13.6 | 74.8 |
| Transportation services | 19.0 | 4.1 | 27.8 |
| Commercial services | 109.1 | 4.0 | 3.8 |
| Government services | 1.5 | 0.1 | 3.9 |
| Services imports | |||
| Total, services | 178.9 | 33.8 | 23.3 |
| Travel services | 32.2 | 22.3 | 225.4 |
| Transportation services | 36.1 | 9.1 | 33.9 |
| Commercial services | 108.8 | 2.2 | 2.1 |
| Government services | 1.8 | 0.1 | 4.3 |
Source: Statistics Canada, Table 36-10-0021-01. Retrieved on May 30, 2023. Calculation of the OCE.
Services imports outpaced services exports, growing by 23.3% to reach $178.9 billion in 2022 (Table 1.3). Faster growth in services imports resulted from the still-recovering travel services sector, which accounted for a larger share of the growth in services imports than services exports. Despite the faster growth, services imports and exports displayed similar trends. Travel services imports led growth, increasing to $32.2 billion in 2022, equivalent to over three times their 2021 levels. Travel services imports accounted for about two-thirds of services import growth in 2022. Transportation services imports (+33.9%) also outpaced services import growth overall, while commercial (+2.1%) and government (+4.3%) services imports increased at a slower-than-average pace. Despite the over three-fold increase in travel services imports, they remain 31.3% below their pre-pandemic levels. Meanwhile, services imports as a whole ended 2022 at 6.5% above their 2019 levels.
Box 1.6: More Canadians travelled abroad, and visits to Canada increased in 2022, but traveller volumes have yet to reach pre-pandemic levels
Before the pandemic, travel services accounted for 25.9% of Canada’s total services exports – second only to commercial services. However, with the implementation of public health protocols to stop the spread of COVID-19 and the general reluctance of people to travel, travel services trade plummeted; as a result, travel services only accounted for 19.7% of Canada’s total services exports by 2022, remaining 19.9% below their pre-pandemic levels.
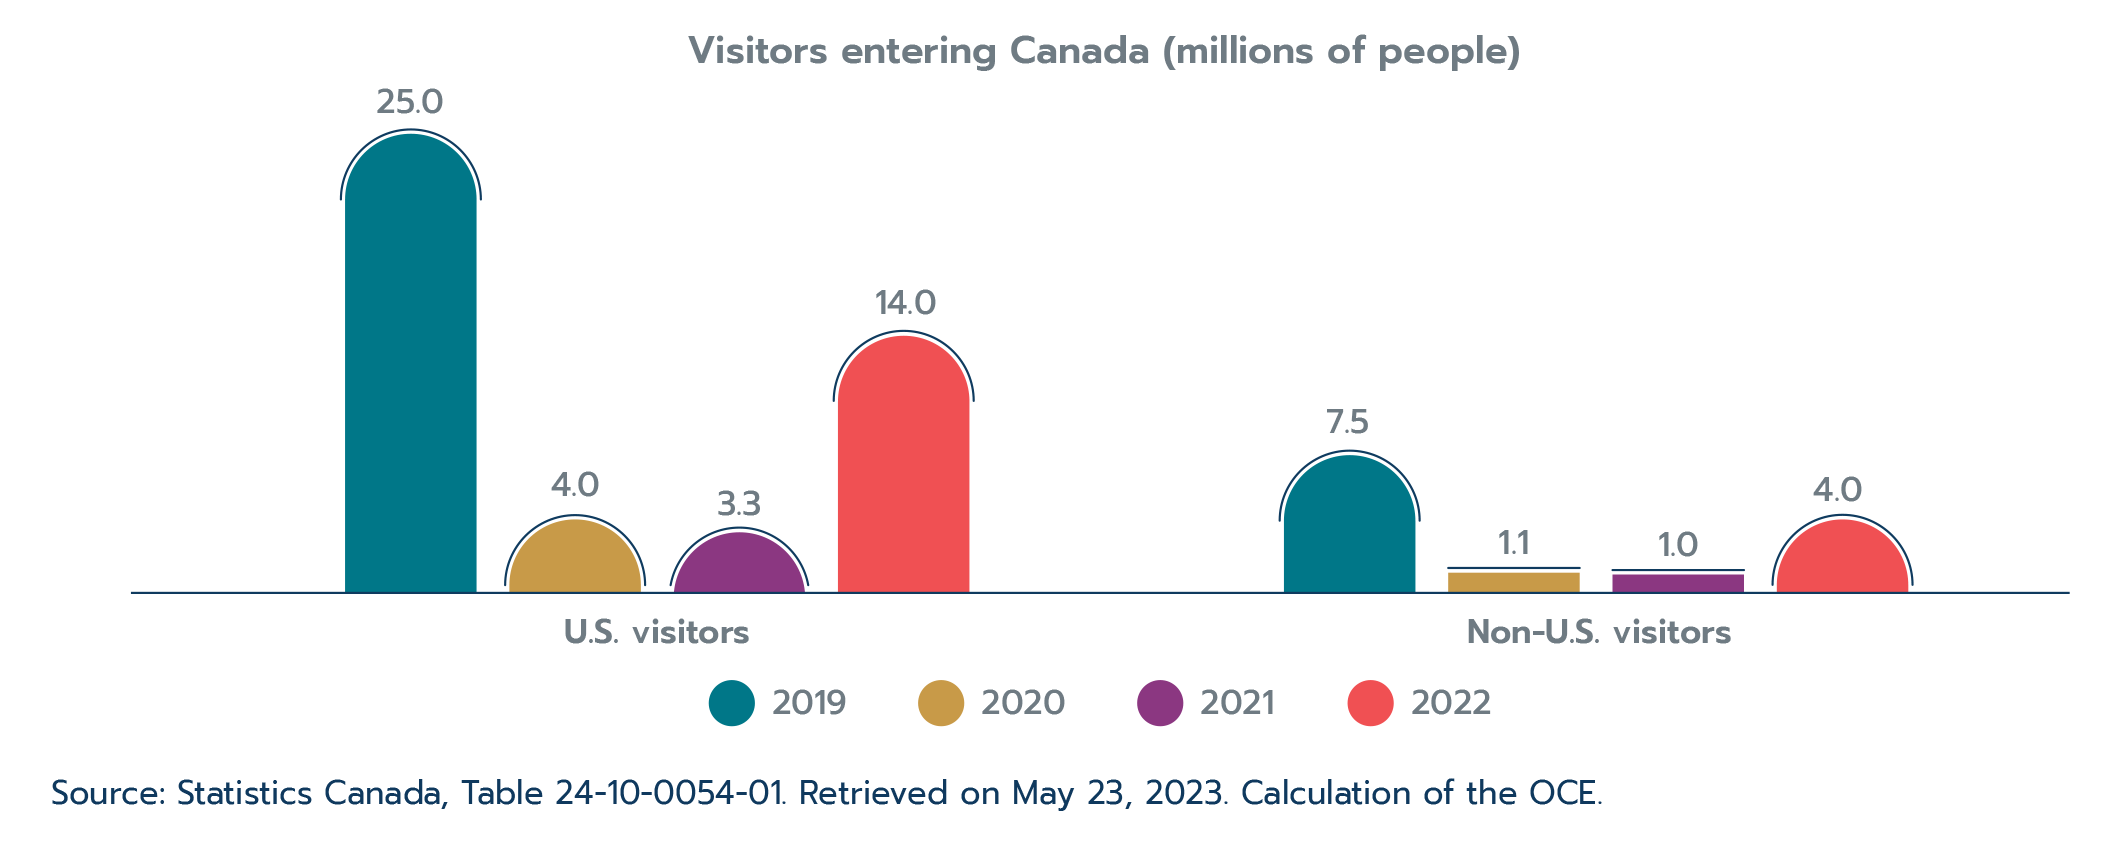
Looking at the number of visitors to Canada is another way to view the impact of the pandemic on travel services exports. Over four times as many travellers visited Canada in 2022 compared to the previous year. This significant increase resulted in over 17.9 million visitors entering Canada in 2022. Visits from U.S. travellers accounted for 77.9% of total visits to Canada, outpacing growth in visits from residents of non-U.S. locations.
While the 2022 increase in travellers to Canada was notable, the total number of travellers remains significantly below pre-pandemic levels (Figure 1.14). Over 14.5 million fewer travellers entered Canada in 2022 compared to 2019; visits from U.S. and non-U.S. travellers were roughly 44.0% and 47.0% lower in 2022 than in 2019, respectively. The Canadian economy lost out on the benefits associated with spending by these 14.5 million visitors, impacting many services sectors.
Figure 1.14: Over 14.5 million fewer travellers visited Canada in 2022 than in 2019
Text version
Over 14.5 million fewer travellers visited Canada in 2022 compared to 2019.
Visitors entering Canada (millions of persons)
| 2019 | 2020 | 2021 | 2022 | |
|---|---|---|---|---|
| U.S. visitors | 25.0 | 4.0 | 3.3 | 14.0 |
| Non-U.S. visitors | 7.5 | 1.1 | 1.0 | 4.0 |
Source: Statistics Canada, Table 24-10-0054-01. Retrieved on May 23, 2023. Calculation of the OCE.
Travel services imports followed a similar trend; the number of Canadians travelling abroad was over four times higher in 2022 than in 2021 but remained 43.1% below 2019 levels. Canada dropped all of its COVID-19-related travel restrictions in the fall of 2022, which boosted travel to and from the country in the fourth quarter. The outlook for travel in 2023 is hard to predict as fewer COVID-19 travel restrictions internationally and a gloomier global economic outlook may have opposite effects on the industry’s recovery.
The United States helped support the services trade recovery
Canada’s services exports increased by $21.7 billion in 2022, with services exports to the United States (+$8.9 billion) making the largest contribution, despite posting slower growth than services exports overall (Table 1.4). Services exports to each of Canada’s major trading partners advanced in 2022. The second and third largest contributions to services export growth in 2022 came from China (+$2.0 billion) and India (+$1.2 billion), where services exports expanded faster than the average. Services exports to France, Hong Kong, and Mexico also rose at an above-average pace in 2022. Among Canada’s top 10 services export markets, China (-11.6%), Germany (-10.5%) and Japan (-8.0%) remain below their pre-pandemic levels. Travel and transportation services continue to hold down the services export recovery in these markets while commercial services exports surpassed their pre-pandemic levels in 2021.
Even more than for exports, the United States led Canada’s services import growth in 2022. Services imports increased by $33.8 billion over the year, while imports from that country grew by $19.0 billion. After the United States, services imports from the United Kingdom (+$1.3 billion) and Mexico (+$ 1.1 billion) made the largest contributions to growth in 2022. As with exports, growth in Canada’s services imports was widespread, with imports from all major trading partners rising in 2022. Except for services imports from Mexico and Japan, imports from Canada’s top 10 trading partners in 2022 were above their pre-pandemic levels.
Table 1.4: Canada’s services trade with top 10 trading partners
| 2022 ($ billions) | 2022 vs. 2021 ($ change, billions) | 2022 vs. 2021 (% change) | |
|---|---|---|---|
| Services exports | |||
| Total, all countries | 161.2 | 21.7 | 15.6 |
| United States | 86.6 | 8.9 | 11.5 |
| United Kingdom | 7.7 | 0.9 | 13.7 |
| China | 7.6 | 2.0 | 36.7 |
| India | 6.2 | 1.2 | 25.4 |
| France | 4.7 | 1.0 | 26.2 |
| Germany | 3.2 | 0.1 | 4.0 |
| Hong Kong | 2.5 | 0.5 | 22.6 |
| Switzerland | 2.5 | 0.2 | 10.0 |
| Japan | 2.0 | 0.4 | 23.7 |
| Netherlands | 2.0 | 0.1 | 6.6 |
| All other countries | 36.2 | 6.3 | 21.1 |
| Services imports | |||
| Total, all countries | 178.9 | 33.8 | 23.3 |
| United States | 101.7 | 19.0 | 23.0 |
| United Kingdom | 9.3 | 1.3 | 16.4 |
| Hong Kong | 6.3 | 0.9 | 17.1 |
| China | 4.3 | 0.9 | 26.7 |
| Germany | 4.0 | 0.6 | 18.9 |
| France | 3.6 | 0.8 | 28.0 |
| Singapore | 3.1 | 0.4 | 15.1 |
| Japan | 3.0 | 0.7 | 31.9 |
| India | 2.9 | 0.5 | 19.5 |
| Mexico | 2.6 | 1.1 | 72.5 |
| All other countries | 38.1 | 7.5 | 24.4 |
Source: Statistics Canada, Table 12-10-0157-01. Retrieved on May 30, 2023. Calculation of the OCE.
1.5 Canadian foreign direct investment performance
Following significant rebounds in 2021, both Canadian direct investment abroad (CDIA) and foreign direct investment (FDI) flows declined in 2022. Nevertheless, CDIA and FDI flows remained above their average of the pre-pandemic decade (2010‒2019), but below their 2019 levels. More specifically, after rising to a record $121.6 billion in 2021, CDIA flows declined 15.8% to $102.3 billion in 2022, which is still above the $72.4 billion average for 2010‒2019 (Figure 1.15), but below the 2019 pre-pandemic level ($102.8 billion). Similarly, FDI flows decreased 21.5% from a record $82.3 billion in 2021 to $64.6 billion in 2022, still higher than the 2010‒2019 average of $49.8 billion, but below the 2019 pre-pandemic level ($67.1 billion).
The decline in CDIA flows in 2022 was led by mergers and acquisitions (M&As), which fell 57.6% to $27.2 billion, offsetting a quadruple increase in “other flows” Footnote 2 ($13.5 billion) and a 13.4% increase in reinvested earnings Footnote 3 (to a record $61.6 billion). The decrease in FDI flows, on the other hand, was driven largely by a substantial 89.6% drop in “other flows” (to a record low of $2.2 billion), as well as a 7.6% decline in M&As ($19.2 billion). These declines offset a 7.8% increase in reinvested earnings to a record $43.2 billion.
Notably, over the last decade (2013‒2022), reinvested earnings were the largest component of CDIA flows for about half of the years (2013, 2018‒2020 and 2022). In other years, M&As were the largest component. Reinvested earnings were the largest component for FDI flows in nearly every year over the past decade, except for 2014‒2015 and 2020 when M&As dominated.
As shown in Figure 1.15, CDIA flows outpaced FDI flows in 2022, the continuation of a trend observed since 2014.
Figure 1.15: Declines in both Canada’s FDI inflows and outflows in 2022
Text version
Declines in both Canada’s FDI inflows and outflows in 2022
Canada’s flows of foreign direct investment
| Canadian direct investment abroad ($ billions) | Foreign direct investment in Canada ($ billions) | |
|---|---|---|
| 2010 | 35.8 | 29.3 |
| 2011 | 51.6 | 39.3 |
| 2012 | 55.8 | 43.1 |
| 2013 | 59.1 | 71.5 |
| 2014 | 66.6 | 65.2 |
| 2015 | 86.2 | 56.1 |
| 2016 | 92.1 | 47.8 |
| 2017 | 98.9 | 29.6 |
| 2018 | 75.2 | 48.8 |
| 2019 | 102.8 | 67.1 |
| 2020 | 56.9 | 36.1 |
| 2021 | 121.6 | 82.3 |
| 2022 | 102.3 | 64.6 |
| 10-year average | 72.4 | 49.8 |
Source: Statistics Canada, Table 36-10-0025-01, Retrieved in May 2023. Calculation of the OCE.
Overall, global FDI inflows and outflows mostly followed the same pattern as Canadian FDI inflows and outflows, so Canadian trends are largely in line with international trends.
Sectoral composition
The finance and insurance sector represented the highest share of CDIA flows in 2022 at 46.9%, followed by energy and mining at 16.9% and management of companies and enterprises at 16.7%. CDIA from the finance and insurance sector rose 50.6% to $48.0 billion in 2022, the highest since the record $54.3 billion reached in 2015. Other notable gains were in energy and mining, which nearly tripled to $17.3 billion, and manufacturing, which also almost tripled to $6.5 billion. The trade and transportation sector, which accounted for almost half of CDIA flows in 2021, experienced a massive 94.2% drop in 2022 to $3.4 billion.
With respect to FDI flows, the management of companies and enterprises Footnote 4 sector nearly doubled in 2022 to $11.4 billion, the highest level since 2014 and almost double its pre-pandemic level of 2019. The 21.5% decline in FDI flows between 2021 and 2022 was attributed largely to a 73.3% decrease in the “other industries” sector to $3.6 billion. It now represents the lowest sectoral share of FDI flows in 2022 at 5.5%. Other notable declines were in energy and mining (-16.0%), manufacturing (-32.6%), and finance and insurance (-9.8%). Despite these declines, the manufacturing sector continued to account for the largest share of FDI flows in 2022 at 24.0%, followed by energy and mining (21.8%), and trade and transportation (17.8%).
Table 1.5: CDIA and FDI flows by sector (2022)
| Value ($B) | Change from 2021 (%) | Change from 2021 ($B) | |
|---|---|---|---|
| CDIA | |||
| Energy and mining | 17.3 | 198.0 | 11.5 |
| Manufacturing | 6.5 | 181.3 | 4.2 |
| Trade and transportation | 3.4 | -94.2 | -56.2 |
| Finance and insurance | 48.0 | 50.6 | 16.1 |
| Management of companies and enterprises | 17.1 | 23.2 | 3.2 |
| Other industries | 10.0 | 23.3 | 1.9 |
| Total | 102.3 | -15.8 | -19.3 |
| FDI | |||
| Energy and mining | 14.1 | -16.0 | -2.7 |
| Manufacturing | 15.5 | -32.6 | -7.5 |
| Trade and transportation | 11.5 | -3.7 | -0.4 |
| Finance and insurance | 8.5 | -9.8 | -0.9 |
| Management of companies and enterprises | 11.4 | 46.5 | 3.6 |
| Other industries | 3.6 | -73.3 | -9.8 |
| Total | 64.6 | -21.5 | -17.7 |
Source: Statistics Canada, Table 36-10-0026-01. Retrieved in May 2023. Calculation of the OCE.
Geographic composition
The United States continues to be Canada’s top investment partner as the destination of 52.3% ($53.6 billion) of CDIA flows and the source of 41.5% ($26.8 billion) of all FDI inflows in 2022. However, while the United States was the main driver of Canada’s 2021 investment recovery, it also led Canada’s investment decline in 2022. There was a $22.7 billion drop in CDIA flows destined to the United States between 2021 and 2022, and a $9.9 billion loss of FDI inflows from the United States during the same period.
The United Kingdom was the second largest destination of CDIA flows in 2022 with a 5.0% share, followed by Australia (3.9%) and Switzerland (3.6%). CDIA flows to the United Kingdom made a significant recovery in 2022, nearly tripling to $5.2 billion, while CDIA flows to Switzerland grew more than five times to $3.7 billion. Important destinations of CDIA such as France, Luxembourg, and the Netherlands reported decreases of 72.4%, 118.4%, and 485.4%, respectively, with France dropping out of the top 10 in 2022 from fourth place in 2021. In level terms, the drop in FDI outflows in 2022 was led by the United States (-$22.7 billion), Luxembourg (-$5.8 billon), and France (-$3.5 billion).
As for Canada’s FDI sources, the United States accounted for 41.5% of FDI inflows in 2022, followed by the Netherlands and Luxembourg, which together represented 32.3% of inflows. Other important FDI sources in 2022 were Australia (7.7%), the United Kingdom (6.5%), Brazil (3.2%), and France (3.1%). Among these countries, gains were reported by the Netherlands (+19.5%), Luxembourg (+90.9%) and Australia (+1,896.4%), while the United States (-26.9%), the United Kingdom (-59.8%), Brazil (-10.9%), and France (-36.8%) posted losses. In level terms, the decline in FDI inflows in 2022 was driven by the United States (-$9.8 billion), the Cayman Islands (-$7.3 billion) and the United Kingdom (-$6.2 billion).
In the last decade (2013‒2022), the average share of FDI inflows from the United States was 47.6%. Since 2018, the share value of that country has been below the 10-year average fluctuating between 35.6% and 44.6%. For FDI outflows, the 10-year average for flows to the United States was 64.1%. Since 2019, the share value remained below the average, with the exception of 2020 when it reached 71.1%.
Table 1.6: CDIA and FDI flows (2022) – Top 10 countries
| Value ($B) | Change from 2021 (%) | Change from 2021 ($B) | |
|---|---|---|---|
| CDIA destinations | |||
| United States | 53.6 | -29.8 | -22.7 |
| United Kingdom | 5.2 | 172.2 | 3.3 |
| Australia | 4.0 | -23.3 | -1.2 |
| Switzerland | 3.7 | 421.5 | 3.0 |
| Brazil | 3.4 | 8.3 | 0.2 |
| Barbados | 3.1 | -244.3 | 5.3 |
| Cayman Islands | 3.0 | 387.9 | 2.4 |
| Netherlands | 2.1 | -485.4 | 2.7 |
| China | 1.9 | 111.0 | 1.0 |
| Mexico | 1.8 | -5.2 | -0.1 |
| Other countries | 20.5 | -39.0 | -13.1 |
| Total | 102.3 | -15.8 | -19.3 |
| FDI sources | |||
| United States | 26.8 | -26.9 | -9.9 |
| Netherlands | 13.0 | 19.5 | 2.1 |
| Luxembourg | 7.8 | 90.9 | 3.7 |
| Australia | 5.0 | 1896.4 | 4.7 |
| United Kingdom | 4.2 | -59.8 | -6.2 |
| Brazil | 2.1 | -10.9 | -0.3 |
| France | 2.0 | -36.8 | -1.2 |
| Barbados | 1.3 | 293.0 | 1.0 |
| Hong Kong | 1.3 | -215.3 | 2.4 |
| Germany | 0.8 | -47.6 | -0.7 |
| Other countries | 0.2 | -98.5 | -13.4 |
| Total | 64.6 | -21.5 | -17.7 |
Source: Statistics Canada, Table 36-10-0473-01. Retrieved in May 2023. Calculation of the OCE.
It should be noted that both CDIA and FDI flow data reflect the immediate destination/investor information and refer to the last country through which the investment transited before reaching its destination. This is different from data based on the ultimate destination/investor which are more accurate but not always available. As a result, flow data may not accurately reflect investments from countries that invest via intermediaries (e.g., China or Japan) or that act as intermediaries (e.g., the Cayman Islands or Barbados). For more details on the difference between immediate and ultimate destination/investor, see Chapter 2 of Canada’s State of Trade 2021.
In summary, 2022 saw a continuation of the post-pandemic recovery started in 2021. While CDIA and FDI flows declined from their 2021 values, they remained above their pre-pandemic 2010‒2019 average. In the year to come, it is unclear whether these strong CDIA and FDI flows will continue given that businesses are now facing an environment impacted by a global economic slowdown, slowing but elevated inflation, and persistent uncertainty from the war in Ukraine.
Part 2: Inclusive trade
Part 2: At a glance
Canada's inclusive trade approach recognizes that trade's impacts are not neutral.
- Motivation: Inclusive trade aims to ensure the benefits of trade reach underrepresented groups. It recognizes that when more groups prosper, everyone in the economy benefits.
- Mechanisms to support inclusive trade:
- Trade policies
- Trade promotion programs
- Financing and other supports
- Data and research are essential: We need to know where we stand, identify barriers and success factors, and track progress for an effective approach to inclusive trade.
Small and medium enterprises are an important part of Canada's export picture.
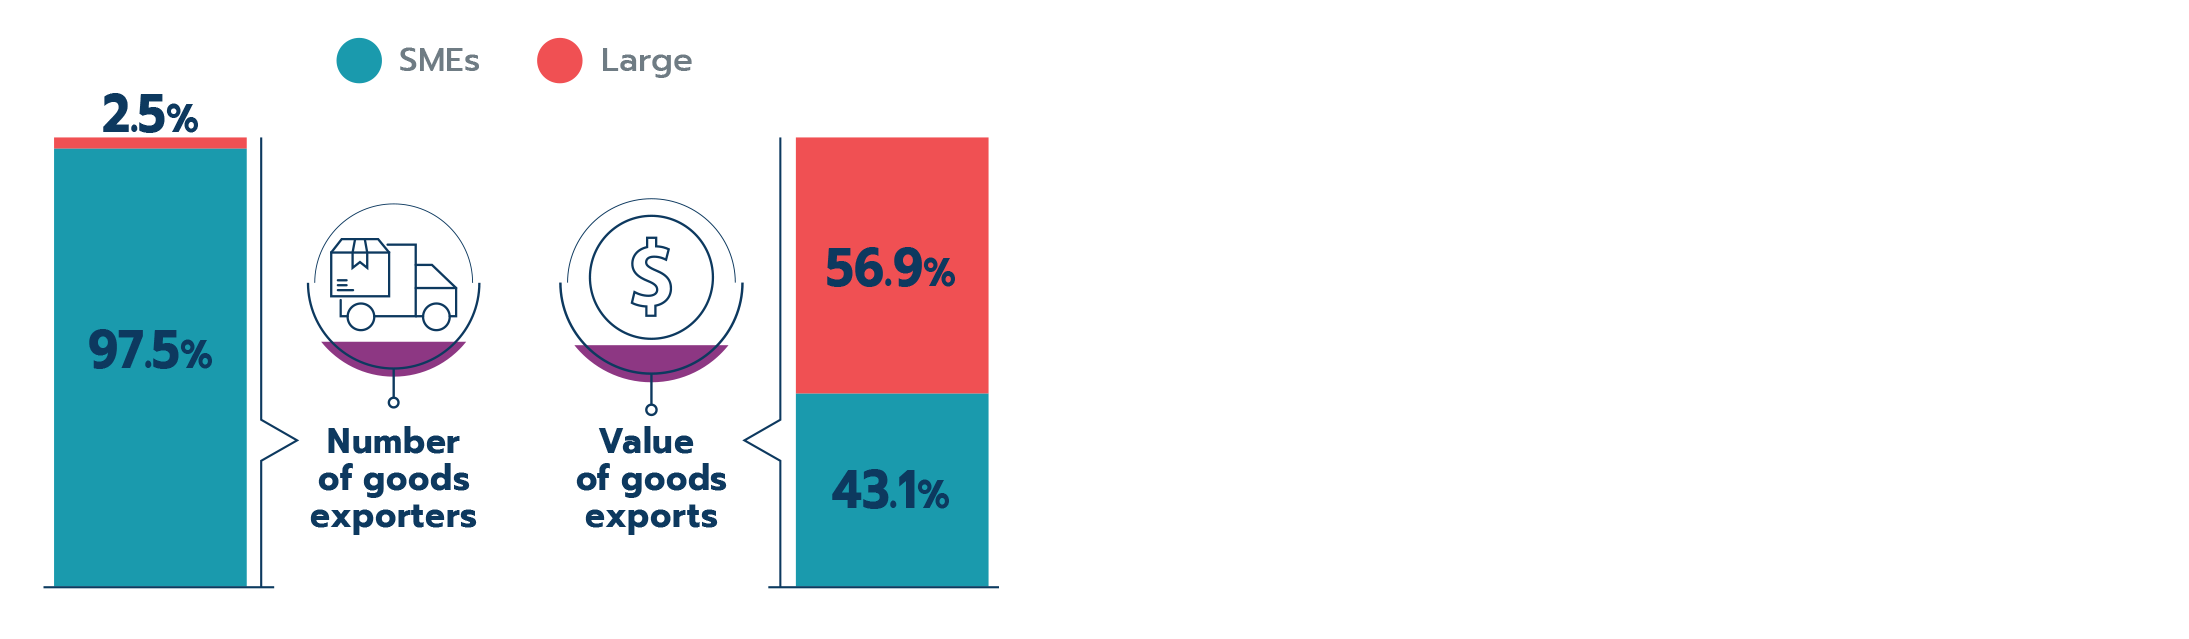
Text version
| SMEs | Large | |
|---|---|---|
| Number of goods exporters (%) | 97.5 | 2.5 |
| Export value of goods (%) | 43.1 | 56.9 |
- Who? 12.1% of SMEs exported in 2020, a share that has been slowly climbing.
- What? Services exports have gained popularity over last decade, with smaller SMEs exporting mostly services. E-commerce has facilitated this shift, growing significantly.
- Where? 84% of SME exporters exported to the U.S. in 2020, with most of them exporting only to U.S. markets. Larger firms are more likely to export to the U.S. and other markets.
- Pandemic impacts: Smaller SMEs were hit harder, but lots of positive signs of recovery.
Trade's employment impacts—both positive and negative—affect women differently.

Text version
| Women | Men | |
|---|---|---|
| Canadian jobs supported by exports (%) | 31.1 | 68.9 |
- Uneven impacts: women are more likely to be employed in less export-intensive industries (e.g. health and education services).
- Quantifying impacts: employment impacts of trade policies on females can be estimated before the policy is implemented (ex ante) or afterwards (ex post).
- ex ante: CUSMA's impacts estimated to be equally shared among females and males due to the high number of sales, professional and clerical jobs protected.
- ex post: CPTPP's impacts indicate that females were somewhat shielded from poor performing firms, but also benefitted less from growth of high-performing firms.
Underrepresented entrepreneurs face unique challenges when exporting, and also have important strategies for success.
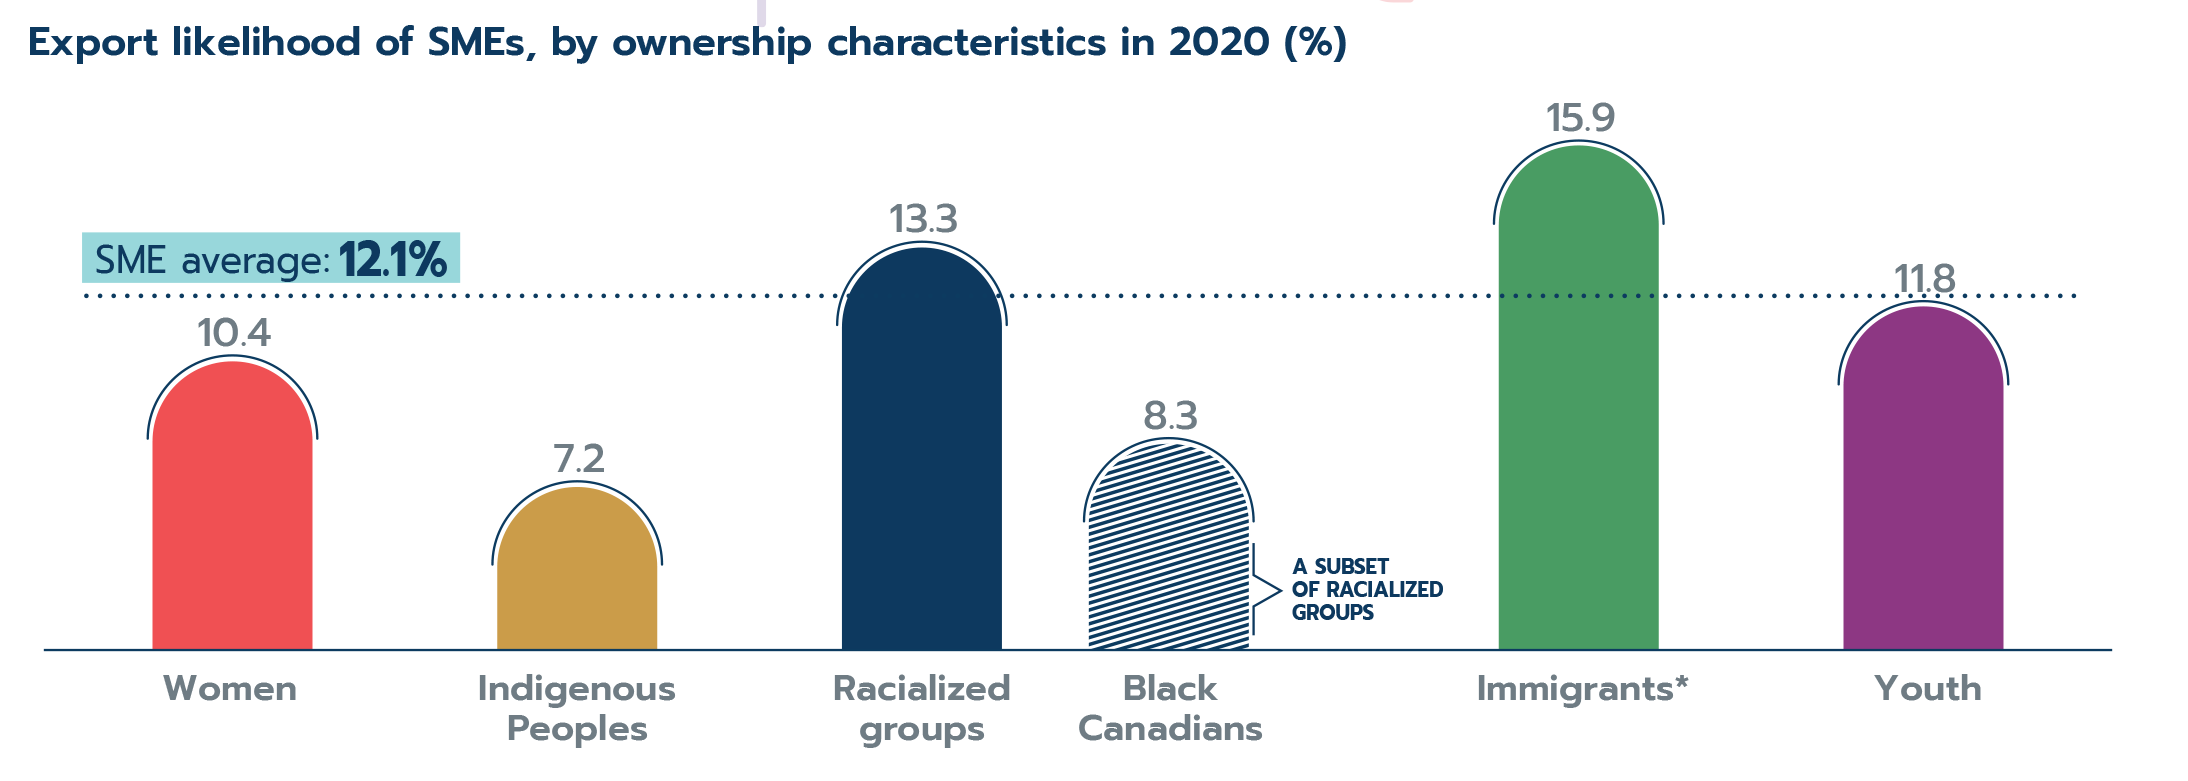
*Immigrants and youth are characteristics of SMEs' primary decision makers. Youth is defined as younger than 40 years old.
Text version
Export likelihood of SMEs, by ownership characteristics in 2020 (%)
| SMEs by ownership characteristics | 2020 (%) |
|---|---|
| Women | 10.4 |
| Indigenous Peoples | 7.2 |
| Racialized groups | 13.3 |
| Black Canadians | 8.3 |
| Immigrants* | 15.9 |
| Youth | 11.8 |
| Canadian SME average | 12.1 |
Women who export
- Export activity: Women are underrepresented in Canada's SME landscape, but tend to export at similar rates as men.
- Challenges and enablers: Financing, border, and logistical challenges affect women-owned exporters, while e-commerce is associated with a 38% increased likelihood of exporting.
Indigenous exporters
- Export activity: Indigenous Peoples are active in every industry and in diverse international markets.
- Challenges and enablers: Distance to markets, inadequate digital or physical infrastructure, and lack of access to financing affect the ability to export. Meanwhile, e-commerce is associated with 6 times higher odds of exporting.
Other groups
- Racialized groups account for 26.5% of the population, but only 9.3% of SMEs. Despite this, they are more likely to export.
- Black Canadian SMEs tend to be newer and less likely to export, but are expansion-oriented.
- Immigrants export to more diverse markets than Canadian SMEs on average, making them key to Canada's diversification.
Evidenced-based policies and programs can help underrepresented groups seize international opportunities and enjoy the benefits of trade.
- Trade policies can open doors, reduce barriers, and foster collaboration.
- It is important to measure the impacts of various policies using an inclusive lens.
- Trade promotion programs can empower business owners to overcome challenges such as market knowledge and navigating border requirements.
- The Trade Commissioner Service offers tailored supports.
- Financial products can help overcome costs and reduce risks associated with exporting.
- Export Development Canada offers specialized financial products to exporters.
Sources: Statistics Canada: Trade in Goods Exporter Characteristics (2022); 2019 Supply-Use model (custom data order); Labour Force Survey (2022); and Survey of Financing and Growth of SMEs (2020). Canadian Council for Aboriginal Business and Global Affairs Canada (2023).
2.1 Introduction and motivation
Who benefits from trade?
International trade brings many benefits—to firms, workers, and consumers—ultimately augmenting the overall quality of life. Through trade, exporting firms benefit from an expanded customer base, allowing them to reap the efficiencies of economies of scale and grow their businesses, create new technologies, and ultimately becoming more productive and competitive. This expansion allows firms to pay higher salaries and attract skilled workers.
Meanwhile, international trade allows both firms and consumers to purchase a greater variety of products and services at lower cost. International trade is very important for Canada, supporting roughly one in six jobs nationwide.
While the economy-wide benefits of trade are well documented (see Office of the Chief Economist, 2012), these benefits do not automatically flow equally to everyone within an economy. The Government of Canada wants to ensure that the benefits of trade can reach all groups, including those who have been traditionally underrepresented in Canada’s trade picture, using an inclusive trade approach. This means having the right policies and programs in place to ensure that women, Indigenous and other racialized people, youth, 2SLGBTQI+, small and medium enterprises (SMEs) and others can benefit (Figure 2.1).
Figure 2.1: Canada’s underrepresented trade groups include…
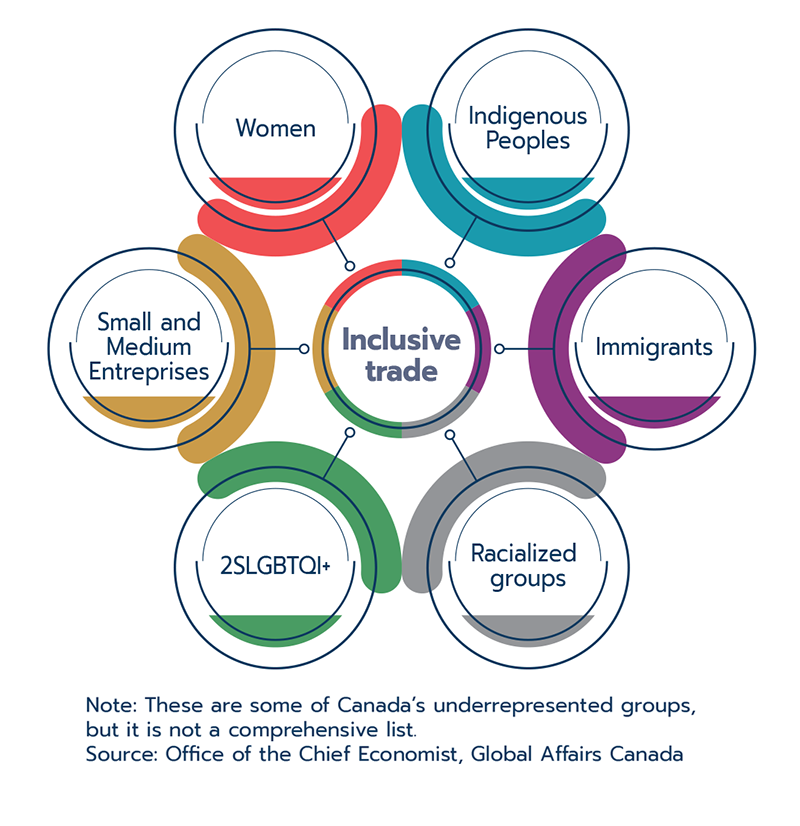
Text version
This figure provides examples of some of Canada’s underrepresented groups that are of focus for inclusive trade. The diagram shows several hexagons surrounding the words “Inclusive Trade” at the centre. The hexagons contain the following text, clockwise from the top: Women, Indigenous Peoples, Immigrants, Racialized groups, 2SLGBTQI+, and Small and Medium Enterprises.
Note: These are some of Canada’s underrepresented groups, but it is not a comprehensive list.
Source: Office of the Chief Economist, Global Affairs Canada
New methods of analysis and improvements to data are increasingly allowing us to develop a more refined analysis of trade’s impacts on Canadian society. Research in this area is helping us to better understand the characteristics of these underrepresented entrepreneurs, including their industries and business size, and is shedding light on their export experiences and challenges.
Meanwhile, economic modelling techniques using sex-disaggregated data enhance our understanding of how trade policies impact workers. This data and research allows us to understand where we stand and track progress. It identifies challenges and solutions that can shape effective trade policies and programs.
Our motivation—opportunities and benefits
While an inclusive trade approach works towards equity and inclusion within Canada, the benefits of reducing or eliminating these gaps go beyond only supporting underrepresented groups. The Canadian economy as a whole benefits when more people in society participate in international trade.
There is economy-wide growth potential when traditionally underrepresented groups can expand their businesses, find quality jobs or access lower cost consumer goods. For example, a study by McKinsey Global Institute estimates that more equitable inclusion of women in the workforce could add $150 billion to Canada’s economy (Devillard et al., 2017). Meanwhile, the National Aboriginal Economic Development Board has estimated that closing the Indigenous education, employment, income and productivity gaps could add $27.7 billion to the economy (The National Aboriginal Economic Development Board, 2016). This is not a zero-sum game; increased participation in trade spurs net economic expansion overall, and can result in increased economic opportunities and prosperity.
Inclusive trade framework
Our inclusive trade research framework centres around three economic agents: business owners, workers and consumers (Figure 2.2). Trade can impact these agents in specific ways, and the effects can be quite uneven across and within groups and industries.
Figure 2.2: Economic agents and how they can benefit from trade

Text version
This figure depicts three groups of people: business owners, workers, and consumers. Under each, there is a list of possible benefits to trade.
Business owners:
- competitiveness
- technology creation
- increased scale of production and lower costs
Workers:
- productivity
- wages
Consumers:
- access to foreign products and services
- increased variety and lower costs
Note: This is not a comprehensive list of benefits.
Source: Office of the Chief Economist, Global Affairs Canada
Business owners
International markets can catalyze growth for Canadian businesses in three ways (see Melitz and Trefler, 2012, for an overview):
- Larger markets and economies of scale
Selling internationally allows Canadian businesses to expand their customer base. While businesses in larger economies may not need to rely on trade to grow, it is almost essential for Canadian companies. A larger customer base allows firms to expand their scale of production, reaping efficiency gains resulting from lower per-unit production costs. - Increased innovation
There is a strong relationship between innovation and exporting at the firm level. Firms that invest in productivity-enhancing technologies are better positioned to take on the increased costs and risks that trade can bring. Empirical work confirms the importance of this effect; for example, Lileeva and Trefler (2010) found that the Canada-U.S. Free Trade Agreement of 1989 caused the productivity of new Canadian exporters to increase by 15.3% (which in turn raised the overall productivity of the manufacturing sector by 3.5%). The authors trace the source of this productivity gain back to investments in productivity, including in advanced manufacturing technologies and product and process innovations. - Improved productivity overall
There are several mechanisms through which internationalization results in increased productivity overall. One of the main sources of productivity growth is through a reallocation effect whereby internationalization allows better-performing firms to grow. Productive firms with lower costs are more capable of absorbing the increased costs and risks that come from international expansion, making them more likely to export. A second source of overall productivity growth is that worse-performing (i.e. less productive) firms contract or even shut down due to increased competition, thereby removing low-productivity firms from the economic landscape. These significant shifts between firms can negatively impact businesses and their workers, and are part of the reason why we see sometimes painful structural adjustments within an economy as it opens to international trade and competition.
Expanding internationally can impose additional costs and increased risks, which will be further discussed in subsequent sections of this report. Businesses must strengthen their market knowledge and invest significant time and resources into developing partnerships and commercial opportunities, not to mention the resources needed to increase production to meet foreign demand.
These costs are especially significant for smaller firms; it is not surprising, then, that we see a smaller share of SMEs engaged in exporting compared to large firms. Additionally, there are inherent risks involved in exporting; even firms with ample resources don’t always succeed in their international expansion plans (Sui and Goldfarb, 2014).
The importance of evaluating these effects through an inclusive lens stems from the need to understand how and where underrepresented businesses export, what factors enable success abroad, and what challenges business owners must overcome when doing so. Sections 2.2 (SMEs), 2.4 (Women-owned businesses), and 2.5 (Indigenous-owned businesses) highlight our research in these areas.
Using surveys and administrative data in its analysis, the Office of the Chief Economist research deepens our understanding of these firms’ export experiences, their characteristics and markets of interest, successful export/business strategies, and the challenges that they report facing. These approaches allow us to identify specific areas for policy or program action in order to reduce or eliminate gaps and ensure businesses can benefit from trade.
Workers
As exporting firms become more productive, they are able to pay their workers higher wages, and may increase wages to attract new talent to support their exporting activity (Office of the Chief Economist, 2012). However, the impacts are very uneven and depend on industry and firm characteristics, with many firms and industries unable to handle the increased competition that trade can bring.
Workers in firms or industries that are no longer competitive in this international landscape may need to seek employment in more productive firms and industries, which might be difficult if they do not possess the right skills, or if better employment opportunities are not available nearby. As such, the smoothness of workers’ re-allocation within an economy is critical to ensuring that the labour force benefits overall.
Moreover, the higher-skilled, higher-paid positions that can result from increased productivity in a firm do not automatically flow equally to all groups in society. This is where taking an inclusive lens approach is so important. We need to understand how these trade impacts affect underrepresented groups, and determine whether or not they are benefiting from quality employment opportunities at similar rates as their fellow Canadians.
The Office of the Chief Economist assesses the impacts of trade on workers using a gender lens to quantify both ex-ante impacts (i.e. before a policy intervention, such as the coming into force of a free trade agreement) and ex-post impacts (i.e. after a policy intervention). The number of jobs and changes in wages are of particular interest when exploring policy options and assessing impacts. A number of analytical approaches are used, including computational general equilibrium (CGE) modelling and econometric analyses of matched worker-firm-level data. Some of this work is explored in Sections 2.2 (SMEs) and 2.3 (Women in the workforce) of this report.
Consumers
Consumers benefit from trade by enjoying lower costs while accessing a broader variety of goods and services. We can see this “variety effect” when walking down grocery aisles in Canada and finding tropical fruits, lush vegetables and foreign pantry items that clearly made their way from far afield as a result of trade. But beyond food items, we can observe increased variety; for example, international trade allows Canadian students to choose from a variety of foreign universities when deciding where to study (i.e. import education services), and allows Canadian firms to source the exact technology they need to enhance their production process from any place in the world. Indeed, much empirical work has confirmed these variety effects, including our own research that found, for example, that the number of different products that Canada imported from Chile almost tripled after the Canada-Chile FTA came into force (Office of the Chief Economist, 2022).
While the trade benefits to consumers are clear, an inclusive lens can be more difficult to apply to consumers. Individual consumers normally form part of a household unit, with purchasing decisions often made collectively. Factors that determine trade’s impacts on consumers include income, household and family composition.
It is challenging to tease apart these experiences among household members; recent studies have focused on the impacts by various income levels, noting that women are more likely to be part of lower-income households. Given that lower income households spend a higher share of their income on consumption of necessary goods and services (e.g. groceries, housing), they experience the greatest benefits from reductions in trade barriers (Korinek, Moïsé and Tange, 2021).
Another area of analysis is gender-differentiated consumer products geared towards women and any evidence of higher tariffs or price discrimination (i.e. a “pink tax”); there has generally been mixed evidence stemming from this area of research (Korinek, Moïsé and Tange, 2021).
A note on gender vs. sex
Sex refers to biological characteristics, such as male, female or intersex. Gender refers to a social identity such as man, woman, non-binary or two-spirit. The State of Trade 2023 sometimes refers to gender, and sometimes to sex. The language used relates to the source data or research. For example, when reporting on the results from a survey that asks respondents for the gender of ownership, the State of Trade uses gender-based terminology like “women”. Meanwhile, in research that makes use of administrative data (e.g. birth records) which reports the sex of the person, the State of Trade uses sex-based terminology like “female”.
How to get there—enhancing policies and programs
Throughout Part 2 of this report, you will find highlighted many significant outcome gaps associated with inclusive trade, including:
- SMEs make up 98% of all goods exporters but only 43% of the value of Canada’s goods exports.
- Women account for around 31% of Canada’s jobs that are supported by export activity.Footnote 5
- Women-owned SME exporters are smaller and derive a smaller share of revenue from exporting compared to their men-owned counterparts.
- Indigenous-owned SMEs export at a lower rate than the Canadian SME average: 7.2% vs. 12.1%.
There are several policy, program and funding levers that can be employed to close these gaps. Some examples include: new chapters in trade agreements focused on improving the capacity and conditions of underrepresented groups (e.g. trade and gender chapters), women- or Indigenous-focused trade missions, targeted financial products and funding, outreach and training, and engaging with bilateral and multilateral partners to advance initiatives focused on inclusive trade, to name a few.
It is with these levers in mind, combined with the knowledge of benefits that can materialize when everyone can participate in trade, that the Office of the Chief Economist designs its inclusive trade research. The goal is to understand the impacts of trade on underrepresented groups, what unique challenges different groups face in international trade, and to determine what approaches can best help each group succeed and gain from trade. This special feature reviews progress made on these topics, but the work is not complete. Gaps remain in our understanding of how trade affects underrepresented groups, and which policies and programs are most effective in supporting them.
This research complements the Government of Canada’s Gender-based Analysis Plus (GBA Plus) process that is used to assess how women, men and gender-diverse people may experience government policies, programs and initiatives; more information on how Global Affairs Canada uses GBA Plus in its trade policies can be found in last year’s State of Trade report (Office of the Chief Economist, 2022).
Canada’s trade picture is evolving, offering more opportunity to include groups that were traditionally underrepresented. The advent of affordable digital and production innovations (including global value chains), coupled with trade liberalizing policies, have allowed previously un-traded goods and services to reach more distant markets. Industries such as professional and financial services, arts and entertainment, and educational services are now a significant part of Canada’s export picture; as you will see in this report, SMEs, women, Indigenous Peoples and other groups are very active in these industries and therefore have a lot of opportunity to benefit from trade. Well-informed policies and programs are needed to provide them with the support, resources and know-how to take advantage of it.
Box 2.1: Black and other racialized exporters
Racialized groups accounted for 26.5% of Canada ’s population according to the 2021 census, and have been a growing share of Canada’s population for several decades. Despite this prominence in Canada, SMEs that are majority-owned by racialized groups only account for 9.3% of all Canadian SMEs, pointing to an entrepreneurship gap. (Note: “racialized groups” refer to individuals who are non-white and non-Indigenous. They are also sometimes referred to as “visible minorities”.)
Despite the entrepreneurship gap, racialized groups are an important part of Canada’s exporter landscape. In fact, they are more likely to export than the Canadian SME average (13.3% compared to 12.1%). Owners from racialized groups account for 10.2% of Canada’s SMEs exporters (Figure 2.3). Canadians of Chinese ethnicity are the largest ethnic group among SME exporters, followed by South Asians.
Figure 2.3: Racialized groups account for a small, but significant share of Canada’s SME exporters
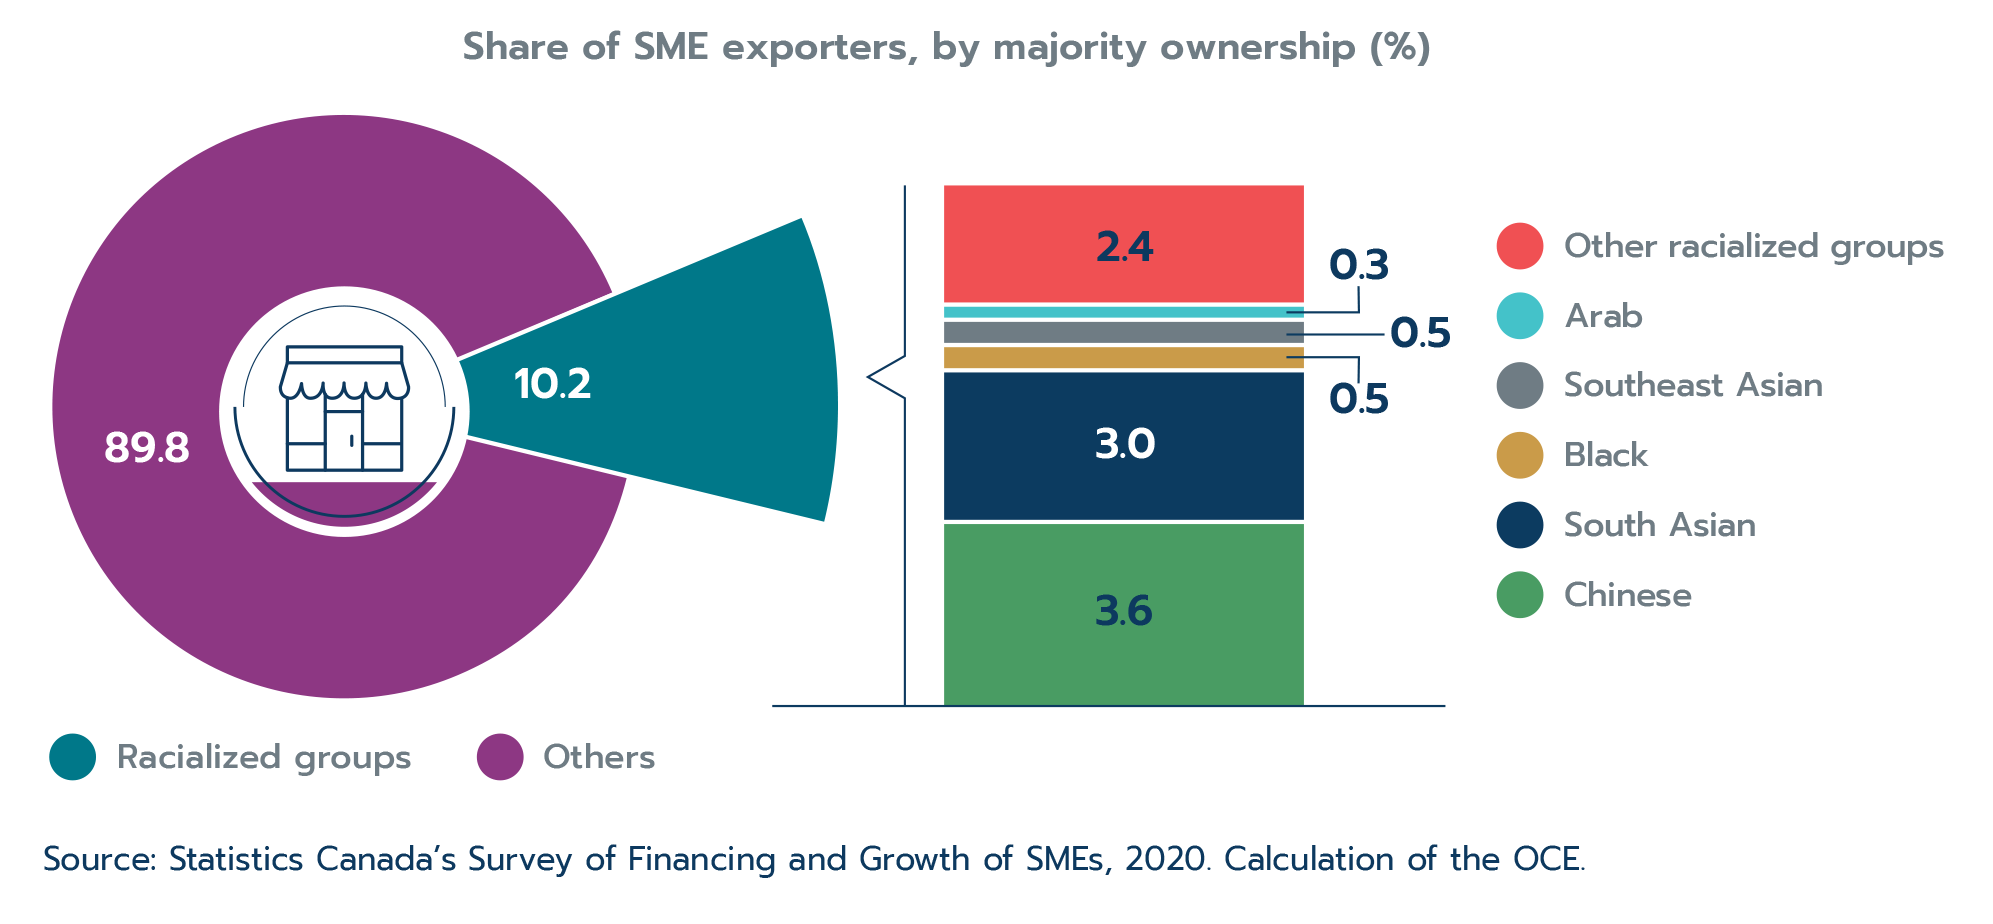
Text version
This is a pie chart depicting the share of SME exporters owned by racialized groups to be 10.2% of Canadian SME exporters, with the remainder accounting for 89.8%.
Splitting out from the section of the pie chart that represents racialized groups, there is a bar that shows the SME exporter breakdown by ethnicity:
| Ethnicity | Share of SME exporters (%) |
|---|---|
| Chinese | 3.6 |
| South Asian | 3.0 |
| Black | 0.5 |
| Southeast Asian | 0.5 |
| Arab | 0.3 |
| Other racialized groups | 2.4 |
Source: Statistics Canada’s Survey of Financing and Growth of SMEs, 2020. Calculation of the OCE.
Systemic barriers and inequalities continue to affect racialized entrepreneurs, which may in part explain the entrepreneurship gap. The pandemic brought to light some of these inequalities, particularly those that disproportionately affect Black Canadians. While Black-owned SMEs are less likely to export (8.3% compared to the Canadian average of 12.1%). They are also:
- very expansion-oriented: 17.1% of Black-owned SMEs intend to expand into new international markets within the next three years (compared to the Canadian SME average of 10.8%);
- more likely to be owned by women: 33.4% of Black owners are women compared to the Canadian average of 16.8%;
- newer with less experience: the average business age of Black-owned SMEs is 13 years (compared to the Canadian SME average of 18 years), and more than 26.1% of Black-owned SMEs are led by people with less than five years of experience in managing or owning a business compared to the Canadian average of 6.0%.
The Government of Canada’s Black Entrepreneurship Program partners with Black-led business organizations and financial institutions to help Black entrepreneurs grow their businesses. Since its launch in 2021, the program has helped more than 5,000 Black business owners get mentorship, business training and financing (Innovation, Science and Economic Development Canada, 2023).
2.2 Small and medium exporters—holding their own
Importance of SMEs for Canada’s export picture
Small and medium enterprises (SMEs) are a vital part of Canada’s connection to global markets. There are an estimated 95,400 SMEs that export goods or services from Canada, accounting for the vast majority of Canada’s exporters.Footnote 6
However, while they make up the majority of exporting firms, they represent a small share of the value of Canada's exports. A few large firms account for the majority: 61.3% of the value of Canada's goods exports comes from just 100 firms.
Even among SMEs, a few firms account for the bulk of export value; in 2022, just 10 firms accounted for 30.6% of the total value of goods exported by SMEs.Footnote 7
There are risks and steep costs to exporting, which can be significant—sometimes even prohibitive—barriers for SMEs. In Section 2.1, we saw that firms with higher productivity are generally better-placed to embark on an export journey; since smaller enterprises are generally less productive and have fewer resources at their disposal, they are therefore less likely to export. It is then not surprising that only 12.1% of SMEs exported in 2020, and that only 5.0% of SME sales came from export activity (Jiang and Sekkel, 2023).
Despite this lower likelihood to export, many SMEs are forging their way internationally. Both the share of SMEs that export (i.e. export propensity) and the share of sales that come from exporting (i.e. export intensity) have been slowly climbing over the last decade (Figure 2.4).
Figure 2.4: SMEs’ engagement in export activity has slowly climbed
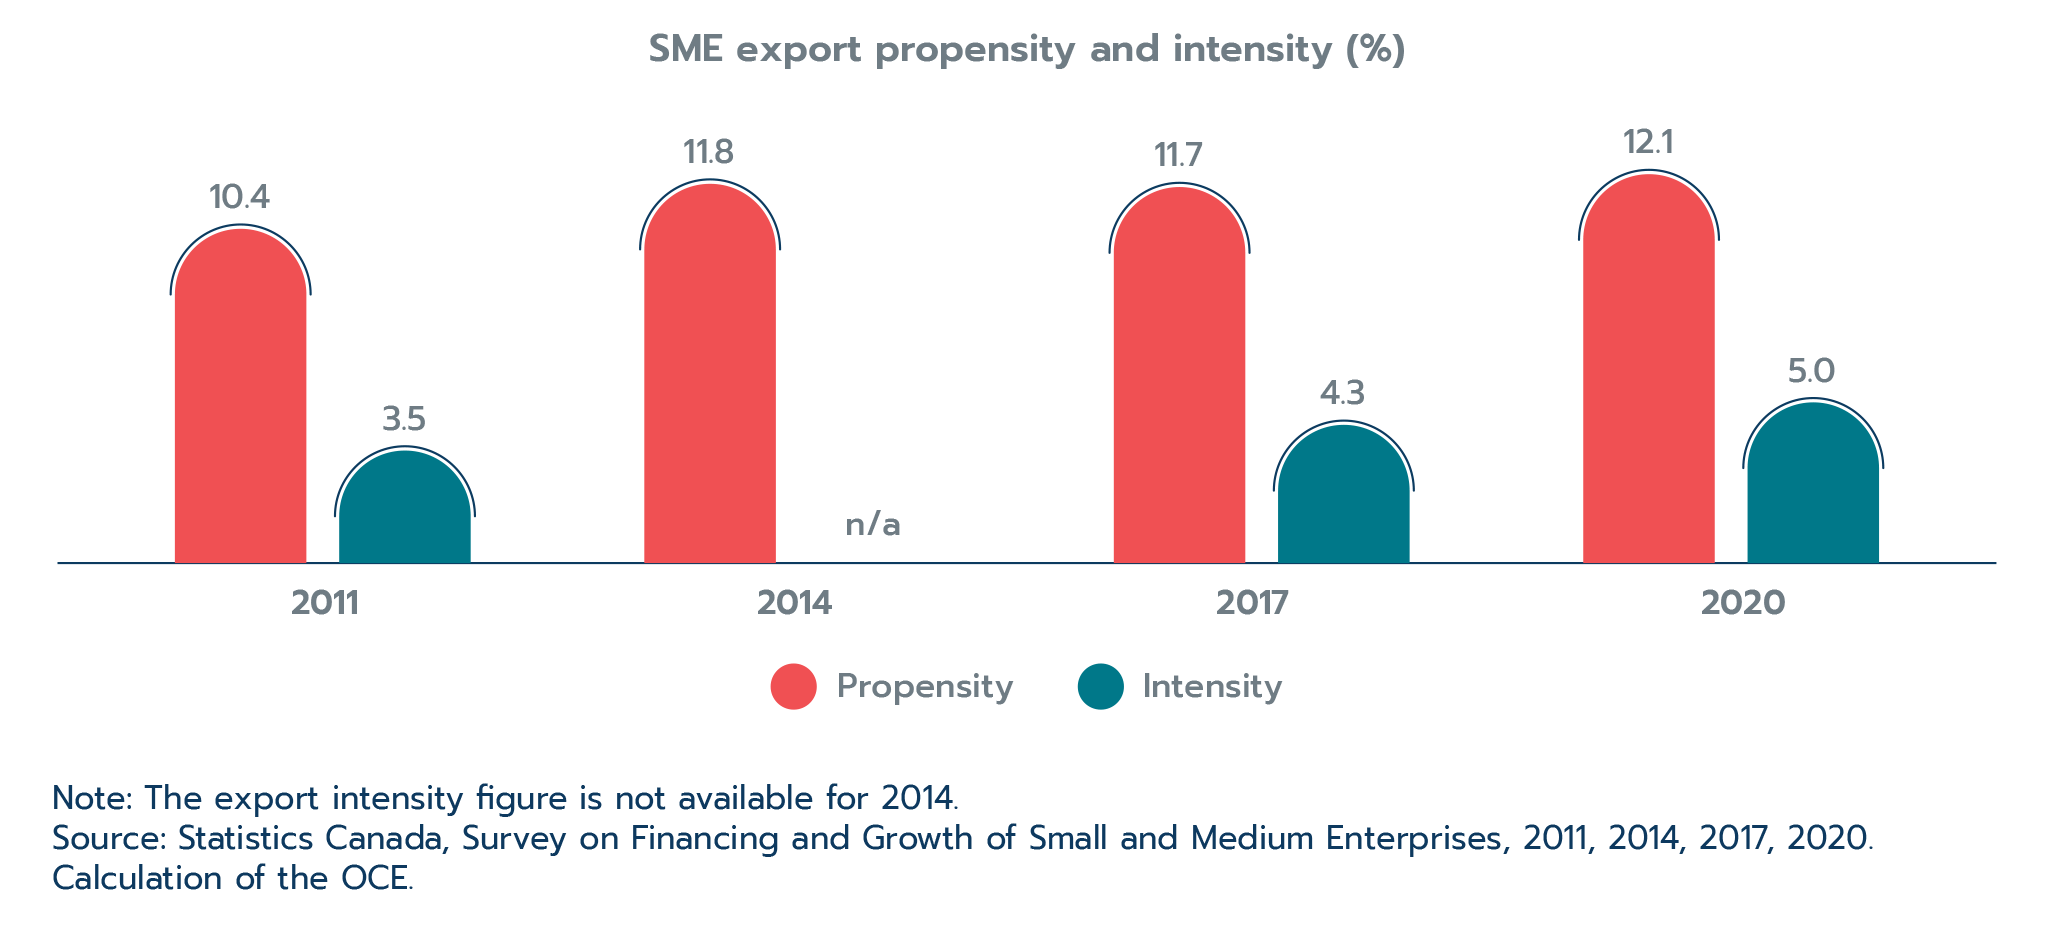
Text version
SME export propensity and intensity (%)
| Propensity | Intensity | |
|---|---|---|
| 2011 | 10.4 | 3.5 |
| 2014 | 11.8 | n/a |
| 2017 | 11.7 | 4.3 |
| 2020 | 12.1 | 5.0 |
Note: The export intensity figure is not available for 2014.
Source: Statistics Canada, Survey on Financing and Growth of Small and Medium Enterprises, 2011, 2014, 2017, 2020. Calculation of the OCE.
E-commerce is helping to facilitate export activity
Facilitating this shift is a massive and rapid adoption of e-commerce, which accelerated during the pandemic. In 2021, 33% of Canadian firms made sales of goods or services over the internet—three times the rate in 2012 when only 11% of firms made online sales (Statistics Canada's Survey of Digital Technology and Internet Use).
The second notable shift during this period is that the use of online sales by smaller firms grew considerably. In 2012, larger firms were much more likely to conduct online sales; but by 2021, smaller firms had increased their use of online sales substantially, almost catching up with larger firms (Figure 2.5). With the gap in e-commerce participation between large and small firms narrowing over time in Canada, the rise of e-commerce and social media have been vital tools for smaller businesses to participate in exporting.
Figure 2.5: Growth in online sale activity by firm size
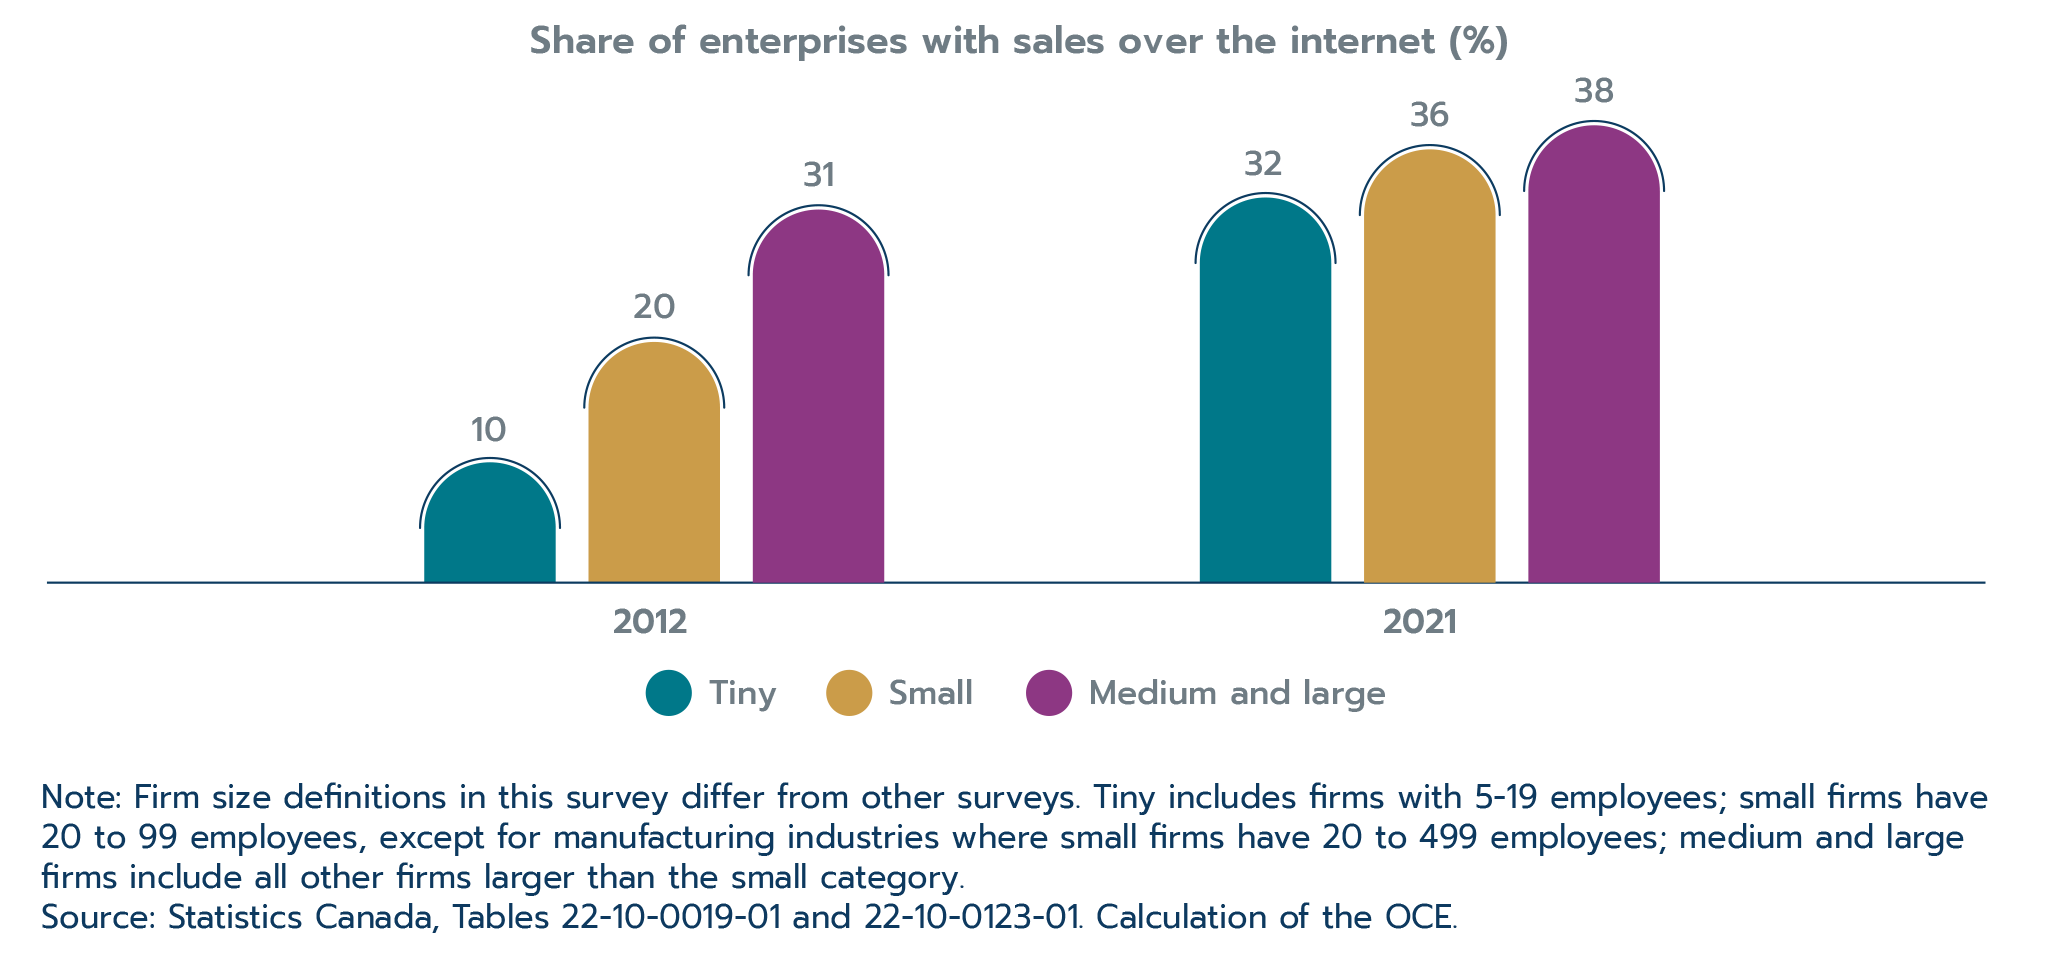
Text version
Share of enterprises with sales over the internet (%)
| 2012 | 2021 | |
|---|---|---|
| Tiny | 10 | 32 |
| Small | 20 | 36 |
| Medium and large | 31 | 38 |
Note: Firm size definitions in this survey differ from other surveys. Tiny includes firms with 5-19 employees; small firms have 20 to 99 employees, except for manufacturing industries where small firms have 20 to 499 employees; medium and large firms include all other firms larger than the small category.
Source: Statistics Canada, Tables 22-10-0019-01 and 22-10-0123-01. Calculation of the OCE.
E-commerce is being recognized as an important tool to facilitate trade around the world. In a summary of findings from a survey administered in 42 countries including Canada, the Organization for Economic Co-operation and Development (OECD) concluded that, “firms using online tools are more likely to export, export to more countries and obtain larger shares of turnover [value] from exports” (OECD, 2019). More recent empirical analysis shows that growing digital connectivity increases both domestic and international trade (OECD, 2023). In 2020, exporting SMEs in Canada were more than twice as likely to have an e-commerce platform on their website (21.5%) as non-exporters (9.4%) (Statistics Canada, 2022).
Box 2.2: Definition of small and medium enterprises and data sources
The definition of SMEs varies from one source to another. In Canada, SMEs generally include firms with 1-499 employees. Firms with 500 or more employees are considered large, and firms with no employees (e.g. solo entrepreneurs) are not included as SMEs. Unless otherwise specified, these are the definitions used throughout the State of Trade 2023 report.
Some surveys add additional criteria. Notably, this report uses a lot of data from the Survey on Financing and Growth of Small and Medium Enterprises. Not only does this survey include only firms with 1-499 employees, but it applies an additional criterion that firms must have gross revenues of $30,000 or more to be included/captured (Statistics Canada, 2021b).
This survey also excludes several industries, such as utilities, finance and insurance, management of companies, education, health, commercial machinery rental, and others; many of these industries are not very export-intensive. The survey has a large reach, covering almost 10,000 SMEs, and is conducted every three years by Statistics Canada.
Other surveys and databases have different definitions of SMEs. For example, Statistics Canada’s administrative database of goods exporters (i.e. Trade in goods by exporter characteristics, or TEC for short) includes firms with no employees in its definition of SMEs.
Internationally, the definition can also vary. For example, the European Commission defines SMEs as firms with less than 250 employees, while the Organization for Economic Co-operation and Development (OECD) applies a ceiling of 300 employees (European Commission, 2021).
In this report, the terms “majority-owned” and “owned” are used interchangeably and refer to SME ownerships of 51% or higher.
A shift towards more services exports
Beneath the surface, there has been a shift in the nature of trade over the last decade, with services becoming more prominent. In 2020, 7.5% of SMEs exported services compared to just 5.3% in 2011. Meanwhile the share of SMEs that exported goods barely changed (6.4% of SMEs in 2011 and 6.7% in 2020).
Smaller businesses are more likely to export services than larger SMEs. In 2020, 71% of exporting micro businesses (1-4 employees) exported services compared to only 43% of medium-sized exporters (100-499 employees) (Figure 2.6). The reason for this is uncertain—goods exporters’ production may be more conducive to scaling up with the right investments (either as a result of, or as a precursor to, trade), whereas services can be more knowledge-intensive, making use of business models that require just a few skilled employees to expand into international markets.
Figure 2.6: Smaller SMEs export more services
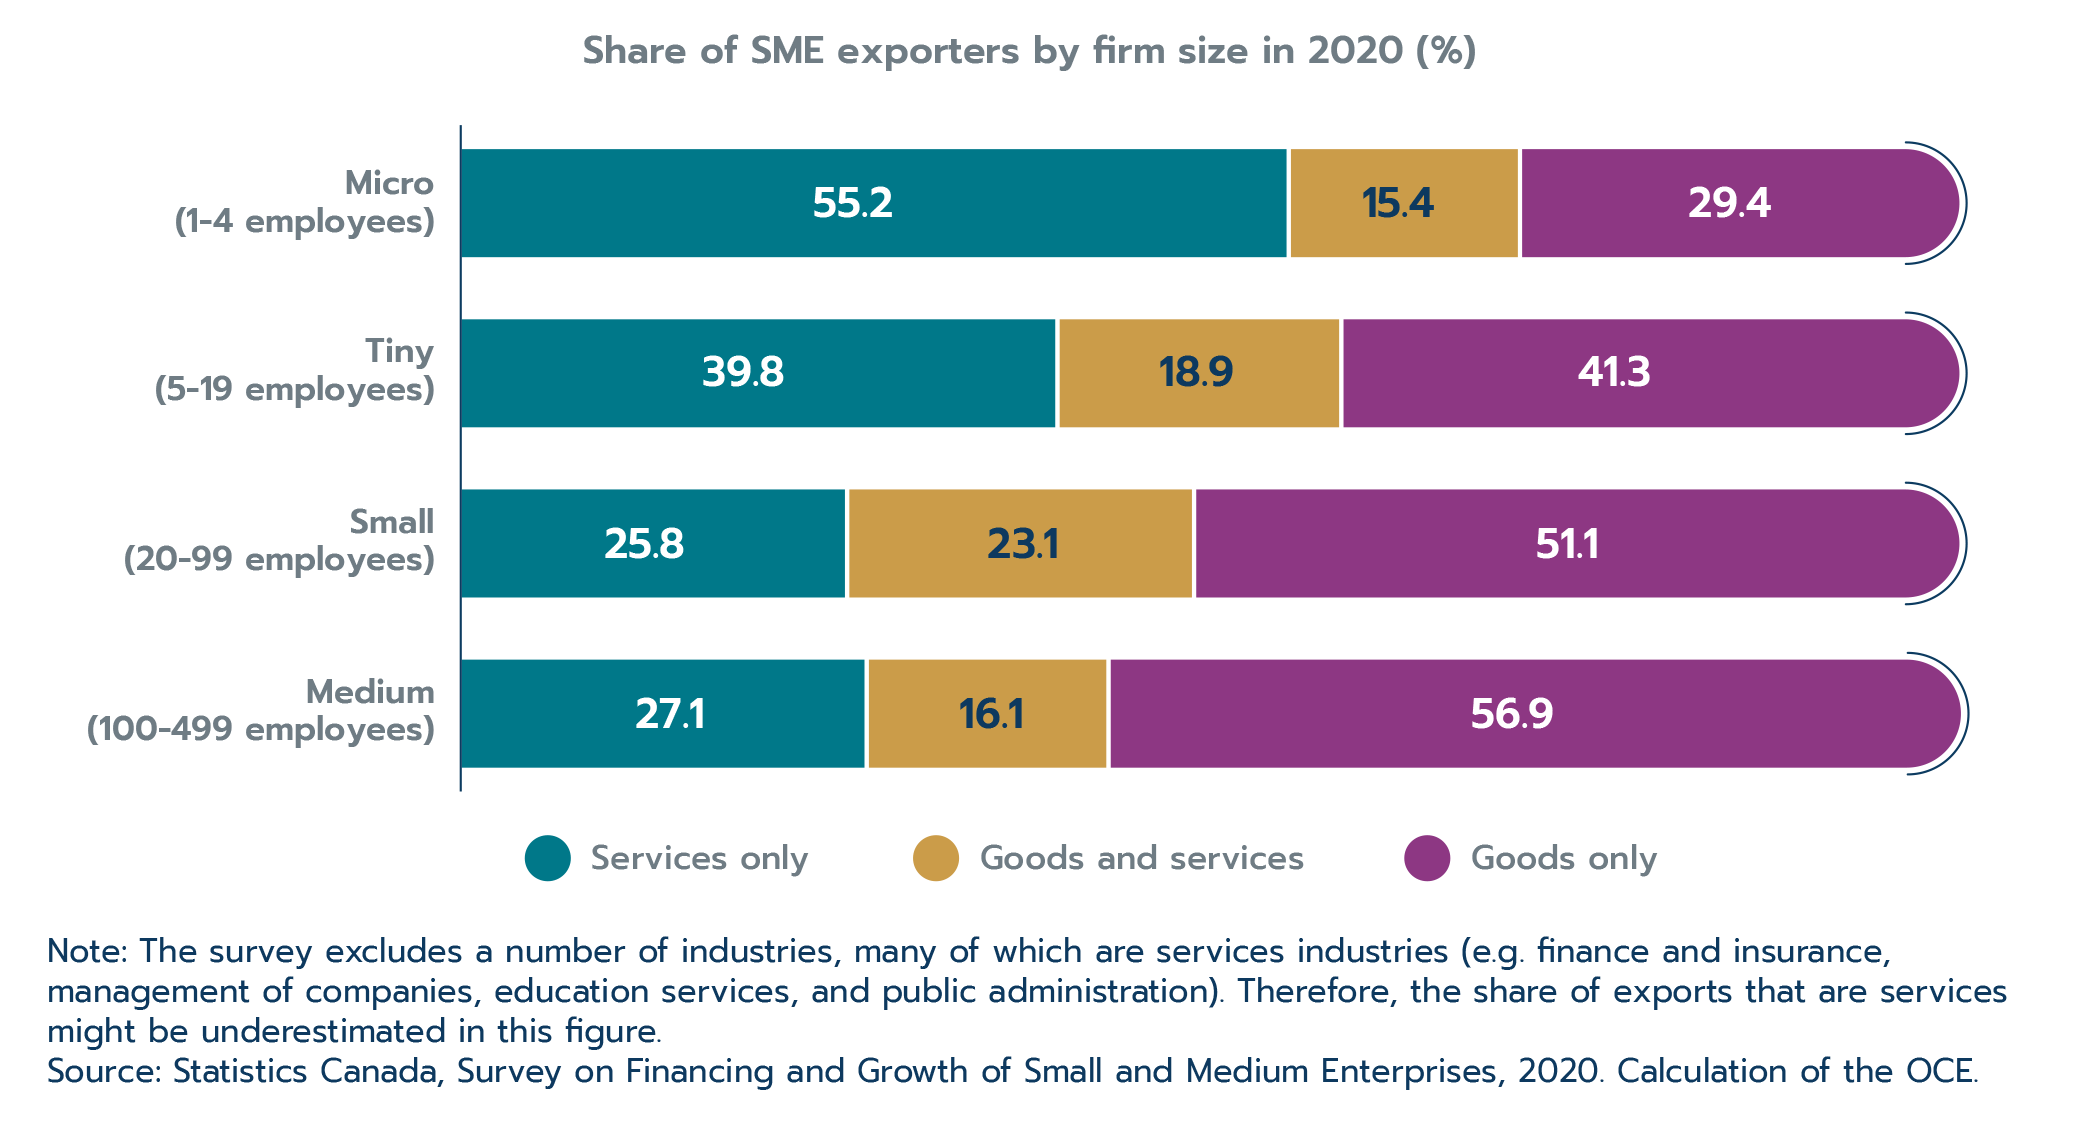
Text version
Share of SME exporters by firm size in 2020 (%)
| Services only | Goods and services | Goods only | |
|---|---|---|---|
| Micro (1-4 employees) | 55.2 | 15.4 | 29.4 |
| Tiny (5-19 employees) | 39.8 | 18.9 | 41.3 |
| Small (20-99 employees) | 25.8 | 23.1 | 51.1 |
| Medium (100-499 employees) | 27.1 | 16.1 | 56.9 |
Note: The survey excludes a number of industries, many of which are services industries (e.g. finance and insurance, management of companies, education services, and public administration). Therefore, the share of exports that are services might be underestimated in this figure.
Source: Statistics Canada, Survey on Financing and Growth of Small and Medium Enterprises, 2020. Calculation of the OCE.
The United States remains the market of focus
One feature of SMEs’ exporting experiences that has not changed is their hyper-focus on U.S. markets. In 2020, 84% of SME exporters named the U.S. as one of their destination markets; this share has barely changed over the last decade (89% of SMEs exported to the U.S. in 2011).
Most SME exporters are focused only on the U.S.; given its large size, close proximity, language and culture similarity, it is only natural that Canadian SMEs would be drawn to that market. In 2022, 65% of SME goods exporters exported only to the U.S., while 19% exported to that market and other countries. This is in contrast to large firms: 46% export only to the U.S and about half (51%) export to both the U.S. and other countries (Figure 2.7).
It is worth noting that our research has shown that the U.S. is often the first export market, where firms learn the ropes and work out challenges before going further afield (Yu, 2019), making it an important market for future diversification as well.
Figure 2.7: Goods exporters are focused on U.S. markets (% share of exporters in 2022)
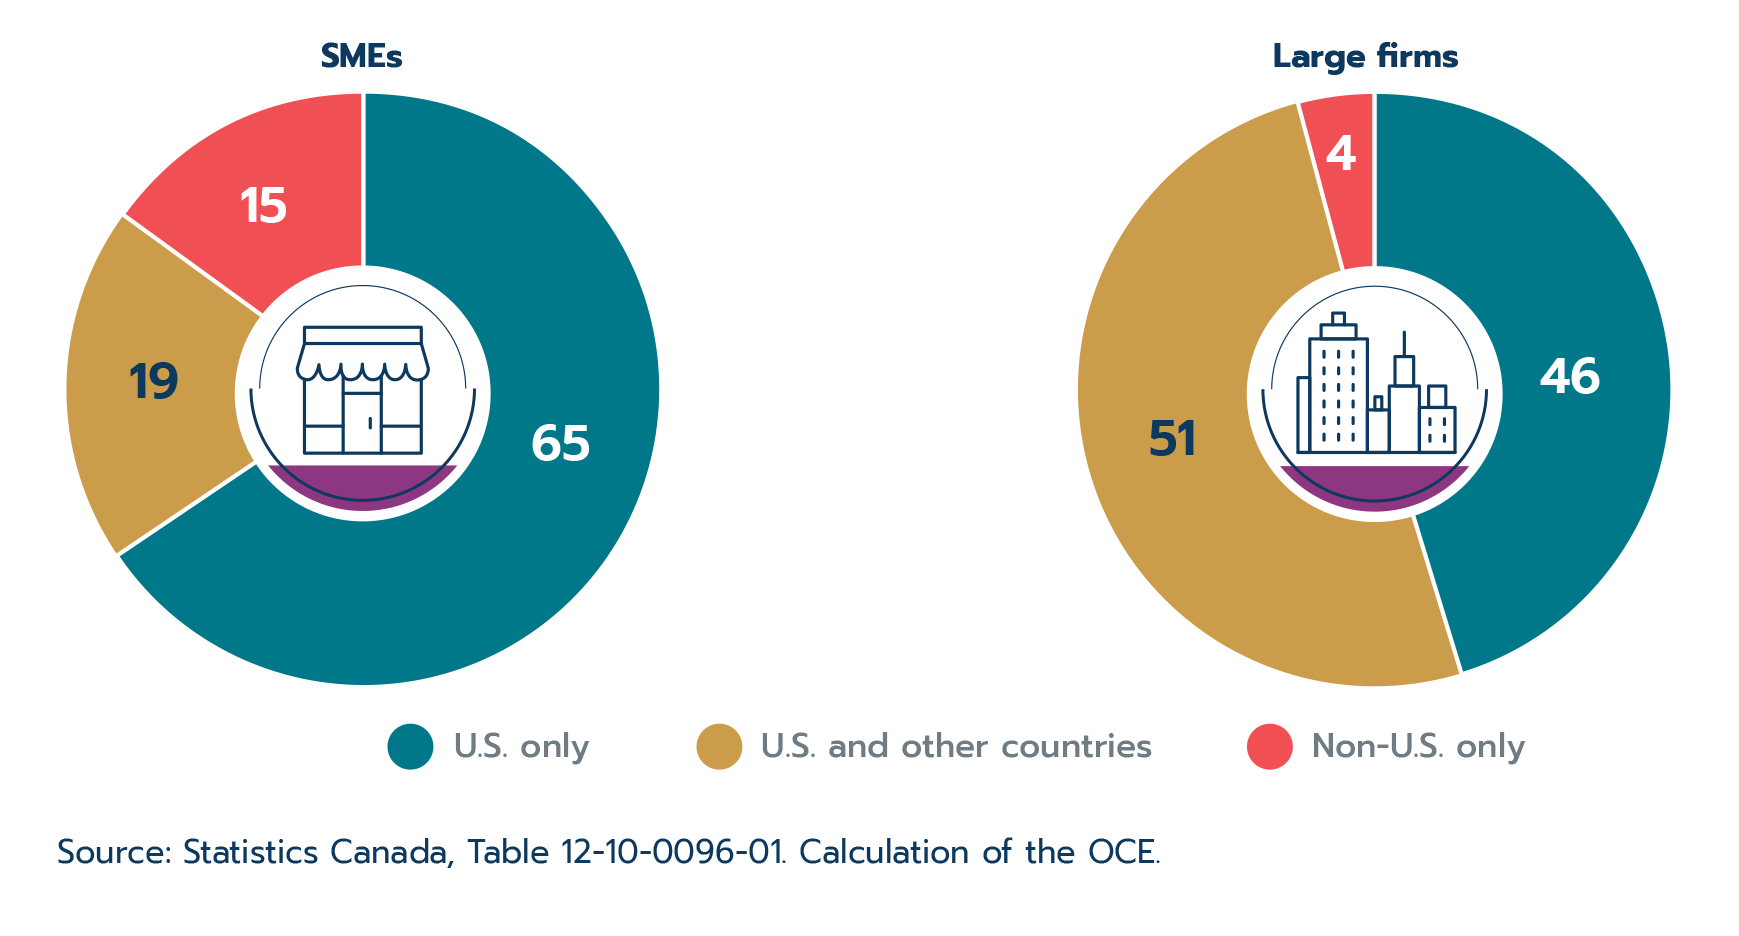
Text version
Goods exporters are focused on U.S. markets (% share of exporters in 2022)
| SMEs | Large firms | |
|---|---|---|
| U.S. only | 65 | 46 |
| U.S. and other countries | 19 | 51 |
| Non-U.S. only | 15 | 4 |
Source: Statistics Canada, Table 12-10-0096-01. Calculation of the OCE.
Canada’s large immigrant population also brings important links to economies globally. Following pioneering work by Gould (1994) and Head and Ries (1998), several studies have established a causal link between immigration and international trade, as immigrants are able to leverage their cultural, linguistic knowledge and professional networks to establish commercial connections between Canada and their home country.
Box 2.3: Immigrants are strengthening Canada’s commercial links around the globe
Canada’s large and diverse immigrant population brings with them global connections to countries around the world, making them key to Canada’s export diversification success.
The Office of the Chief Economist published a study that quantifies the contribution of immigrant-led businesses to Canada’s export performance (Blanchet, 2021). The analysis confirmed that immigrant-led SMEs were more likely to export than SMEs led by non-immigrants. Furthermore, they tended to export to more diverse markets, and relied less on the U.S. The study also found that businesses led by immigrants, despite being smaller on average, were much more likely to export in general, and they derived a greater share of revenues from exporting.
More recent data demonstrates that immigrant-led SMEs continued to solidify their export-focus; in 2020, the share of immigrant-led SMEs that exported was 15.9%, up from 14.3% in 2017 (Figure 2.8). Immigrants exported at a rate that was 5.3 percentage points higher than Canadian-born led SMEs in 2020—this difference widened from 3.5 percentage points in 2017.
Figure 2.8: Immigrant-led SMEs export at higher rates
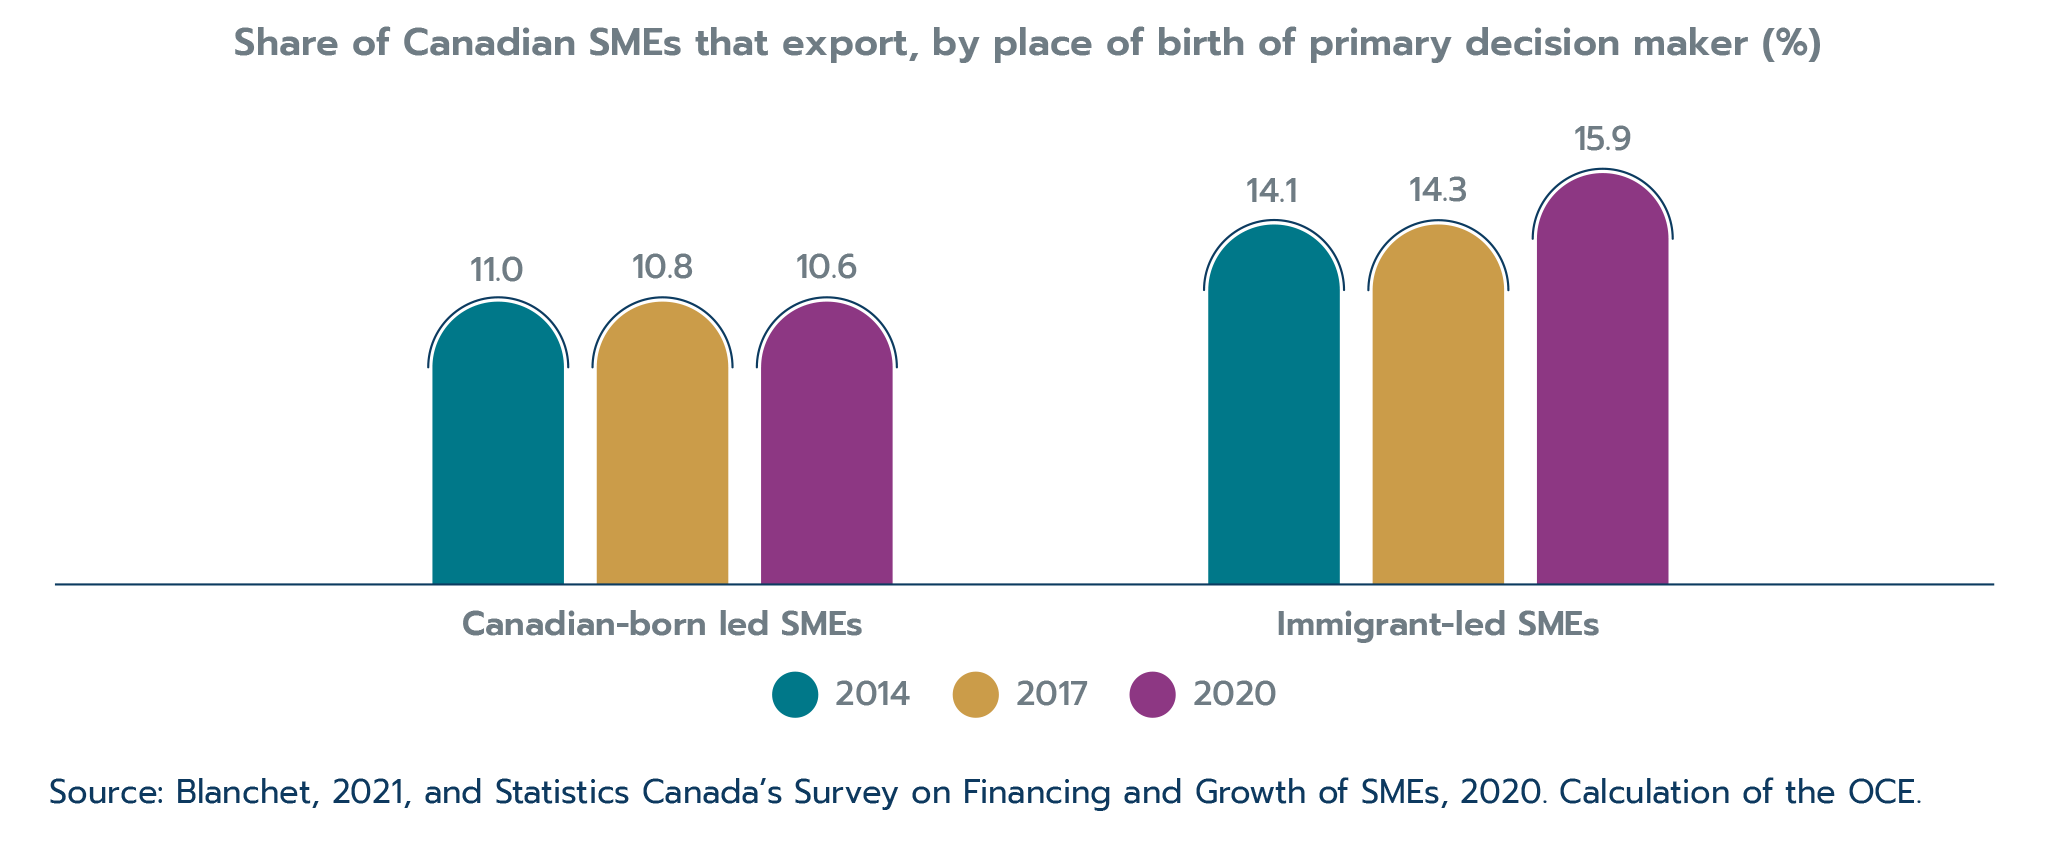
Text version
Share of Canadian SMEs that export, by place of birth of primary decision maker (%)
| 2014 | 2017 | 2020 | |
|---|---|---|---|
| Immigrant-led SMEs | 14.1 | 14.3 | 15.9 |
| Canadian-born led SMEs | 11.0 | 10.8 | 10.6 |
Source: Blanchet, 2021, and Statistics Canada’s Survey on Financing and Growth of SMEs, 2020. Calculation of the OCE.
Not only are immigrant-led businesses more likely to export, but they are also more active in creating new businesses. In 2020, 11.2% of immigrant-led SMEs were start-ups (i.e. less than 2 years old) compared to only 6.1% of Canadian-born led SMEs. This is great news for Canada’s continued diversification and future export activity overall.
Immigrants punched above their weight in the entrepreneurship space, accounting for 23.0% of the Canadian population in the 2021 census compared to 28.7% of Canada’s SME leaders in 2020 (which was the highest representation yet). While this is positive news in many ways, earlier research has shown that higher entrepreneurship rates among immigrants are often caused—at least in part—by difficulties in finding suitable paid employment (Statistics Canada, 2021a). Therefore, more work needs to be done to ensure that immigrants can access the full spectrum of economic opportunities in Canada.
Immigrants are key to Canada’s export diversification efforts. In 2020, immigrant-led SMEs were much more likely to export to diverse markets (i.e. those outside of the U.S.) than SMEs led by Canadian-born entrepreneurs (Figure 2.9). While the U.S. remains the most popular market for both immigrant-led SMEs (76.1%) and SMEs led by Canadian-born (88.2%), immigrant-led SMEs were more likely to export to other markets.
The most significant differences in the rates of export for immigrant-led SMEs was to Asian destinations. China topped the list with 16.5% of immigrant-led SME exporters choosing that destination compared to only 8.8% of Canadian-born exporters. led SME exporters. India was also another notable destination with vastly different export rates: 6.9% of immigrant exporters compared to 2.6% of Canadian born exporters.
Figure 2.9: Immigrant-led SMEs export to more diverse markets

Text version
Share of SMEs that export to select destinations, 2020 (%)
| Country | Canadian-born led SMEs | Immigrant-led SMEs |
|---|---|---|
| United States | 88 | 76 |
| Europe (excl. U.K.) | 19 | 21 |
| China | 9 | 17 |
| Asia (excl. China, India and Japan) | 7 | 14 |
| United Kingdom | 16 | 13 |
| Mexico | 6 | 8 |
| Latin America (excl. Mexico and Brazil) | 7 | 7 |
| India | 3 | 7 |
| Japan | 5 | 6 |
| Brazil | 2 | 2 |
| Other | 19 | 20 |
Source: Statistics Canada’s Survey on Financing and Growth of SMEs, 2020. Calculation of the OCE.
Exporting challenges and support for overcoming them
The costs and risks that come with exporting can be more challenging to bear for smaller or less productive firms than larger firms, which explains in large part why SMEs are less likely to export than larger firms. Even among exporters, challenges can have an outsized impact on smaller firms.
SME exporters named logistical (31.6%) and border obstacles (31.2%) as the top challenges affecting their ability to export in the 2020 iteration of the Survey on Financing and Growth of Small and Medium Enterprises (Figure 2.10). Navigating logistics and border requirements commands resources, know-how, and upfront costs. Often, organizing and troubleshooting these aspects can take up a lot of management’s time.
SMEs exporting goods are particularly susceptible to those obstacles, as such exports can involve more complex logistical planning and customs requirements. While the pandemic no doubt increased many exporting challenges, border and logistical obstacles were also the top 2 challenges identified by exporters in the previous iteration of the survey in 2017 as well.
The costs and risks of exporting were also reflected in the high proportion of SME exporters that named financial risk (23.4%) and lack of financing/inadequate cash flow (20.9%) as other top issues in 2020. These challenges were heightened during the pandemic as many business operations were halted or otherwise disrupted.
Figure 2.10: Exporting challenges reported by SME exporters
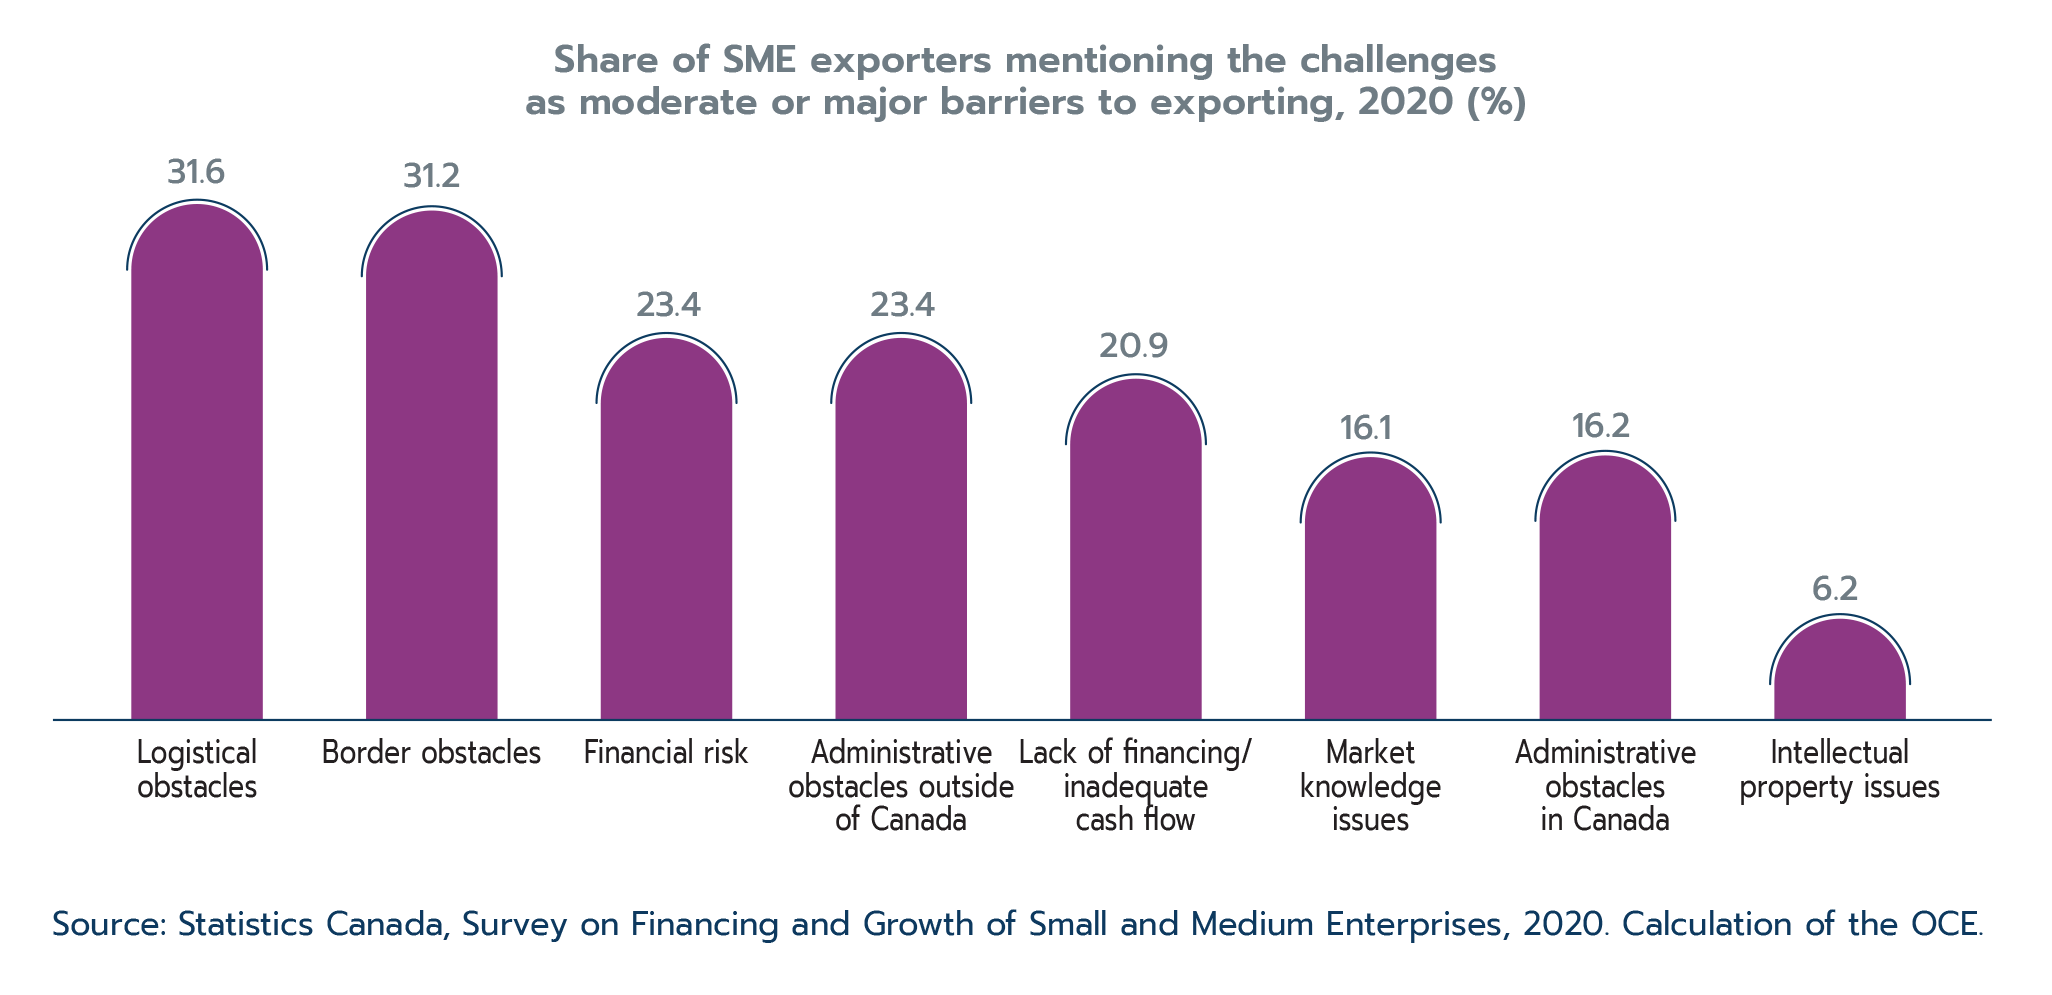
Text version
| Obstacle | Share of SME exporters mentioning the challenges as moderate or major barriers to exporting, 2020 (%) |
|---|---|
| Logistical obstacles | 31.6 |
| Border obstacles | 31.2 |
| Financial risk | 23.4 |
| Administrative obstacles outside of Canada | 23.4 |
| Lack of financing/ inadequate cash flow | 20.9 |
| Market knowledge issues | 16.1 |
| Administrative obstacles in Canada | 16.2 |
| Intellectual property issues | 6.2 |
Source: Statistics Canada, Survey on Financing and Growth of Small and Medium Enterprises, 2020. Calculation of the OCE.
Impact of COVID-19 on SME exporters
The COVID-19 global pandemic had a severe and lasting impact on businesses small and large in Canada, and exacerbated challenges for exporters. As public health restrictions limited face-to-face interactions and the movement of people across borders was severely restricted in the early months of the pandemic, the number of exporters declined sharply.
Research by the Office of the Chief Economist on goods exporters found that smaller exporters (0-99 employees) were the most affected of all enterprise size groupings (Tran, 2021). The number of small goods exporters fell more than 17% during the first wave of the pandemic, compared to a 4.5% drop for medium firms and an 8.7% decline for large firms. This gap persisted throughout 2020, and in December the number of small goods exporters was lagging behind the most with 7.6% fewer exporters compared to pre-pandemic levels, while the gap had closed for medium firms and had narrowed to 4.1% for large firms (Table 2.1). The greater loss in the number of small exporters is of concern, as export mobilization of SMEs is an important goal of inclusive trade.
Table 2.1: Monthly average number of exporters in 2020 by size
(% change vs. pre-pandemic level)
| First wave (March-May 2020) | Re-opening (June-August 2020) | Second wave (September-December 2020) | |
|---|---|---|---|
| Small | -17.0 | -11.0 | -7.6 |
| Medium | -4.5 | -1.4 | -0.3 |
| Large | -8.7 | -5.3 | -4.1 |
Source: Tran, 2021.
Thankfully, this situation appears to have improved over 2021 and maintained strength in 2022. The number of SMEs that export goods and the value of their exports both rose significantly in 2021, adding more than 4,000 net new SME exporters (Figure 2.11).
While the value of goods exports by SMEs had another strong year in 2022 (growing 25.7%), the number of SME goods exporters did not experience the same surge. The smaller growth in the number of exporters relative to the export value is in-line with the fact that much of 2022’s export growth was driven by an increase in prices and not volumes. Still, the year brought almost 300 net new SME goods exporters, bringing the total to 46,840.
Figure 2.11: Canada’s SME goods exporters recover post-pandemic
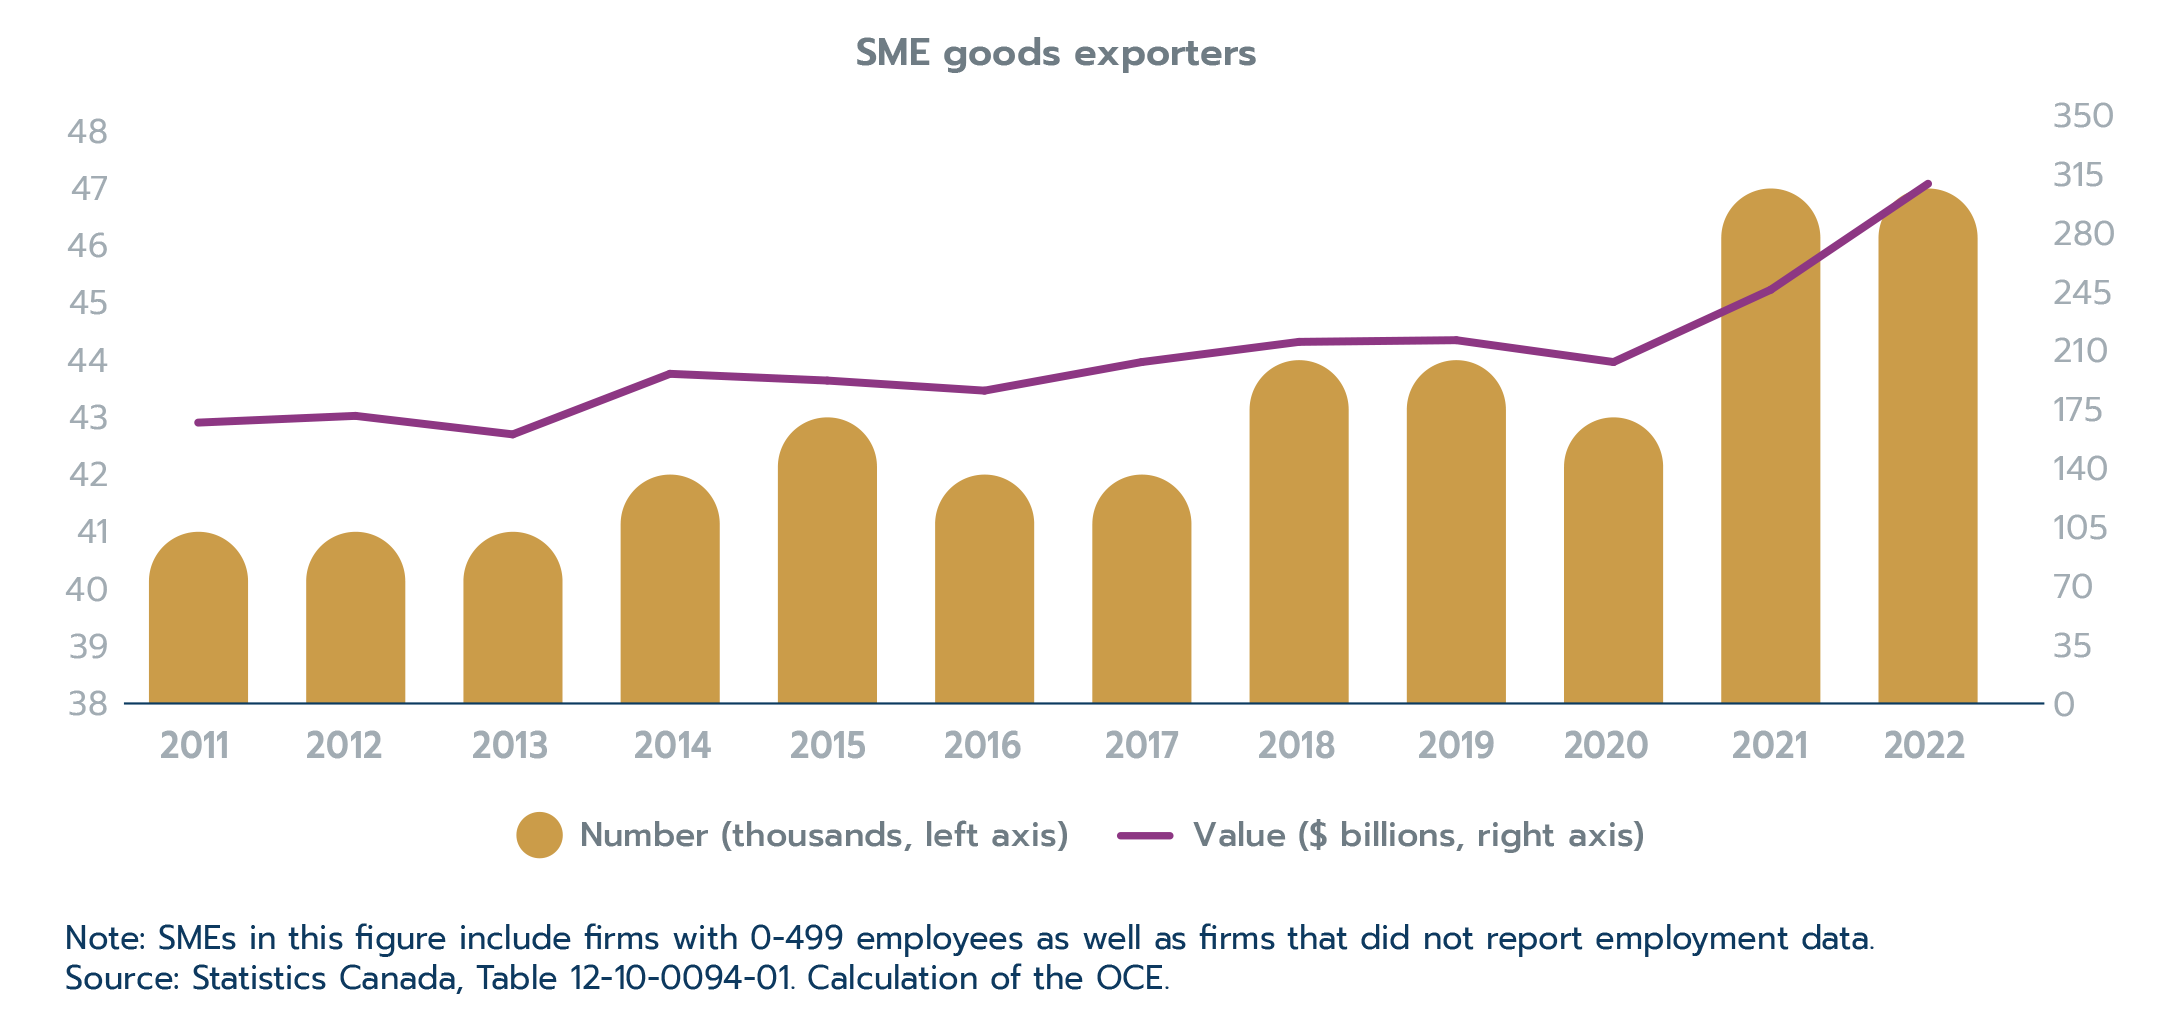
Text version
SME goods exporters
| Year | Number (thousands, left axis) | Value ($ billions, right axis) |
|---|---|---|
| 2011 | 41 | 167 |
| 2012 | 41 | 171 |
| 2013 | 41 | 160 |
| 2014 | 42 | 196 |
| 2015 | 43 | 192 |
| 2016 | 42 | 186 |
| 2017 | 42 | 203 |
| 2018 | 44 | 215 |
| 2019 | 44 | 216 |
| 2020 | 43 | 203 |
| 2021 | 47 | 246 |
| 2022 | 47 | 309 |
Note: SMEs in this figure include firms with 0-499 employees as well as firms that did not report employment data.
Source: Statistics Canada, Table 12-10-0094-01. Calculation of the OCE.
Supports for SME exporters
It is important to support SMEs in overcoming barriers to exporting so that the benefits of trade can spread more widely to this important economic segment. Recognizing this, the Government of Canada uses several mechanisms to support SMEs, including trade policies, trade promotion programs, and financing supports.
Canada’s trade policy approaches that help SMEs overcome these barriers include standalone chapters in free trade agreements (FTAs) and mainstreaming SME issues throughout FTAs. These can include supporting access to government procurement for SMEs, simplified rules of origin procedures, improved trade facilitation measures, intellectual property and investment protections, e-commerce, and good regulatory practices that take into account the impact on SMEs.
Canada has several FTAs with dedicated chapters dealing with SMEs. The first one was incorporated into the Comprehensive and Progressive Agreement for Trans-Pacific Partnership (CPTPP), which entered into force in 2018. Since then, there have been standalone SME chapters added to the modernized Canada-Israel FTA (2019) and the Canada-United States-Mexico Agreement (CUSMA), which came into force in 2020.
The Government of Canada also supports SMEs in overcoming barriers through its trade promotion programs, including the Trade Commissioner Service (TCS), and financial supports including through Export Development Canada (EDC). The TCS works largely with SMEs in supporting them on their export journey, and provides a variety of services that help them overcome obstacles and challenges (see Box 2.4).
Box 2.4: Trade Commissioner Service Support for Inclusive Trade
“We recognize that many firms traditionally underrepresented in trade face persistent barriers to exporting. We are proud to offer tailored supports to help them succeed.”
- Sara Wilshaw, Canada’s Chief Trade Commissioner
The Trade Commissioner Service (TCS) provides core services to all Canadian businesses interested in international trade. Recognizing the unique challenges faced by traditionally underrepresented exporters, the TCS offers customized support to these groups. This includes group-specific trade missions to international markets such as the Women’s Trade Mission to the United Kingdom and the business delegations to the Reservation Economic Summit for Indigenous businesses.
Trade Commissioners support Canadian firms every step of the way, from before-travel preparations to business-to-business meetings on arrival in the target market. Business delegations and Minister-led trade missions are powerful ways to learn more about new markets, share best practices and find partnership opportunities.
The TCS also provides training on understanding and leveraging Canada’s free trade agreements, and preparation for market entry through accelerator programs. There is a network of dedicated Champions in TCS Regional Offices across Canada whose role is to provide specific support to underrepresented groups, such as fostering relationships with local stakeholders who support them like business associations.
Working from offices in more than 160 cities around the world, Trade Commissioners help exporters to:
- assess their potential in specific markets
- develop market entry strategies
- find qualified contacts and link them with international opportunities
- resolve export related business problems
Through these free export advisory services, the TCS helps exporters gain knowledge and get practical advice in areas such as navigating business and cultural practices in international markets. The TCS can also provide information about barriers and regulations associated with entering a specific country or region.
Global Affairs Canada also offers funding between $10,000 and $50,000 through the CanExport SME program to help Canadian businesses expand and diversify their exports. This funding covers up to 50% of project costs in all sectors and for all international markets. Project costs can include business travel, market research, participation in trade fairs, marketing tools, and legal and business advice. There is also a “concierge service” that provides enhanced support and guidance to women and Indigenous firms interested in applying for CanExport SME funding.
Whether in Canada or around the world, the TCS is committed to working with inclusive trade groups and with partners, including business associations and chambers of commerce, to find solutions to the export challenges they face.
Financing and risk mitigation are major export barriers for many SMEs. EDC is a crown corporation that provides solutions to help SMEs succeed on global markets in partnership with financial institutions; these solutions can include working capital guarantees, direct lending, investment matching, foreign exchange guarantees, and risk mitigation such as credit insurance (e.g. insurance against non-payment) and performance guarantee insurance.
SMEs benefiting from trade agreements: evidence from CPTPP
The CPTPP is a mega regional trade agreement that involves 12 countries spanning the entire Asia-Pacific region. The CPTPP covers virtually all sectors and aspects of trade in order to eliminate or reduce barriers. It also has several progressive and inclusive elements including environmental protection, labour, and technical cooperation related to SMEs.
Canada was among the first six countries to ratify the CPTPP in late 2018 along with Australia, Japan, Mexico, New Zealand and Singapore. Vietnam (2019), Peru (2021), Malaysia (2022), and Chile (2023) later ratified the agreement; Brunei and the United Kingdom have yet to ratify it.
The CPTPP was the first of Canada’s free trade agreements to incorporate a dedicated chapter on SMEs. The aim was to assist SMEs in taking full advantage of the opportunities created by the agreement.
The Office of the Chief Economist undertook an analysis of Canada’s trade performance under the CPTPP after the first three years of implementation (Office of the Chief Economist, 2023a) with a particular focus on inclusive trade elements, such as the impact of the agreement on SMEs and their workforce, with a gender lens (discussed in Section 2.3).
Using Statistics Canada data on trade by exporter characteristics, the report examines the change in exports of dutiable products for Canadian SMEs exporting to “new CPTPP markets”, defined as the first set of countries to ratify the agreement on or before 2019 (Australia, Japan, New Zealand, Singapore and Vietnam); Mexico also ratified the agreement during that time frame but was excluded from the analysis because it already had an FTA with Canada.
The analysis focused on exports of dutiable products because these products benefited from tariff reductions under the CPTPP. Figure 2.12 provides a breakdown of the change in dutiable exports by SME size in the first year after the CPTPP was implemented.
Figure 2.12: Canada's dutiable goods exports to new CPTPP markets
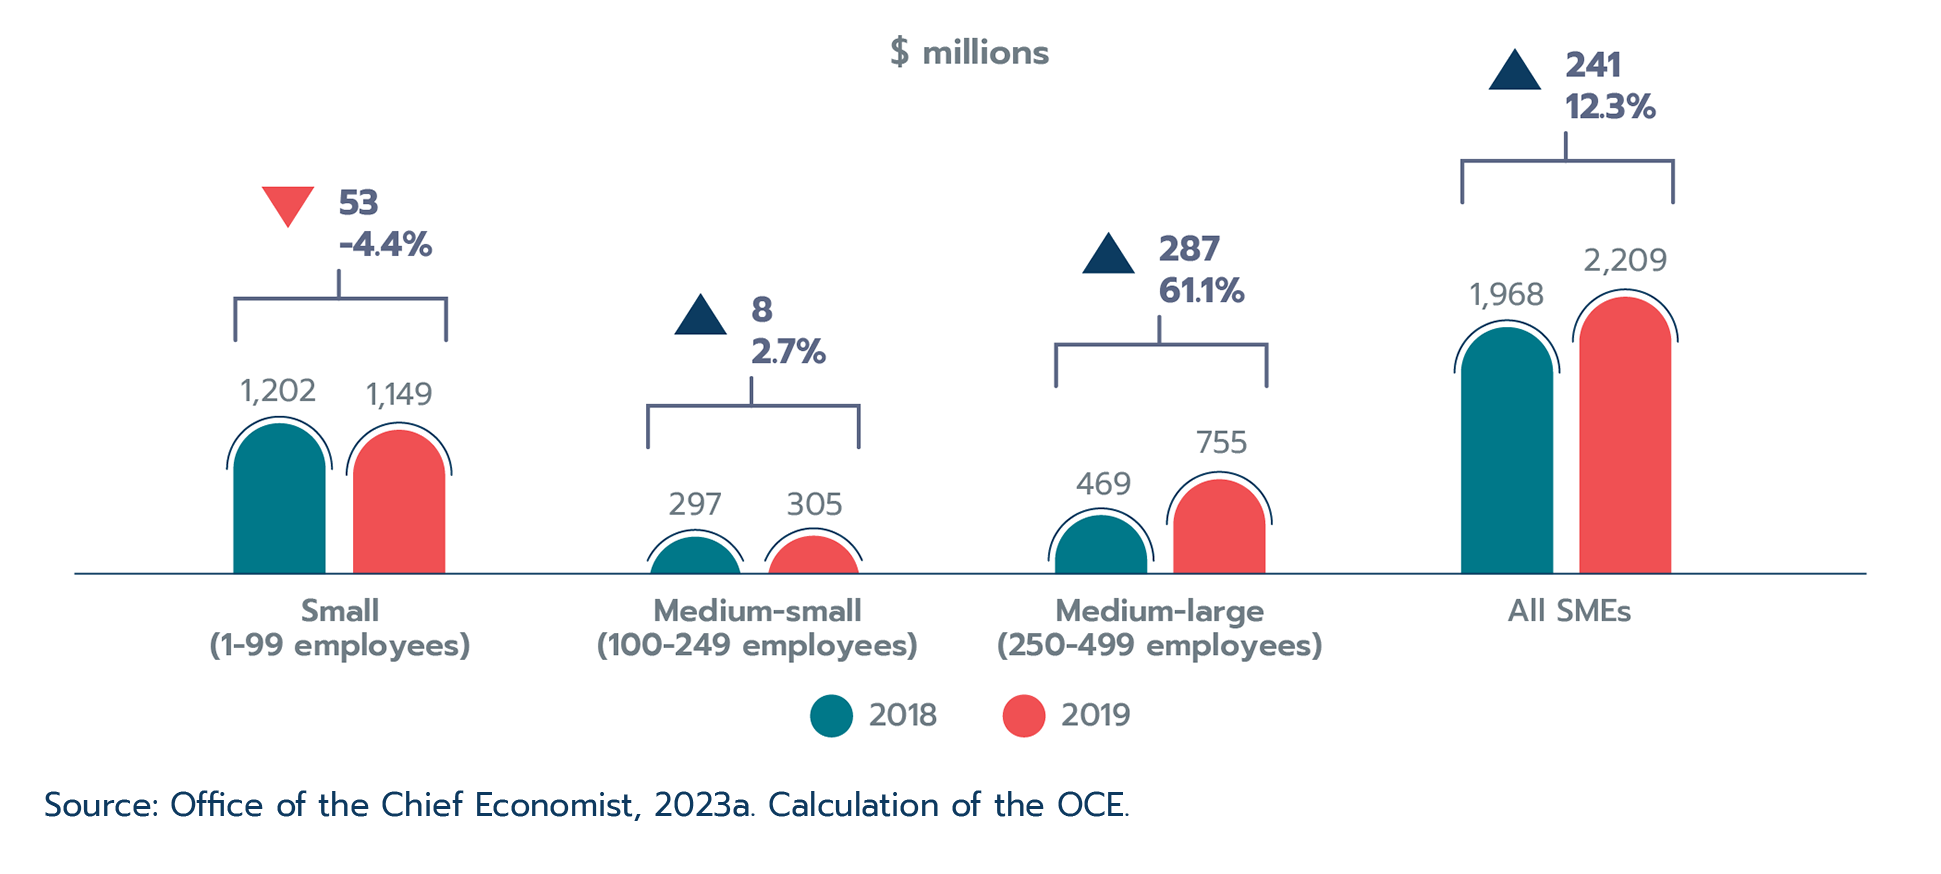
Text version
Canada's dutiable goods exports to new CPTPP markets
| SME size | 2018 $ millions | 2019 $ millions | Growth 2018‒2019, $ millions | Growth 2018‒2019, % |
|---|---|---|---|---|
| Small (1-99 employees) | 1,202 | 1,149 | -53 | -4.4 |
| Medium-small (100-249 employees) | 297 | 305 | 8 | 2.7 |
| Medium-large (250-499 employees) | 469 | 755 | 287 | 61.1 |
| All SMEs | 1,968 | 2,209 | 241 | 12.3 |
Source: Office of the Chief Economist, 2023a. Calculation of the OCE.
The analysis shows that many SMEs saw increases in dutiable trade to the new CPTPP markets, particularly medium-large enterprises (i.e. those with 250-499 employees), which experienced significant goods export growth of over 61% in the first year of implementation of the CPTPP, with large export increases to Australia and, to a lesser extent, Japan.
While medium-small enterprises also experienced a modest rise in exports in the first year, small enterprises witnessed a minor contraction. When considered as a group, SMEs grew their dutiable goods exports to new CPTPP markets by 12.3% in the first year of implementation.
2.3 Trade policy impacts on women in the workforce
Part of Canada’s inclusive approach to trade is to understand trade’s impacts on the workforce with a gender lens. Canada is not alone in this approach. For example, the U.S. has recently adopted a “worker-centric” trade policyFootnote 8, which provides an investigation into the distributional impacts of trade and trade policy on U.S. workersFootnote 9, notably underrepresented groups such as women.
One way to determine how the benefits flowing from trade are shared with women is to ensure that sex-differentiated data is collected and used in the analysis of trade policy, both before the policy is implemented (ex ante analysis) and after the policy has been in place for some time (ex post analysis). This section provides an overview of how Canada’s analysis of trade policy has been revised to better reflect the situation of women in trade, including how females are included in ex ante economic modelling from a theoretical and practical point of view, as well as how the impacts of trade on females are measured ex post through an analysis of SME trade.
Exante modelling of trade and women in the workforce
Economic modelling of trade policy such as new trade agreements is performed using a computable general equilibrium (CGE) model of international trade. CGE models are used by governments around the world for the ex ante analysis of trade agreements (Piermartini et al., 2005). These models are a powerful tool because of the underlying input-output linkages that allow for sectors to respond to changes in trade flows. Not only is the response just between the parties concluding a new trade agreement, the model also allows for non-participating countries to be able to adjust to the new realities.
While CGE models offer numerous advantages for the analysis of trade policy, they also have some drawbacks. One notable drawback is the fact that they typically consider a “long-run” time horizon and, as such, assume that labour markets will be at full employment by the time the trade policy has been implemented. This assumption simplifies the labour market in the model and facilitates the analysis, but it misses an important element of trade policy implementation: the adjustments that an economy must go through while a new agreement is put in place. In the face of new import competition, for example, some industries may have to adapt by changing the size of their workforce. These labour force adjustments are not accounted for in a traditional CGE model, but they are critically important elements to be considered by policy makers. In particular, the process of adjustment to a new trade policy can highlight who gains or loses from trade, and can shed light on specific segments of society, such as female workers.
In order to account for women as workers, the model must first be updated to allow for a more dynamic labour market. This is accomplished in a number of steps:
- First, more detail is added to the model by increasing the granularity of occupations, expanding from two (skilled and unskilled labour) to eight types of occupations, consistent with Statistics Canada’s census data.
- Second, the assumption of full employment is loosened to allow for workers to be unemployed or out of the labour force (NILF).
- Third, transition dynamics between different types of occupations, and from unemployed and NILF categories to the workforce, are used to reflect the reality that it can be challenging to enter the workforce, or to switch occupations. These transition dynamics are further enabled by the introduction of an overlapping generations model, which facilitates movement between occupations by taking into account population aging in labour force characteristics.
These changes combined create a more realistic labour force segment in the model, with additional friction to the movement between jobs that better represent the challenges faced by workers in Canada.
The introduction of sex-disaggregated data in the model follows the adjustments to the new nature of the model’s labour market. Statistics Canada census data is used to populate workers employed in each sector of Canada’s economy, allocated among eight occupations, sex, and age categories. Then, Statistics Canada’s Survey of Labour and Income Dynamics is used to populate the transition dynamics database – that is, data on how Canadian workers change occupations, or move in and out of the labour force, broken down by differences in sex and age categories.
The end result of these adjustments to the Canadian labour market in the model is a more detailed representation of the employment status of Canadians, allowing for an examination of the impact of trade policy on employment by industry, occupation, sex, and age in the short term, as affected industries adjust to the new reality stemming from a trade agreement. Despite these improvements to the model, it is important to note that it remains a simplification of reality, partially for computational reasons but also because of data availability limitations. For example, the model does not account for the fact that changing occupations might compel an individual to move between provinces and that this may be an additional point of friction in the labour market unaccounted for in the model.
However, the addition of detailed Canadian labour market data and transitional labour dynamics based on survey data of real Canadian employees represents a significant step forward in the analysis of trade policy’s impact on labour market outcomes, particularly for females. It is important to note here that this extension of the model at this time does not provide detailed insight into women as consumers, as the model considers household spending at a more aggregate level.
A more detailed Canadian labour market has been incorporated in the CGE model used in trade policy analysis. As an example, it was used in the economic impact assessment of the Canada-United States-Mexico agreement (CUSMA) — an updated version of the North American Free Trade Agreement (NAFTA), to, among other things, determine the labour force impact of CUSMA on males and females (Office of the Chief Economist, 2020). Table 2.2 below shows the potential employment effects by sex and occupation of CUSMA’s implementation (relative to a no-FTA scenario).
Table 2.2: Estimated jobs protected by CUSMA, by occupation and sex
| Occupation | Male | Female | Total |
|---|---|---|---|
| Managerial | 2,902 | 2,798 | 5,699 |
| Professional | -72 | 2,810 | 2,739 |
| Technical | 274 | 1,233 | 1,507 |
| Community and personal services | 302 | 816 | 1,118 |
| Clerical | 29 | 2,564 | 2,593 |
| Sales | 2,455 | 6,303 | 8,758 |
| Machinery operators | 12,021 | 1,967 | 13,988 |
| Manual labourers | 797 | 362 | 1,159 |
| Total | 18,708 | 18,853 | 37,561 |
Source: Office of the Chief Economist, 2020. Calculation of the OCE.
As can be seen, ratifying CUSMA is estimated to have protected 37,561 jobs that could have been lost in the absence of a trade agreement between Canada and the U.S., and these protected jobs were spread about equally between male and female workers. However, the level of detail for the Canadian labour market in the model shows that the industries in which male and female jobs were protected are quite different, reflecting the reality that men and women are employed in a variety of trade-exposed industries and might be affected differently by trade policy.
Estimates from the model show that many male jobs protected by CUSMA are in goods manufacturing industries; for example, machinery operators represented the majority of protected jobs for males and this occupation has a high concentration in goods manufacturing. On the other hand, protected female jobs were more broad-based across a variety of occupations, but most noticeably in sales. This reflects the reality that females in Canada tend to be employed more in services industries that often benefit from trade agreements.
The data from the economic impact assessment of CUSMA does not provide details about the impact of trade policy on employment in specific industries. However, it is important to note that the industry dimension is an important aspect of transition dynamics in the labour market. Trade agreements often reduce barriers for imports, ushering in new competition in the domestic market. For the least productive firms in trade exposed industries, this can result in job displacements for workers. In many manufacturing industries men are affected more than women, except in some industries such as textiles. However, these job movements are often offset by new export opportunities, and the transition dynamics in the model would show how workers, including women, benefit from these new opportunities.
Considered as a whole, ex ante modelling of trade policy often shows that there is a net positive gain for workers, including women, but it is important to keep in mind that beyond the positives, some workers might struggle to find new employment for a variety of reasons, and these workers may feel let down by trade policy. It is thus key for policy makers to be aware of the challenges faced by workers who are going through these transitions.
Expost analysis of trade and women in the workforce
While ex ante analysis attempts to estimate the impact trade policy could have on women before a policy is implemented, ex post analysis seeks to measure the actual impact after the policy is in place. This may be challenging for a number of reasons, including the fact that it can be difficult to identify a direct causal link between new trade policies and outcomes for workers. The reason for this is that many factors could affect employment other than trade policy, so it is difficult to isolate the effects of trade policy.
Despite these challenges, new approaches have been developed to attempt to measure how trade policy affects employment for males and females. One such approach is to use data on Canadian firms that export to countries affected by a new trade policy. Analyzing data on firms that show high export growth to new trading partners after the implementation of a trade agreement will reveal how that has affected their hiring decisions. The expectation would be that firms experiencing the highest growth in exports to new markets would hire more workers, including women.
This approach has recently been applied in an analysis by the Office of the Chief Economist (Office of the Chief Economist, 2023a) of the first three years following the implementation of the Comprehensive and Progressive Agreement for Trans-Pacific Partnership (CPTPP). Statistics Canada data on trade in goods by exporter characteristics shed light on the trade performance of Canadian SME exporters under the CPTPP. The analysis evaluates the degree to which Canadian SME goods exporters, workers, and female employees in particular have benefited from CPTPP tariff reduction commitments, notably for new FTA partners.
In the year before the CPTPP entered into force, around 5,397 Canadian firms were exporting to “new” CPTPP markets (Australia, Japan, New Zealand, Singapore and Vietnam), as previously discussed in Section 2.2, and the total value of these exports was $16.7 billion. In the first year of the agreement, goods exports by SMEs reached $6.4 billion, a 4.1% increase from the previous year. It is important to note that these firms were not necessarily exporting to CPTPP countries exclusively.
Looking at these firms’ employment in Figure 2.13, it can be seen that total employment dropped between 2018 (pre-CPTPP period) and 2019 (post-CPTPP period) However, the employment losses were concentrated in firms that experienced negative export growth over this period. High growth firms (with goods exports gaining 25% or more) were the only group that increased hiring, indicating a correlation between employment growth and CPTPP trade.
Figure 2.13: Employment in firms that exported to new CPTPP markets from 2018 to 2019, by size of export growth
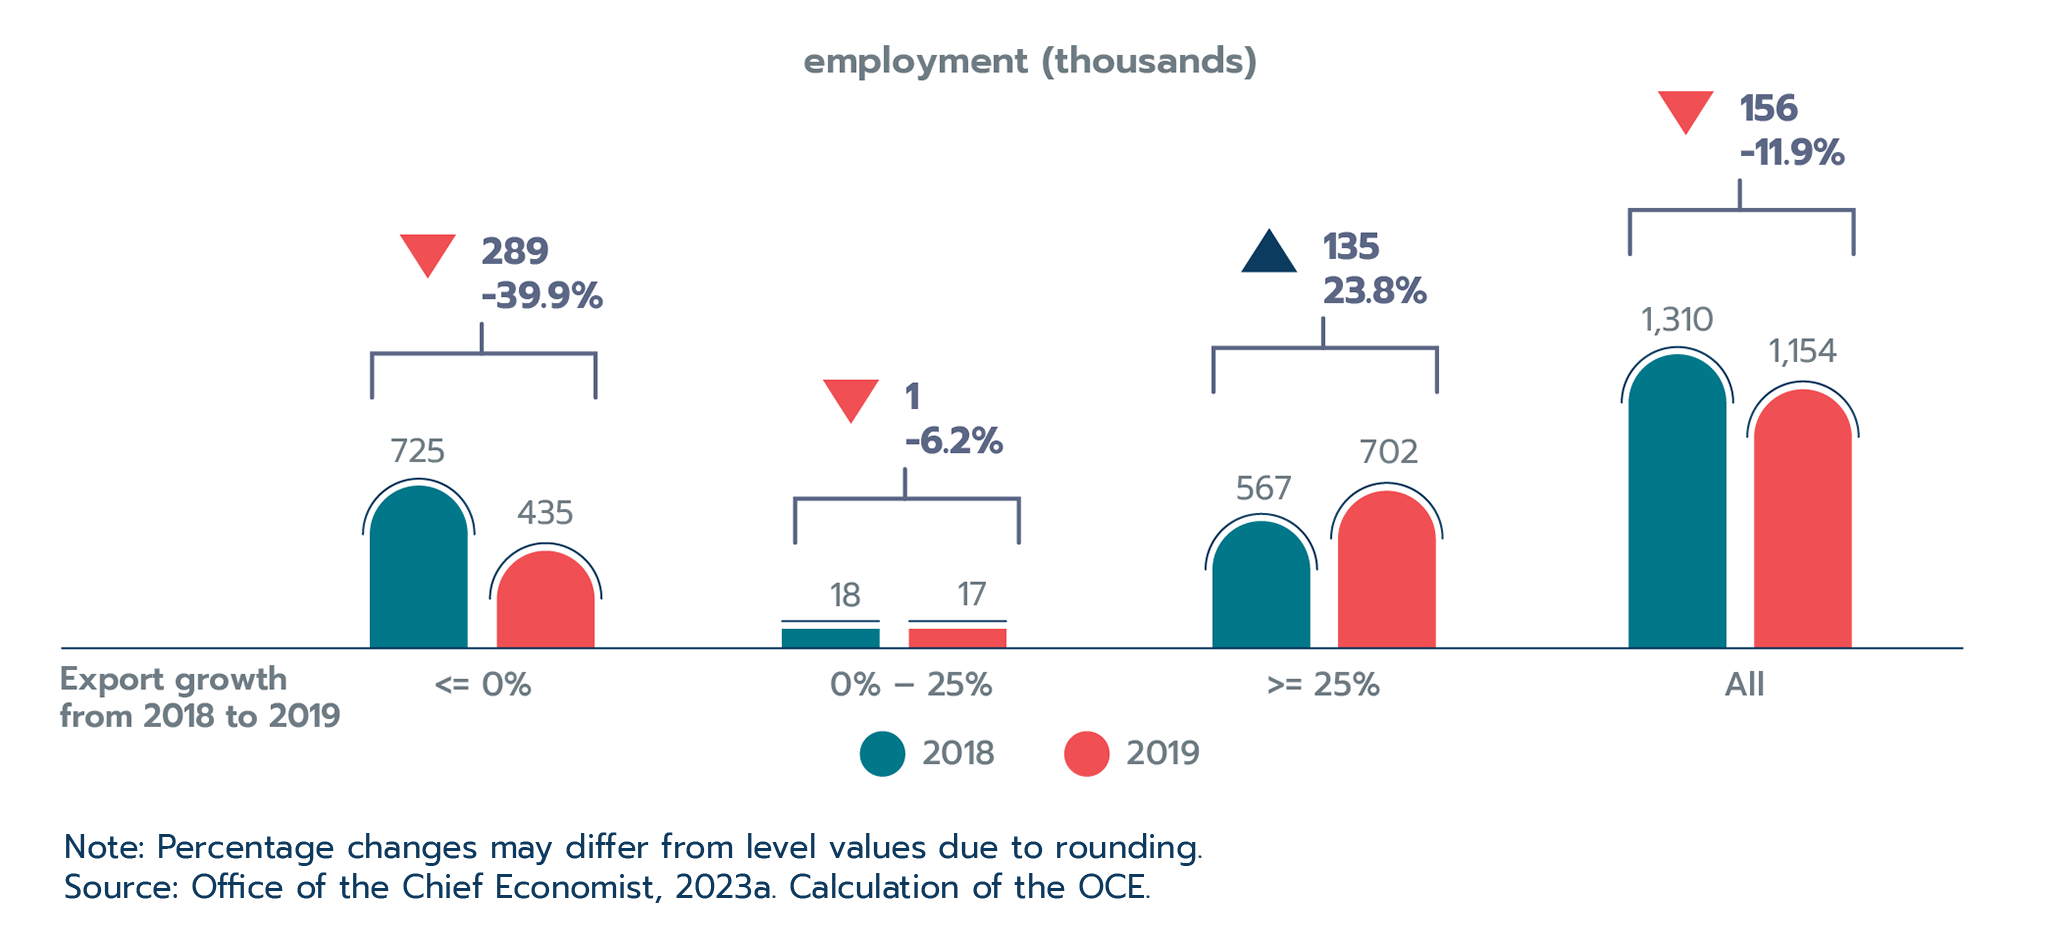
Text version
Employment in firms that exported to new CPTPP markets from 2018 to 2019, by size of export growth
| Export growth from 2018 to 2019 | 2018 (thousands) | 2019 (thousands) | Growth 2018‒2019 (thousands) | Growth 2018‒2019 (%) |
|---|---|---|---|---|
| <= 0% | 725 | 435 | -289 | -39.9 |
| 0% - 25% | 18 | 17 | -1 | -6.2 |
| >= 25% | 567 | 702 | 135 | 23.8 |
| All | 1,310 | 1,154 | -156 | -11.9 |
Note: Percentage changes may differ from level values due to rounding.
Source: Office of the Chief Economist, 2023a. Calculation of the OCE.
With regard to the impact on women, female employment in high-growth firms grew 11.4% during the year following the agreement’s implementation (see Figure 2.14). By contrast, low-growth firms saw their female workforce shrink by 21.0%, while the number of female workers dropped by 33.2% in firms that reported negative export growth from 2018 to 2019.
Figure 2.14: Female employment in firms that exported to new CPTPP markets from 2018 to 2019, by size of export growth
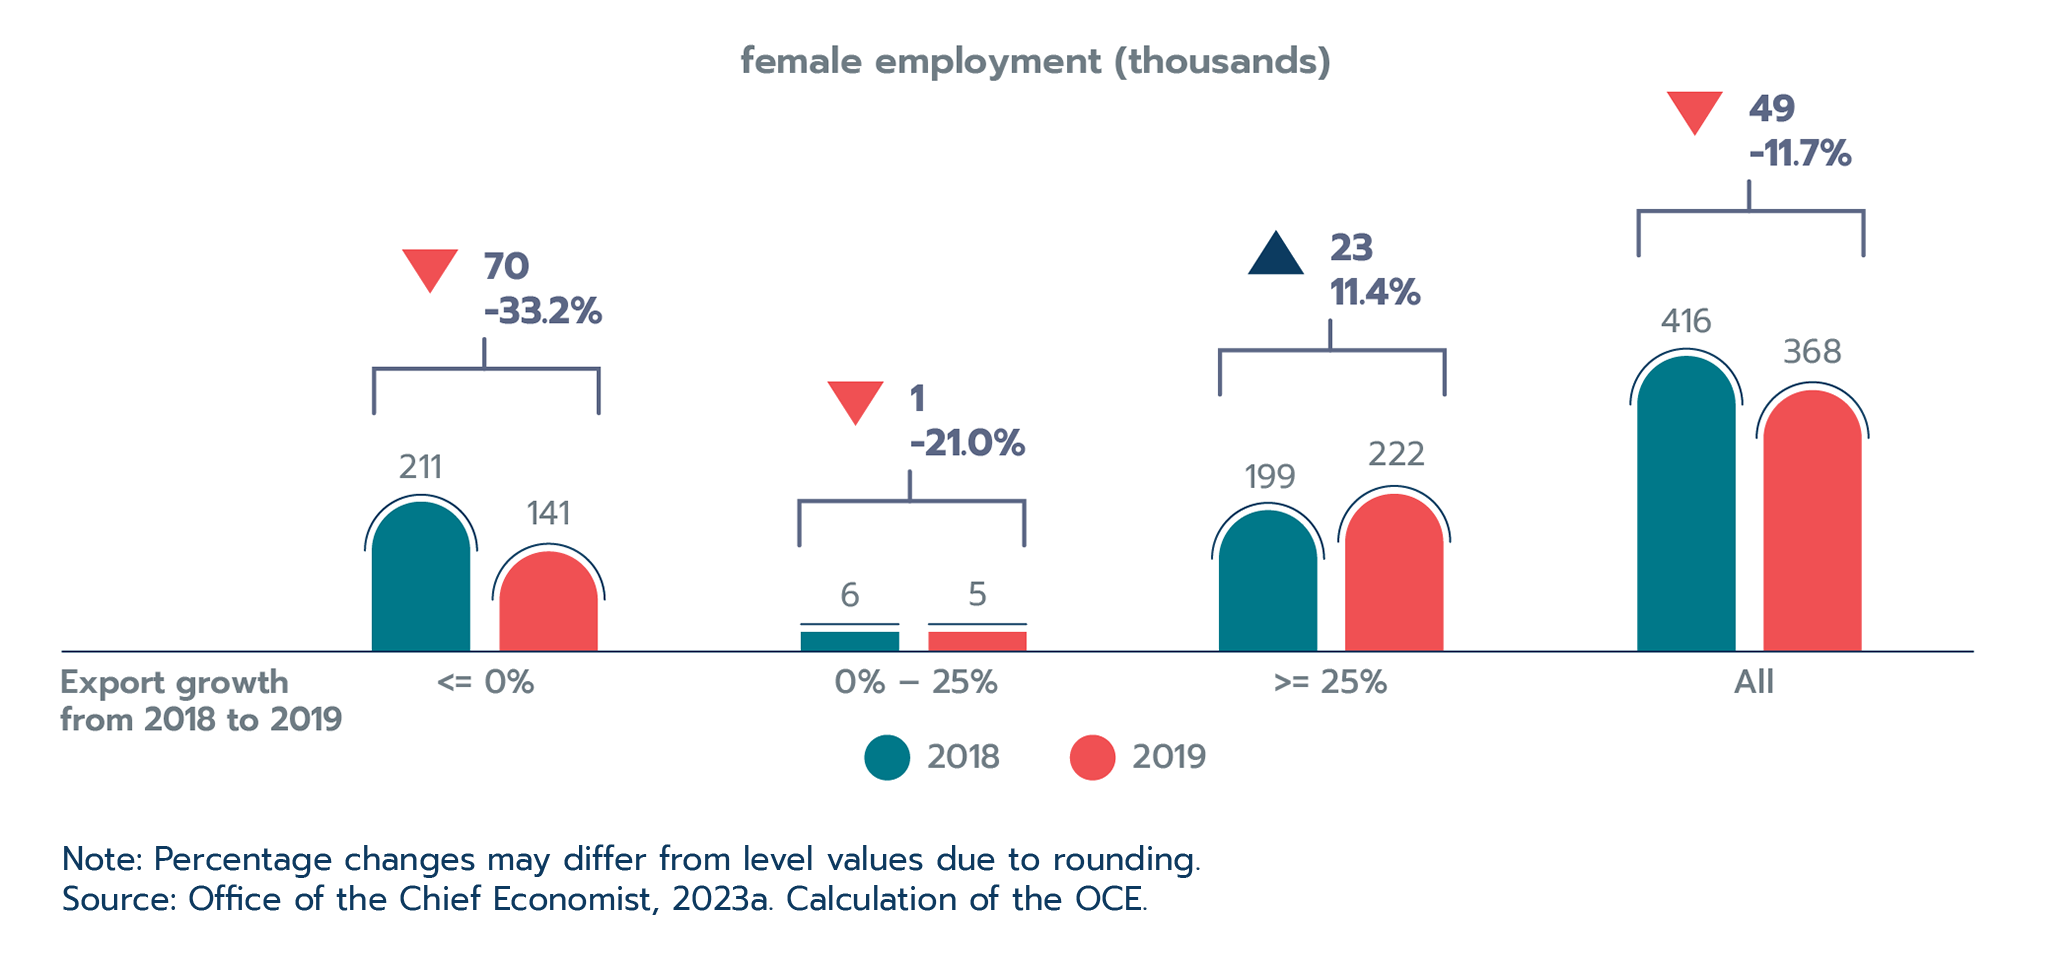
Text version
Female employment in firms that exported to new CPTPP markets from 2018 to 2019, by size of export growth
| Export growth from 2018 to 2019 | 2018 (thousands) | 2019 (thousands) | Growth 2018‒2019 (thousands) | Growth 2018‒2019 (%) |
|---|---|---|---|---|
| <= 0% | 211 | 141 | -70 | -33.2 |
| 0% - 25% | 6 | 5 | -1 | -21.0 |
| >= 25% | 199 | 222 | 23 | 11.4 |
| All | 416 | 368 | -49 | -11.7 |
Note: Percentage changes may differ from level values due to rounding.
Source: Office of the Chief Economist, 2023a. Calculation of the OCE.
Unsurprisingly, the trends in female employment follow the overall employment trends for these firms, but there are two interesting takeaways from the analysis. The first is that high export growth to new markets is associated with growth in total employment and female employment.
The second takeaway is that females seem to be somewhat shielded from employment losses resulting from negative export growth, but also that they do not benefit from high export growth at the same rate as males. For example, despite making up 31.8% of workers employed by exporting firms, females accounted for just 24.2% of job losses. However, females also accounted for only 17.0% of job gains in high growth firms. Hence, female employment is somewhat sticky: while females appear to be less likely to lose their job relative to their male colleagues, they are also less likely to benefit from new hiring associated with rapid export growth. The reason for this finding is unclear, however, and it could be scrutinized more in future research. As more data become available, it will be possible to see the impact of the CPTPP on employment over the medium and longer term for both males and females.
Box 2.5: Global Affairs Canada’s Approach to Inclusive Trade Policy
Canada is advancing an inclusive approach to trade policy in all trade negotiations and implementation of final agreements. Canada ’s approach is consistent with—and aims to support—domestic economic, social and environmental policy priorities. The objective is to ensure that the benefits and opportunities of trade are more widely shared, including with traditionally underrepresented groups in trade such as women, Indigenous Peoples, and small and medium enterprises (SMEs). This means that Canada, as a standard practice, is pursuing a two-pronged approach with willing trade partners: seeking standalone cooperation-based chapters that remove barriers to participation in trade through the implementation of cooperation activities; and mainstreaming inclusive and gender responsive provisions across our trade agreements that are responsible, sustainable and transparent. To date, Canada has:
- Trade and Gender chapters in-force with both Chile and Israel
- SME chapters in-force with Israel, and under the Comprehensive and Progressive Agreement for Trans-Pacific Partnership (CPTPP), and the Canada-United States-Mexico Agreement (CUSMA)
- Recommendations (which are agreed upon texts that are not enforceable) on both SMEs and Trade and Gender with the European Union (EU) under the Comprehensive Economic and Trade Agreement (CETA)
This work is informed by a comprehensive and ongoing Gender-Based Analysis Plus (GBA Plus) of our trade agreements, the collection and analysis of extensive gender disaggregated data, and inclusive and ongoing stakeholder consultations. Consultations are facilitated through standing mechanisms such as the Indigenous Working Group on trade established in September 2017, and the Gender and Trade Advisory Group established in October 2020. Specialized sub-groups provide expert advice to trade policy makers including on GBA Plus of trade negotiations. This expert advice might include flagging for consideration how particular groups, such as persons with disabilities or the 2SLGBTQI+ community, may be affected by a trade policy provision and suggesting ways in which it could be modified.
Canada is pursuing other innovative mechanisms to advance inclusive trade policy:
- Inclusive Trade Action Group (ITAG): In March 2018, Canada, Chile and New Zealand established the ITAG and agreed to work together to advance inclusive trade initiatives globally, including in multilateral forums such as the WTO and OECD. Officials have developed and are implementing an evergreen work programme that includes Canadian priorities such as trade and gender. Mexico joined ITAG in 2021.
- Global Trade and Gender Arrangement (GTAGA): On August 4, 2020, ITAG trade ministers signed the GTAGA, a cooperation-based instrument that recognizes the importance of women’s economic empowerment and focuses on implementing cooperation activities to remove barriers to women’s participation in international trade. It is open for new economies to join and Mexico, Colombia and Peru are now members.
- Indigenous Peoples Economic and Trade Cooperation Arrangement (IPETCA): Canada, New Zealand, Australia and Chinese Taipei concluded negotiation of the IPETCA in November 2021. Indigenous Peoples’ representatives from each economy were closely engaged in the development of this cooperation-based instrument that facilitates Indigenous economic empowerment by removing barriers that Indigenous-owned businesses face when participating in international trade. Its implementation will be Indigenous-led and government-enabled, complementing the UN Declaration on the Rights of Indigenous Peoples, and contribute to reconciliation and sustainable development.
2.4 Women who export—understanding successes and challenges
Women’s entrepreneurship and exporting—where do we stand?
Women are very underrepresented in Canada’s entrepreneurship space. In 2020, only 16.8% of Canada’s SMEs were majority-owned by women while 68.9% were majority-owned by men (Figure 2.15). Moreover, this share has barely improved over the last decade; in 2011, women-owned businesses accounted for only 15.5% of the SME business population.
Figure 2.15 Women are underrepresented in SME ownership
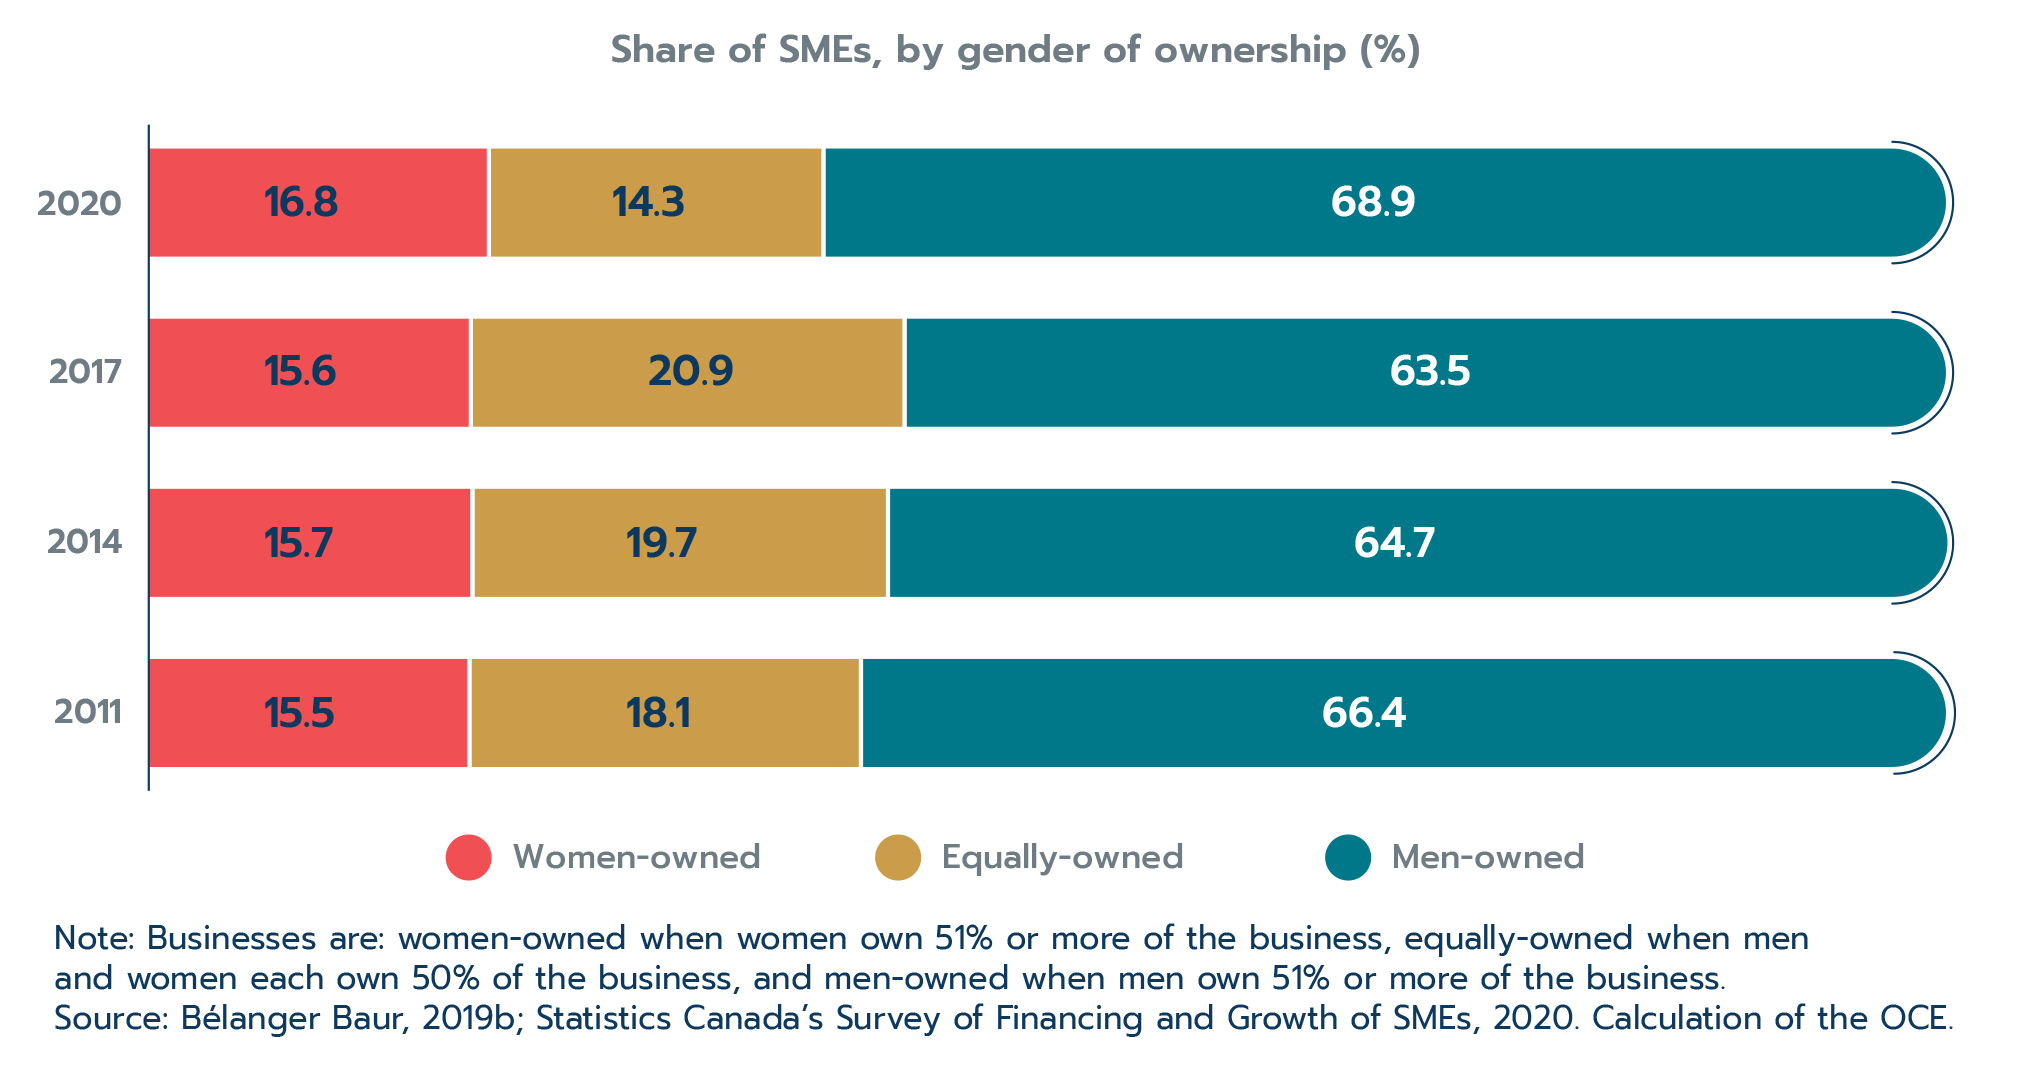
Text version
Share of SMEs, by gender of ownership (%)
| Year | Women-owned | Equally-owned | Men-owned |
|---|---|---|---|
| 2020 | 16.8 | 14.3 | 68.9 |
| 2017 | 15.6 | 20.9 | 63.5 |
| 2014 | 15.7 | 19.7 | 64.7 |
| 2011 | 15.5 | 18.1 | 66.4 |
Note: Businesses are: women-owned when women own 51% or more of the business, equally-owned when men and women each own 50% of the business, and men-owned when men own 51% or more of the business.
Source: Bélanger Baur, 2019b; Statistics Canada’s Survey of Financing and Growth of SMEs, 2020. Calculation of the OCE.
While women’s entrepreneurship overall has been relatively stable, export activity among women entrepreneurs has surged. The likelihood of women-owned SMEs to export (i.e. export propensity) more than doubled since 2011 when only 5.0% of women-owned SMEs exported compared to 11.4% of men-owned and equally-owned SMEs (Figure 2.16). (Men-owned and equally-owned SMEs are often grouped together for comparison purposes in this analysis because they have similar export behaviours and any gender-specific challenges can in theory be overcome if men are equal partners.)
Figure 2.16: The gender gap in exporting has narrowed considerably over the last decade
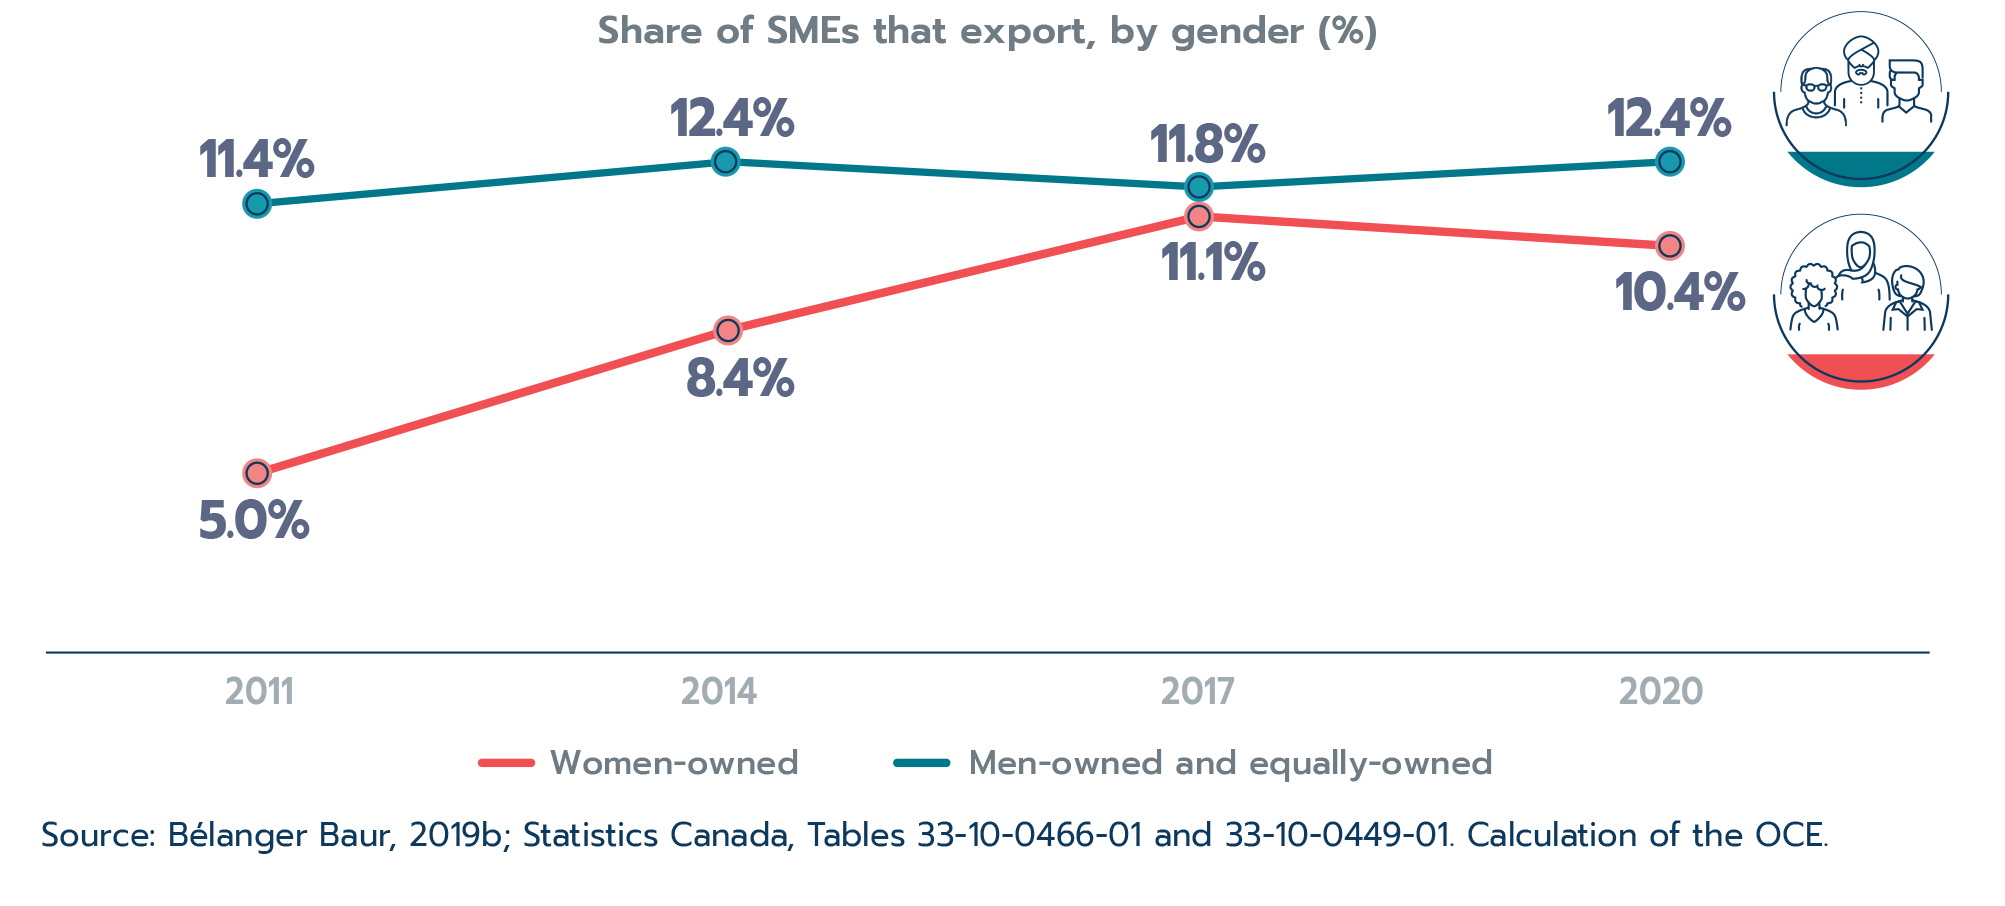
Text version
Share of SMEs that export, by gender (%)
| Year | Women-owned | Men-owned and equally-owned |
|---|---|---|
| 2011 | 5.0 | 11.4 |
| 2014 | 8.4 | 12.4 |
| 2017 | 11.1 | 11.8 |
| 2020 | 10.4 | 12.4 |
Source: Bélanger Baur, 2019b; Statistics Canada, Tables 33-10-0466-01 and 33-10-0449-01. Calculation of the OCE.
By 2017, there was no statistical gender difference in export propensity when characteristics such as industry and size are controlled for (Sekkel and Wang, 2023): 11.1% of women-owned SMEs exported in 2017 compared to 11.8% of men-owned and equally-owned SMEs.
In 2020, the export propensity of women dipped to 10.4%, which is a small reversal in an otherwise strong upward trend. Meanwhile, men-owned and equally-owned businesses increased their export propensity to 12.4% and the resulting gender gap in exporting widened. It is important to recognize that this drop was relatively small and did not erase years of previous gains in women’s export activity.
Women-owned firms were deeply impacted by the COVID-19 pandemic and related health restrictions such as border closures. This is largely due to the fact that they tend to be smaller and more concentrated in services, which were hit harder. Therefore, the dip in export activity among women-owned SMEs in 2020 may be temporary.
Firm characteristics—women-owned SMEs are smaller and concentrated in services
Industry distributions
Women-owned SME exporters are much more concentrated in services industries compared to men-owned and equally-owned exporters (Figure 2.17). These industry differences are important for understanding the various challenges women-owned SMEs face, and also for informing appropriate and effective trade policy and promotion solutions.
Figure 2.17: Women-owned SME exporters are more concentrated in services
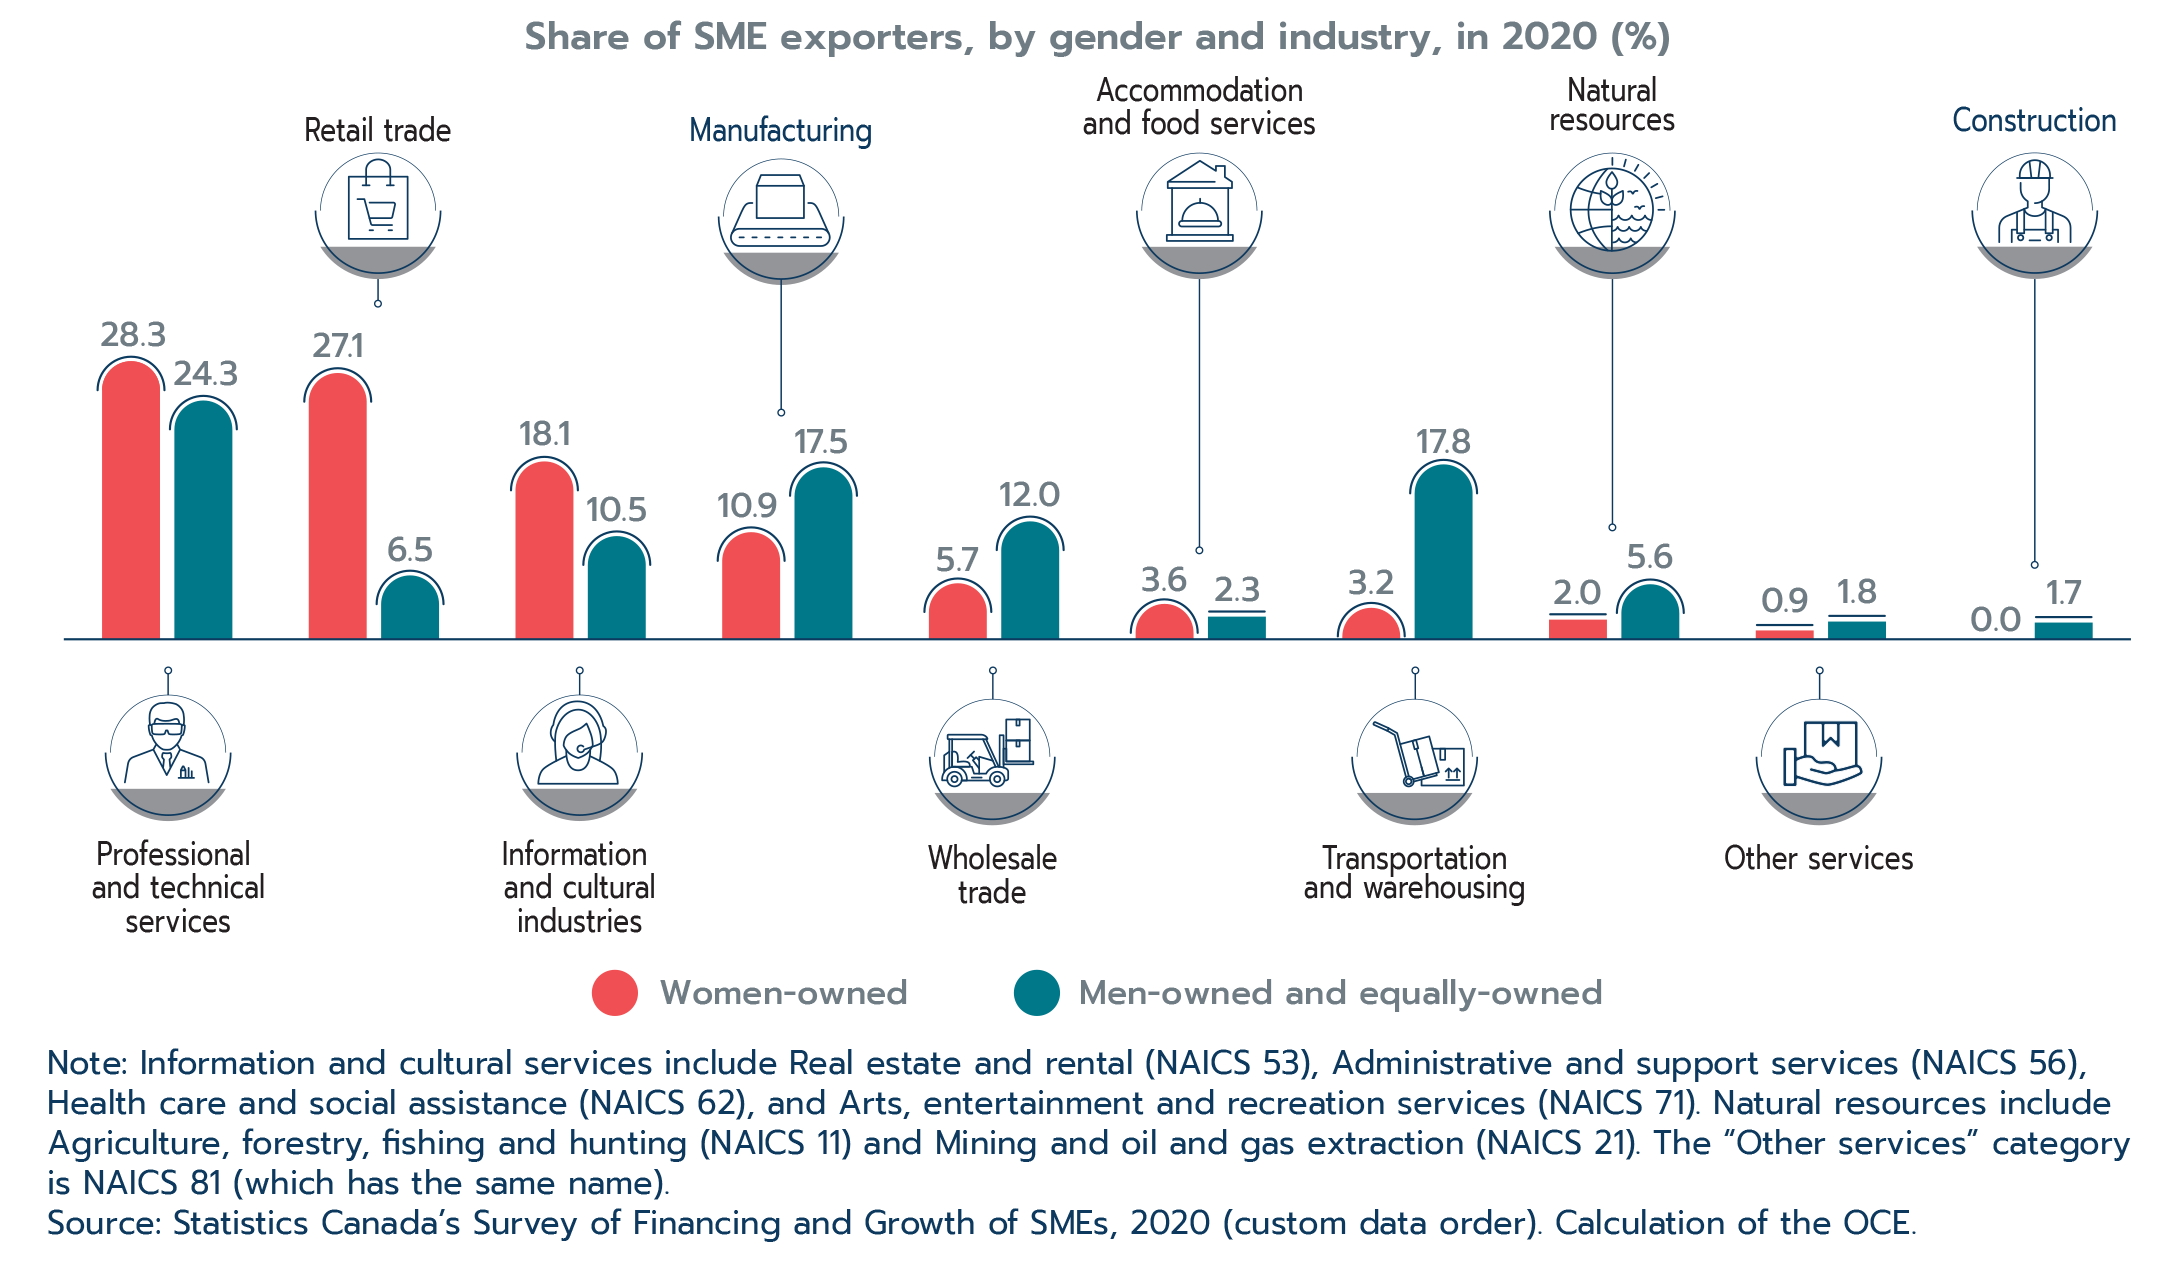
Text version
Share of SME exporters, by gender and industry, in 2020 (%)
| Industry | Women-owned | Men-owned and equally-owned |
|---|---|---|
| Professional and technical services | 28.3 | 24.3 |
| Retail trade | 27.1 | 6.5 |
| Information and cultural services | 18.1 | 10.5 |
| Manufacturing | 10.9 | 17.5 |
| Wholesale trade | 5.7 | 12.0 |
| Accommodation and food services | 3.6 | 2.3 |
| Transportation and warehousing | 3.2 | 17.8 |
| Natural resources | 2.0 | 5.6 |
| Other services | 0.9 | 1.8 |
| Construction | 0.0 | 1.7 |
Note: Information and cultural services include Real estate and rental (NAICS 53), Administrative and support services (NAICS 56), Health care and social assistance (NAICS 62), and Arts, entertainment and recreation services (NAICS 71). Natural resources include Agriculture, forestry, fishing and hunting (NAICS 11) and Mining and oil and gas extraction (NAICS 21). The “Other services” category is NAICS 81 (which has the same name).
Source: Statistics Canada’s Survey of Financing and Growth of SMEs, 2020 (custom data order). Calculation of the OCE.
While both women-owned and men-owned SMEs are very active exporters of professional, scientific and technical services, women-owned SMEs have an outsized concentration in retail trade (27.1%) compared to men-owned and equally-owned exporters (6.5%). Information and cultural services (18.1%) are also very popular among women-owned SMEs—more so than for men-owned and equally-owned SMEs (10.5%).
On the other hand, men-owned and equally-owned SME exporters are much more concentrated in transportation and warehousing (17.8%) compared to women-owned SMEs (3.2%). Manufacturing, wholesale trade and natural resources (e.g. agriculture, mining, forestry, and fishing) are also much more popular export industries among men-owned and equally-owned exporters.
Firm size
Women-owned SME exporters tend to be smaller (Figure 2.18). While half of all SME exporters—regardless of the owner’s gender—are considered micro-sized (1-4 employees), women are much less represented in the larger size categories. In fact, only 7.2% of women-owned SME exporters have 20 or more employees compared to 22.0% of men-owned and equally-owned SME exporters. The difference is even more stark in the medium size category (100-499 employees), where the share of women-owned SME exporters is only 1.9% compared to 5.5% for men-owned and equally-owned SME exporters.
Figure 2.18: Women-owned SME exporters tend to be smaller
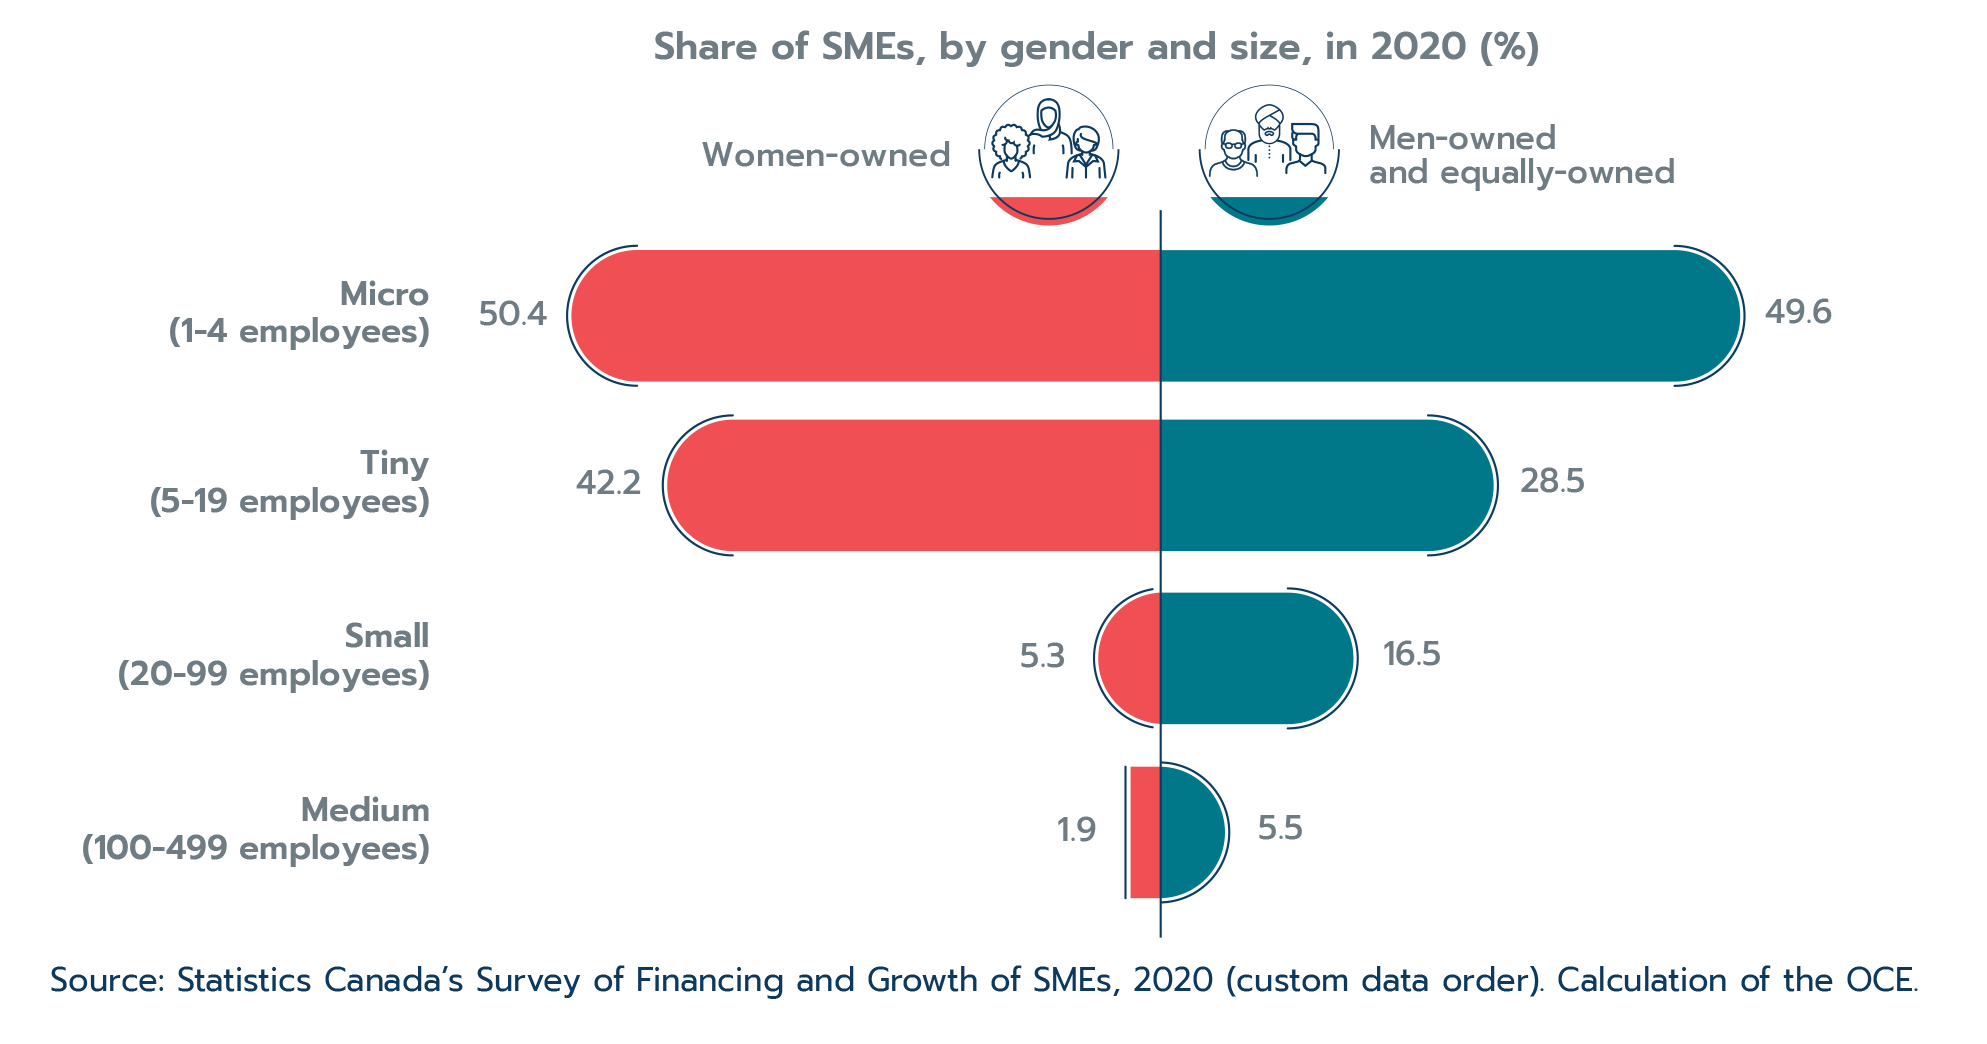
Text version
Share of SMEs, by gender and size, in 2020 (%)
| SME size | Women-owned | Men-owned and equally-owned |
|---|---|---|
| Micro (1-4 employees) | 50.4 | 49.6 |
| Tiny (5-19 employees) | 42.2 | 28.5 |
| Small (20-99 employees) | 5.3 | 16.5 |
| Medium (100-499 employees) | 1.9 | 5.5 |
Source: Statistics Canada’s Survey of Financing and Growth of SMEs, 2020 (custom data order). Calculation of the OCE.
Education and experience of women entrepreneurs
Women-owned SMEs tend to be led by people with higher education levels, but less managerial experience. Women-owned SMEs are more likely to be led by people with post-secondary education (81%) than men-owned and equally-owned businesses (68%) (Figure 2.19).
However, firms owned by women tend to be newer and led by people with less managerial experience than men-owned firms (Figure 2.19). This could indicate that women-owned SMEs are more likely to be establishing themselves, building a customer base and gaining entrepreneurial experience—i.e. they are still at early stages of their entrepreneurial journey and there is much potential for them in the future.
Figure 2.19: Business age, management experience, and education of primary decision maker
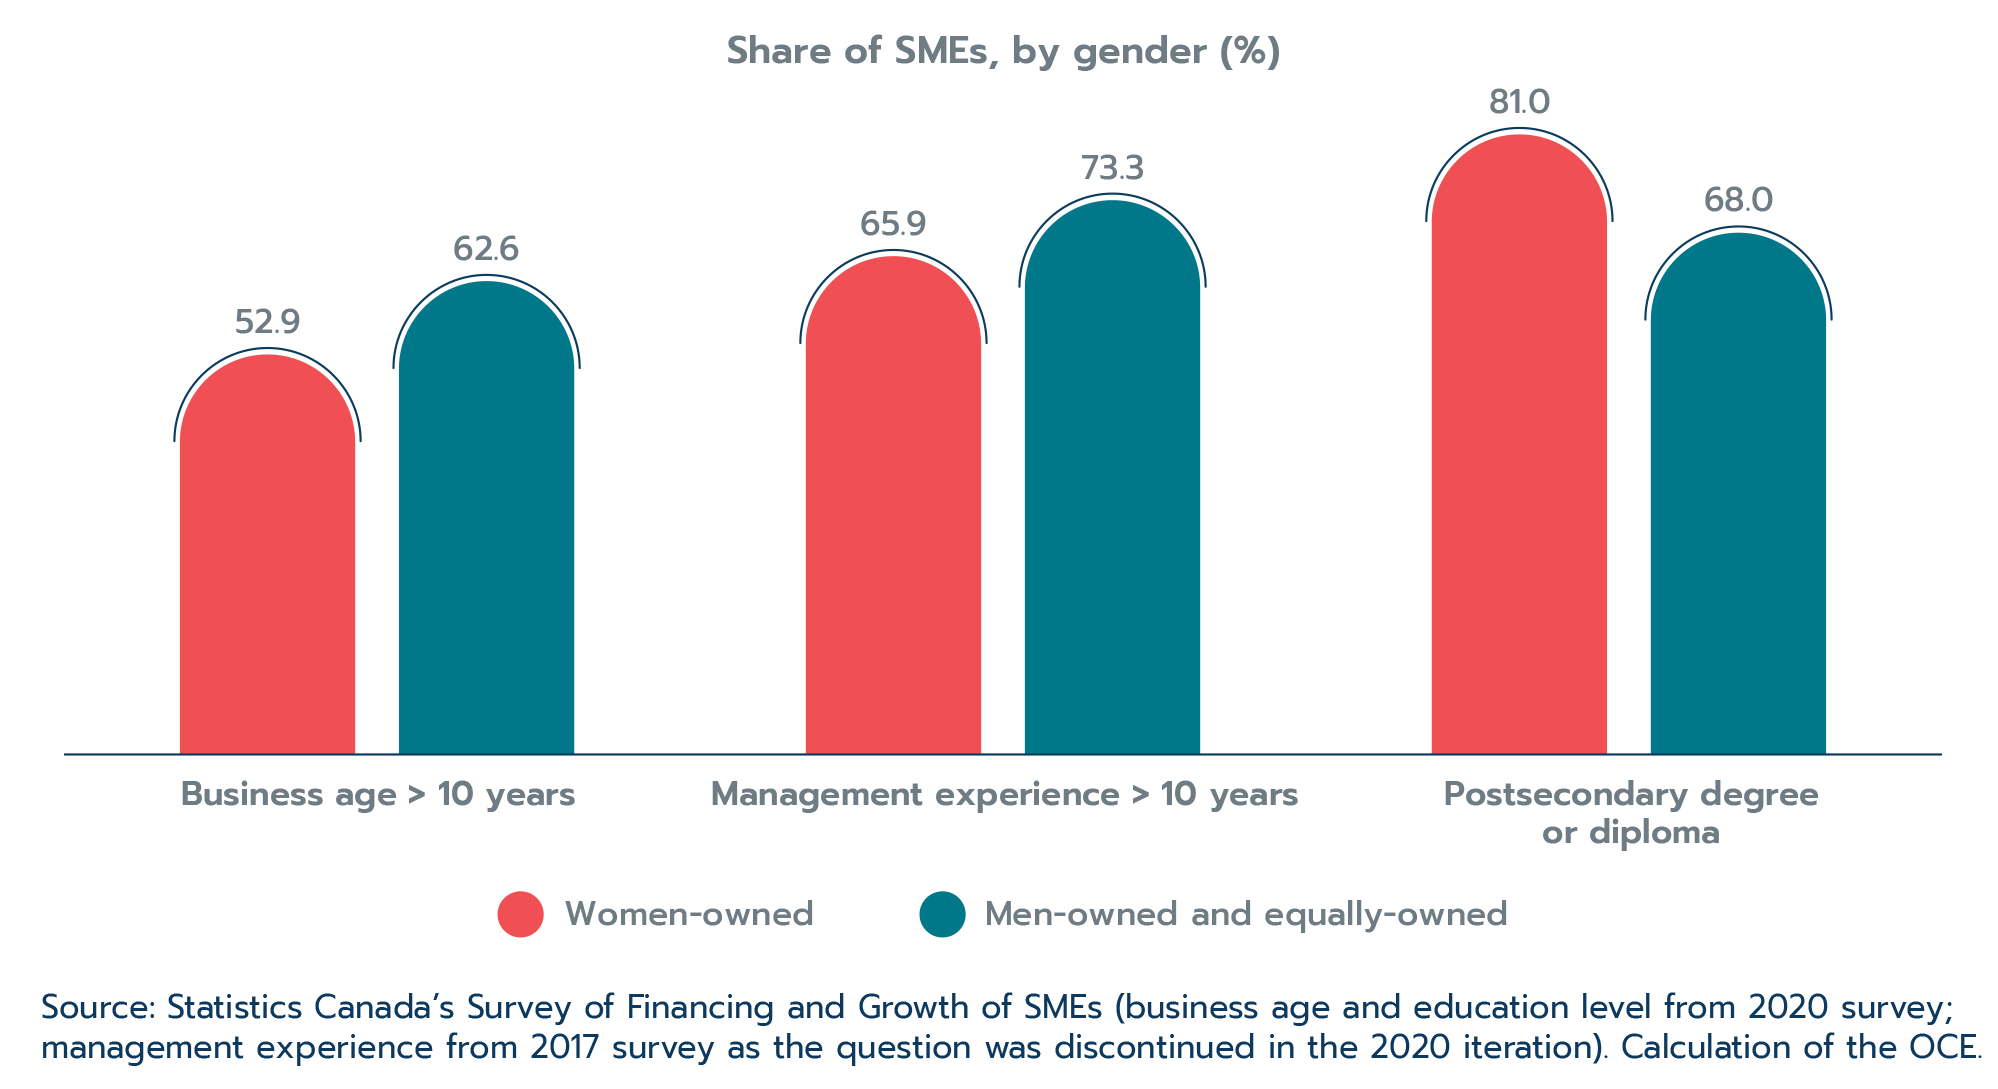
Text version
Share of SMEs, by gender (%)
| Women-owned | Men-owned and equally-owned | |
|---|---|---|
| Business age > 10 years | 52.9 | 62.6 |
| Management experience > 10 years | 65.9 | 73.3 |
| Postsecondary degree or diploma | 81.0 | 68.0 |
Source: Statistics Canada's Survey of Financing and Growth of SMEs (business age and education level from 2020 survey; management experience from 2017 survey as the question was discontinued in the 2020 iteration). Calculation of the OCE.
Education and management experience are more important factors in export performance for women-owned than for men-owned and equally-owned SMEs, according to a recent study co-authored by economists in the Office of the Chief Economist and Statistics Canada (Sekkel and Wang, 2023). The authors find that women-owned SME exporters with higher levels of education (specifically, bachelor degree), and decision makers with more management experience (5 years or more) had a higher share of their revenues coming from export sales than their men-owned and equally-owned peers with the same levels of education and management experience.
International markets—women entrepreneurs interested in diverse markets
While the U.S. is by far the top market for SMEs regardless of the gender of their owner, women-owned SMEs tend to be a little less reliant on it (77.6% of exporters) than men-owned and equally-owned SME exporters (84.6%). Instead, women tend to be relatively more focused on the United Kingdom and other European markets, as well as on the Chinese and Japanese markets (Figure 2.20).
Figure 2.20: Women-owned SMEs export to slightly more diverse markets
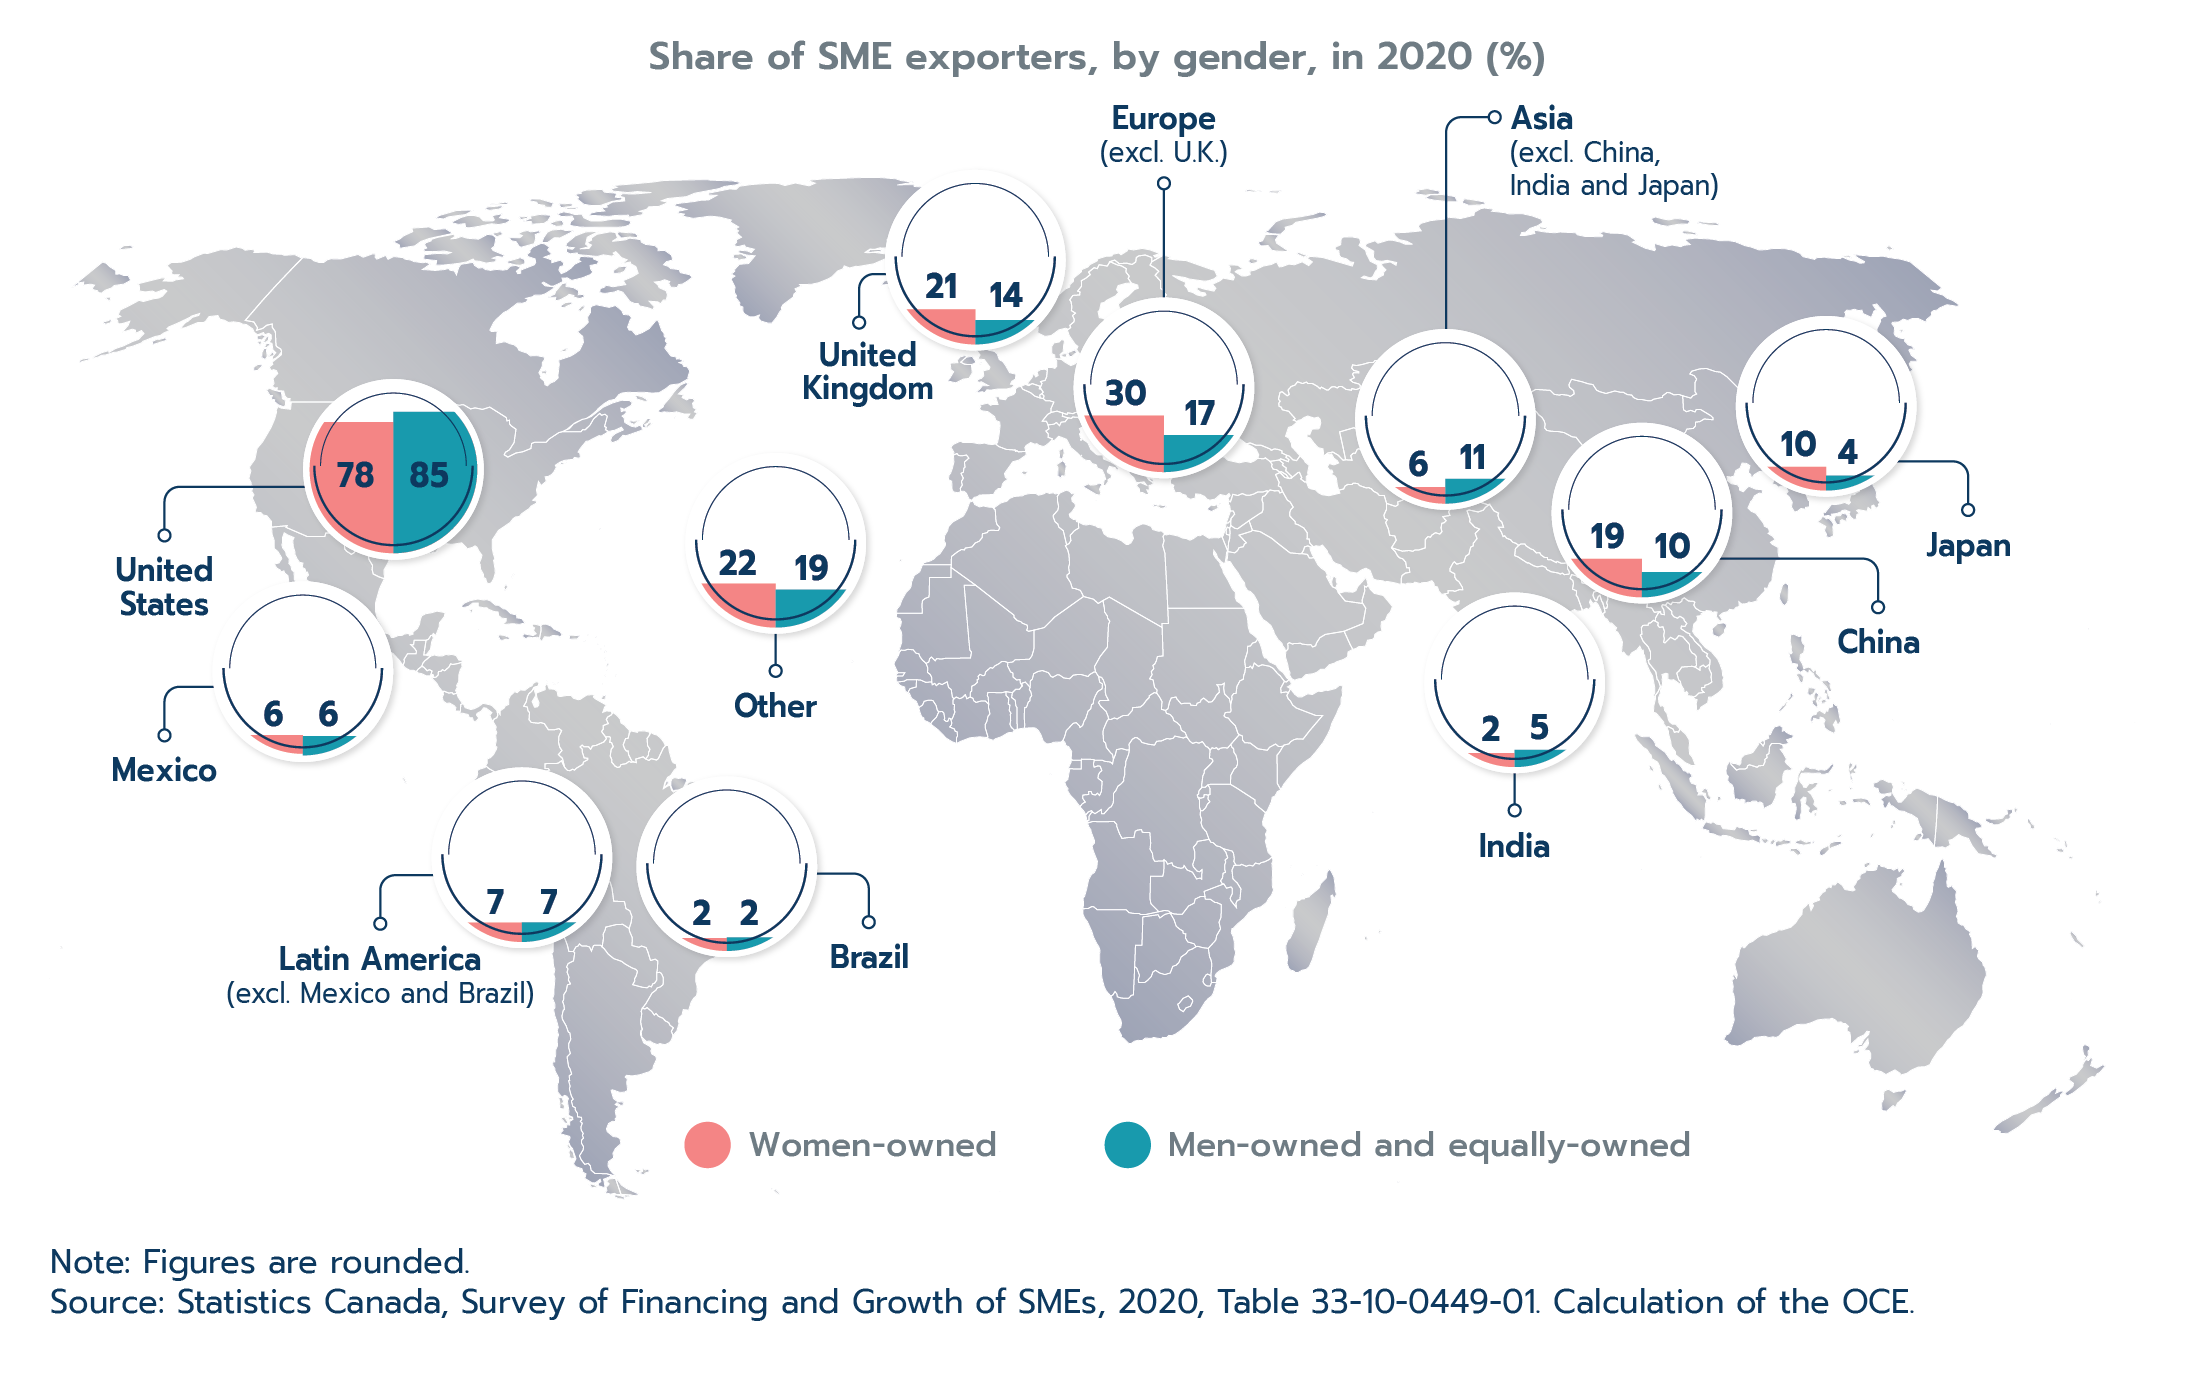
Text version
Share of SME exporters, by gender in 2020 (%)
| Country | Women-owned | Men-owned and equally-owned |
|---|---|---|
| United States | 78 | 85 |
| Europe (excl. U.K.) | 30 | 17 |
| United Kingdom | 21 | 14 |
| China | 19 | 10 |
| Japan | 10 | 4 |
| Latin America (excl. Mexico and Brazil) | 7 | 7 |
| Asia (excl. China, India and Japan) | 6 | 11 |
| Mexico | 6 | 6 |
| India | 2 | 5 |
| Brazil | 2 | 2 |
| Other | 22 | 19 |
Source: Statistics Canada, Survey of Financing and Growth of SMEs, 2020, Table 33-10-0449-01. Calculation of the OCE.
Despite the relative focus on European and Asian markets, there is evidence that women may make slightly less use of FTAs than the Canadian average. Statistics Canada asked importing and exporting firms about their 2021 use of the Canada-United States-Mexico FTA, the Canada-European Union Comprehensive Economic and Trade Agreement, and the Comprehensive and Progressive Agreement for Trans-Pacific Partnership. Roughly one quarter to one third of respondents were unsure whether their firms used the agreements; but of the businesses that did know, women-owned firms were less likely to indicate that they made use of the specified FTAs. This is a relevant finding for trade policy and programs that would benefit from further investigation.
E-commerce is very popular among women-owned SMEs and exporters
Women-owned SMEs of every size are avid users of e-commerce. Some 15.0% of women-owned SMEs offered an e-commerce platform or payment system in 2020 compared to 10.1% of men-owned and equally-owned SMEs.Footnote 10 In fact, women-owned SMEs of each size category are more likely to offer e-commerce than their men-owned and equally-owned peers (Figure 2.21).
Figure 2.21: Women-owned SMEs more likely to offer e-commerce
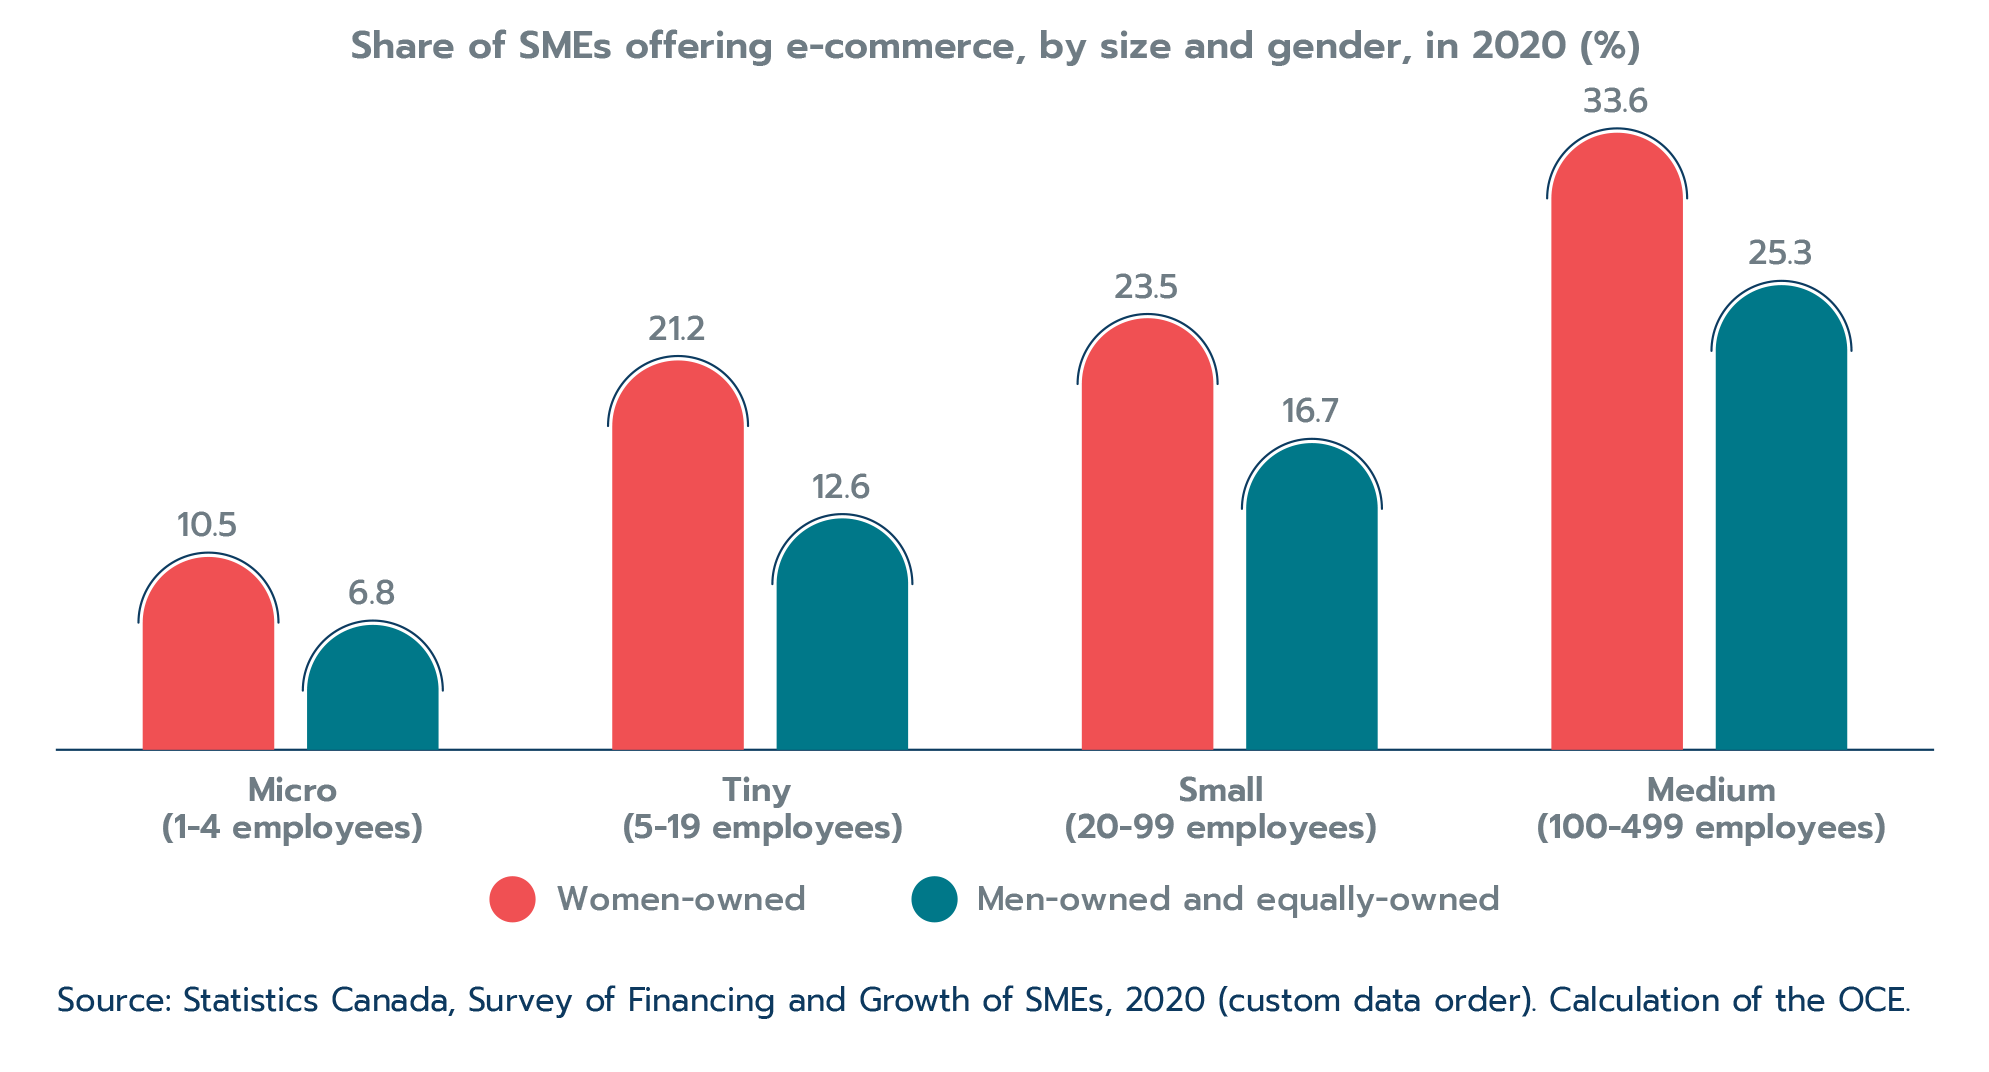
Text version
Share of SMEs offering e-commerce, by size and gender, in 2020 (%)
| SME size | Women-owned | Men-owned and equally-owned |
|---|---|---|
| Micro (1-4 employees) | 10.5 | 6.8 |
| Tiny (5-19 employees) | 21.2 | 12.6 |
| Small (20-99 employees) | 23.5 | 16.7 |
| Medium (100-499 employees) | 33.6 | 25.3 |
Source: Statistics Canada, Survey of Financing and Growth of SMEs, 2020 (custom data order). Calculation of the OCE.
Women-owned SMEs offer higher rates of e-commerce in almost every industry (Table 2.3). Women in the retail trade industry have the highest rate of use of e-commerce (39.2%), which is almost twice as much as men-owned and equally-owned SMEs (21.6%).
Table 2.3: Rate of use of e-commerce by industry and gender of ownership, 2020 (%)
| Industry | Women-owned | Men-owned and equally-owned |
|---|---|---|
| Retail trade | 39.2 | 21.6 |
| Manufacturing | 23.1 | 17.1 |
| Wholesale trade | 21.1 | 18.3 |
| Accommodation and food services | 16.8 | 17.9 |
| Natural resources | 12.5 | 5.5 |
| Information and cultural services | 8.5 | 10.2 |
| Transportation and warehousing | 8.2 | 1.6 |
| Professional and technical services | 5.3 | 7.3 |
| Construction | 1.2 | 4.1 |
| Other services | 13.9 | 8.3 |
| All industries | 15.0 | 10.1 |
Note: Information and cultural services include Real estate and rental (NAICS 53), Administrative and support services (NAICS 56), Health care and social assistance (NAICS 62), and Arts, entertainment and recreation (NAICS 71). Natural resources include Agriculture, forestry, fishing and hunting (NAICS 11) and Mining and oil and gas extraction (NAICS 21). The “Other services” category is NAICS 81 (which has the same name).
Source: Statistics Canada, Survey of Financing and Growth of SMEs, 2020 (custom data order). Calculation of the OCE.
E-commerce use varies substantially by export market. In 2020, women-owned SMEs that export to Europe were most likely to offer e-commerce (56.7%), while men-owned and equally-owned SMEs that exported to Europe were half as likely to offer e-commerce (24.7%).
Asia was the second most popular for women-owned SMEs, with 52.9% exporting to Asia using e-commerce compared to only 19.0% of men-owned and equally-owned SMEs that export to Asia. The only export region where women-owned SMEs were less likely to use e-commerce was Latin America.
Export obstacles and challenges
The COVID-19 pandemic brought a host of new challenges for SMEs, particularly those owned by women. As stores, borders, restaurants and offices closed down, consumers shifted their spending patterns dramatically. Many women-owned SMEs were especially hard hit as they are smaller and more concentrated in services industries (which experienced some of the most severe public health restrictions). Moreover, many women faced increased demands outside of their job, including caring for children and elderly parents.
For the first time, women-owned SME exporters’ top reported export obstacle was “financing or cash flow” in 2020 (Figure 2.22). In past iterations of Statistics Canada’s Survey of Financing and Growth of SMEs, financing or cash flow was much lower in the list of challenges, and men-owned and equally-owned businesses were more likely to report it as an export challenge (Sekkel, 2020).
Canada is somewhat unique in this respect, as access to financing is normally one of the top challenges facing women entrepreneurs globally (Korinek, Moïsé and Tange, 2021; World Bank and World Trade Organization, 2020). While 2020 was a particularly challenging year, policy makers will need to watch closely how financing obstacles evolve in the post-pandemic era.
Figure 2.22: Obstacles to exporting, by gender, in 2020
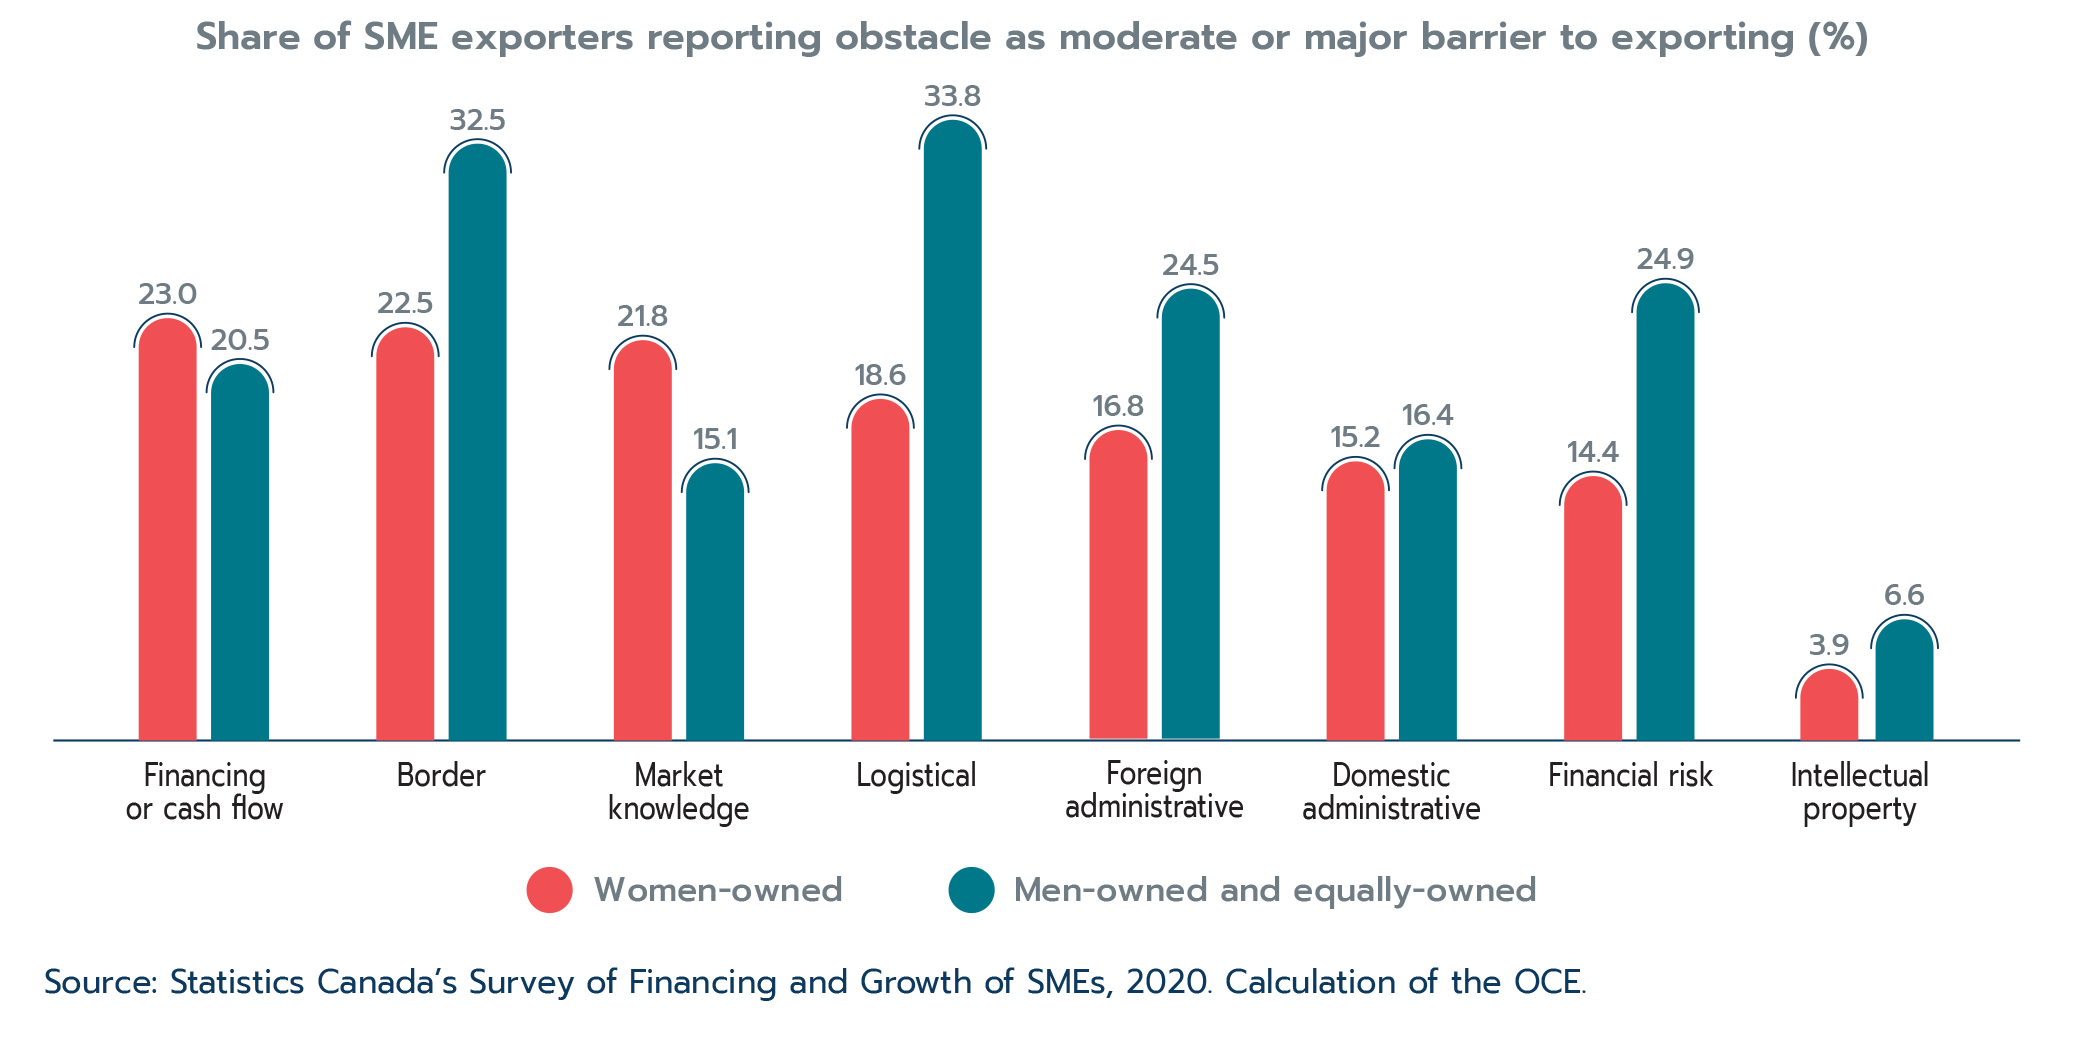
Text version
Share of SME exporters reporting obstacle as moderate or major barrier to exporting (%)
| SME exporters | Women-owned | Men-owned and equally-owned |
|---|---|---|
| Financing or cash flow | 23.0 | 20.5 |
| Border | 22.5 | 32.5 |
| Market knowledge | 21.8 | 15.1 |
| Logistical | 18.6 | 33.8 |
| Foreign administrative | 16.8 | 24.5 |
| Domestic administrative | 15.2 | 16.4 |
| Financial risk | 14.4 | 24.9 |
| Intellectual property | 3.9 | 6.6 |
Source: Statistics Canada’s Survey of Financing and Growth of SMEs, 2020. Calculation of the OCE.
The only other export obstacle that was more highly cited by women-owned than men-owned and equally-owned SMEs in 2020 was market knowledge. Similar to financing or cash flow, market knowledge was lower in the list of export challenges in past iterations of the survey, and was more likely to be cited by men-owned and equally-owned businesses in the past. The share of women-owned SME exporters citing this challenge more than doubled in 2020 compared to the previous survey in 2017 (Figure 2.23). This obstacle was perhaps exacerbated during the pandemic under constantly shifting public health policies around the world, making the business landscape more difficult to navigate.
Figure 2.23 Export obstacles with the largest increases in 2020 compared to 2017 reported by women-owned SME exporters
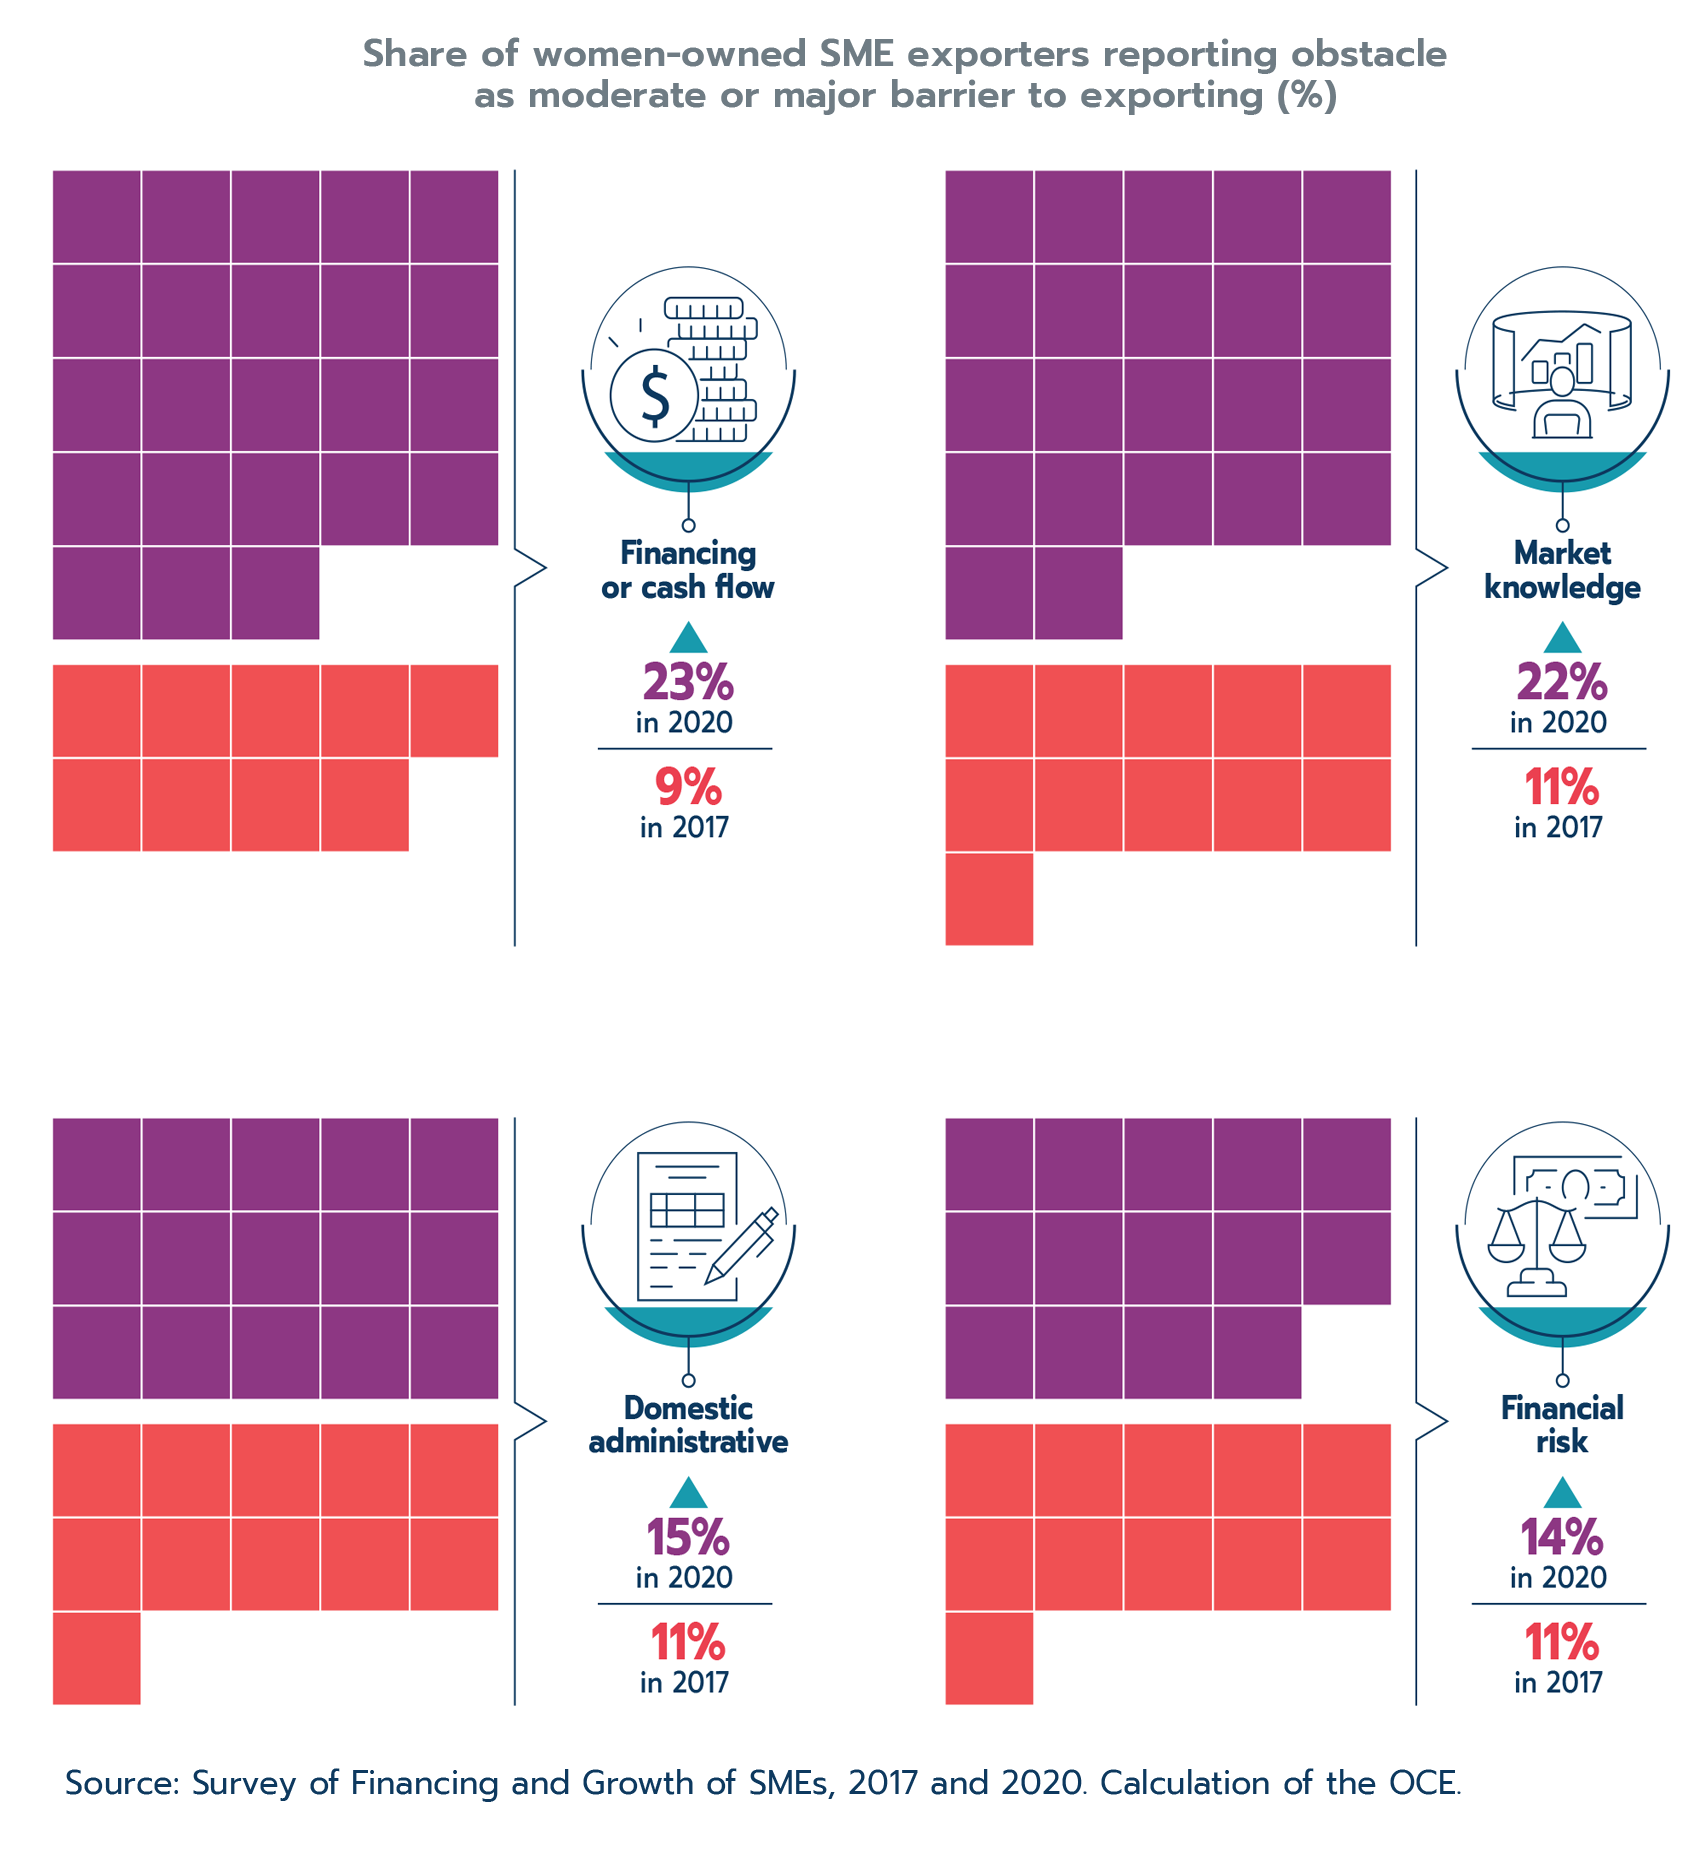
Text version
Share of women-owned SME exporters reporting obstacle as moderate or major barrier to exporting (%)
| SME exporters | 2017 | 2020 |
|---|---|---|
| Financing or cash flow | 9 | 23 |
| Market knowledge | 11 | 22 |
| Domestic administrative | 11 | 15 |
| Financial risk | 11 | 14 |
Source: Survey of Financing and Growth of SMEs, 2017 and 2020. Calculation of the OCE.
Border obstacles (e.g. import quotas, customs duties, tariffs, non-tariff barriers, border security issues), logistical obstacles (e.g. distance to customers, transportation costs, brokerage fees), and foreign administrative obstacles (e.g. foreign customer requirements, product standards, technology requirements) have consistently been some of the top export challenges reported by women-owned SME exporters over the past decade as revealed by Statistics Canada’s successive surveys.
While many of these obstacles cannot be eliminated, there is a role for joint government-private sector programs aimed at supporting women-owned businesses to navigate the international business landscape. There is also a role for policy makers to address or reduce some of these obstacles through trade policies such as FTAs. Moreover, trade promotion programs like those offered by the Trade Commissioner Service can be used by businesses to address or overcome many of these obstacles.
Enablers for export and business success
If women-owned SMEs are smaller and mostly concentrated in services industries that are less export intensive, then how were they able to export at an almost similar rate to men-owned and equally-owned SMEs? Joint research by the Office of the Chief Economist and Statistics Canada reveals which factors are statistically more strongly associated with the probability of exporting for women-owned compared to men-owned and equally-owned SMEs (Sekkel and Wang, 2023).
E-commerce and innovations
The authors first identify e-commerce as being a particularly strong enabler for women-owned SMEs to export. Having an online payment feature on their website was associated with a 38% predicted probability of exporting for women-owned SMEs compared to only 20% for men-owned and equally-owned SMEs (Figure 2.24). Moreover, women-owned SMEs that do not engage in e-commerce are significantly less likely to export (8%) than men-owned or equally-owned SMEs (13%).
Figure 2.24: Importance of e-commerce for exporting SMEs, by gender
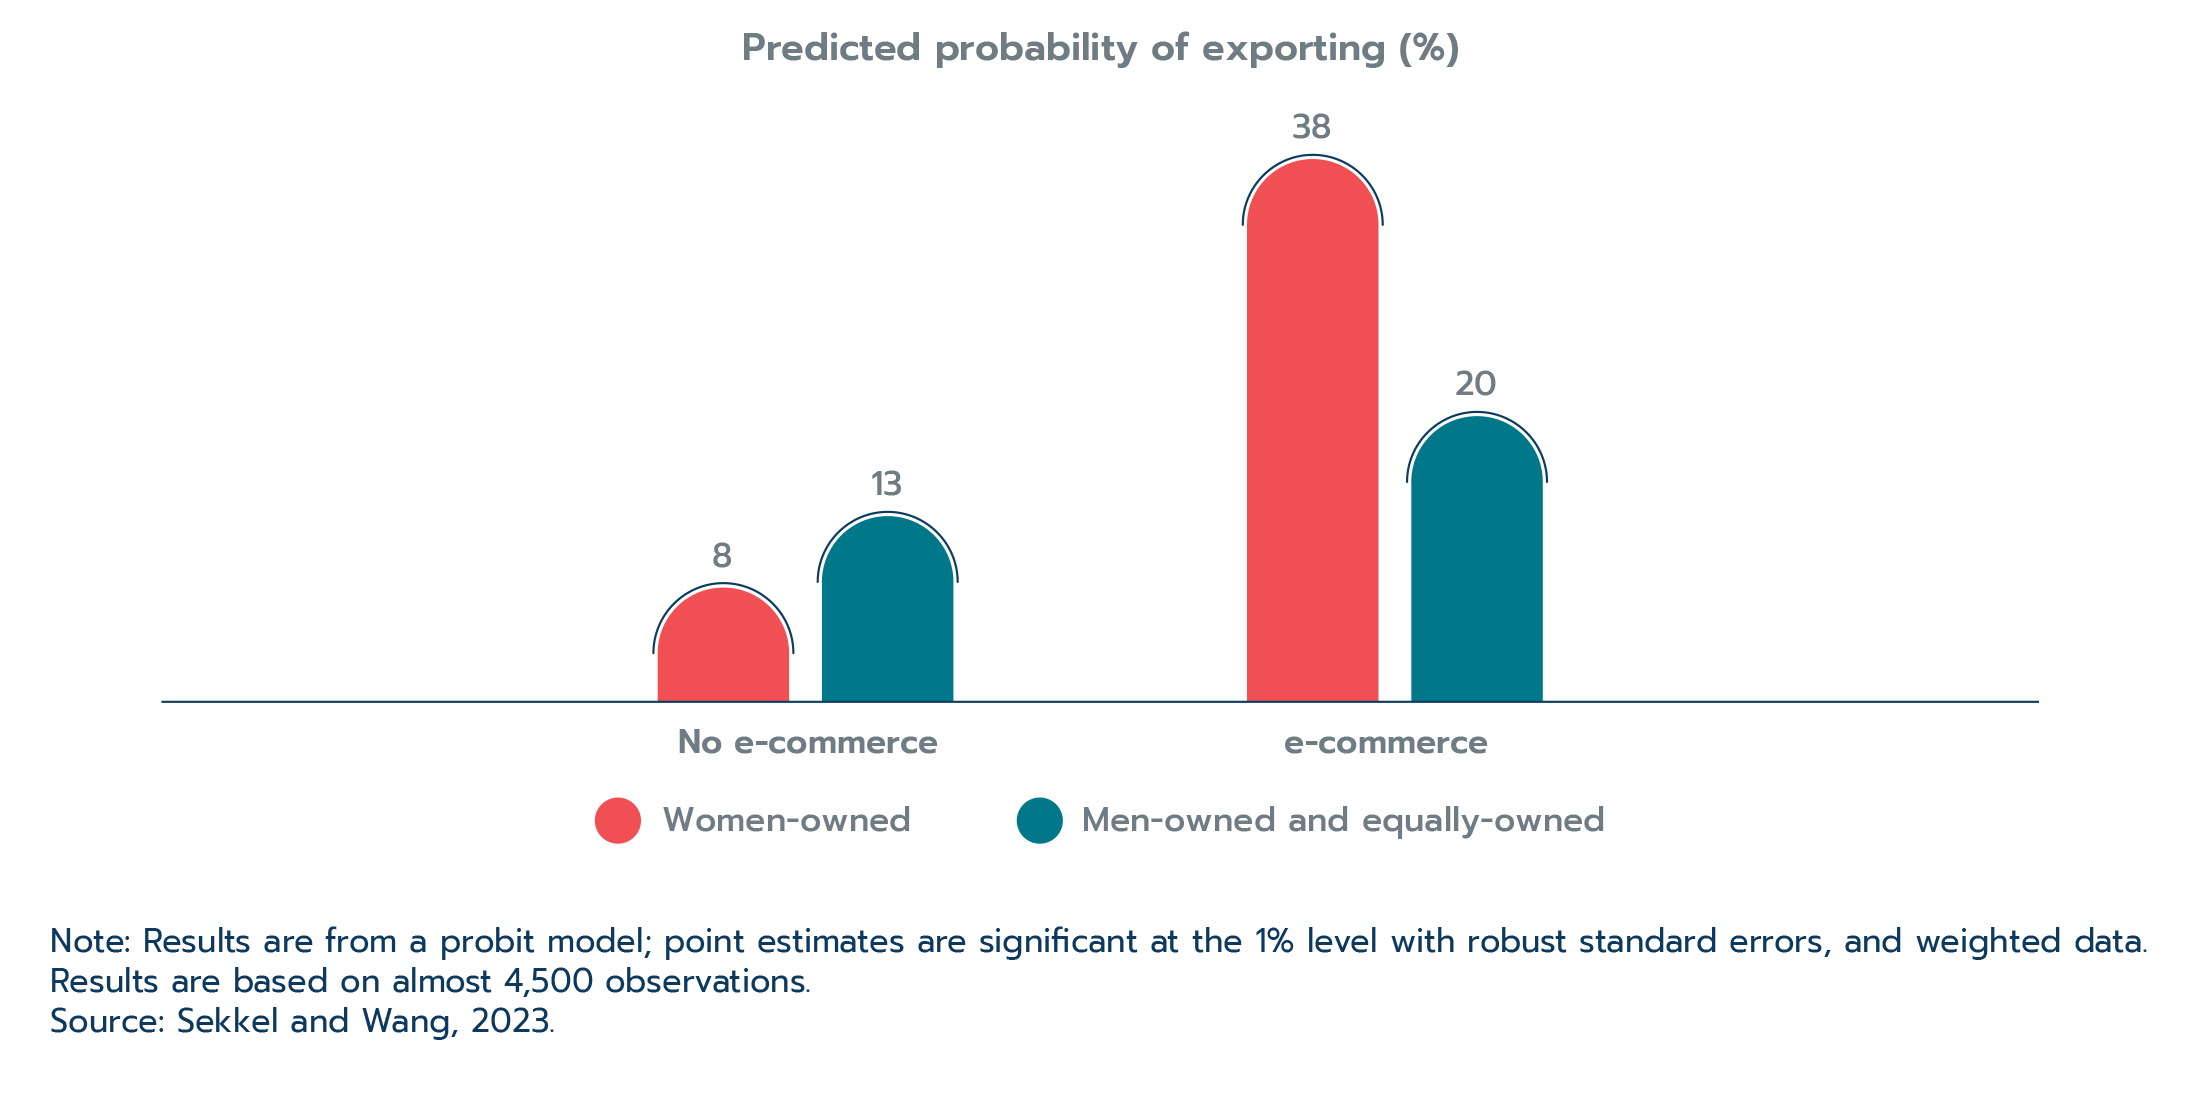
Text version
Predicted probability of exporting (%)
| Gender | No e-commerce | e-commerce |
|---|---|---|
| Women-owned | 8 | 38 |
| Men-owned and equally-owned | 13 | 20 |
Note: Results are from a probit model; point estimates are significant at the 1% level with robust standard errors, and weighted data. Results are based on almost 4,500 observations.
Source: Sekkel and Wang, 2023.
Secondly, the authors find statistical evidence of the importance of business innovation in women’s export activity. In particular, marketing and organizational innovations were associated with, respectively, a 25% and 31% predicted probability of exporting for women-owned SMEs compared to 18% and 22%, respectively, for men-owned and equally-owned SMEs (Figure 2.25). On the other hand, women-owned SMEs with no innovation were statistically half as likely to export (5%) than their men-owned and equally-owned peers (10%).
Figure 2.25: Importance of innovation for exporting SMEs, by gender
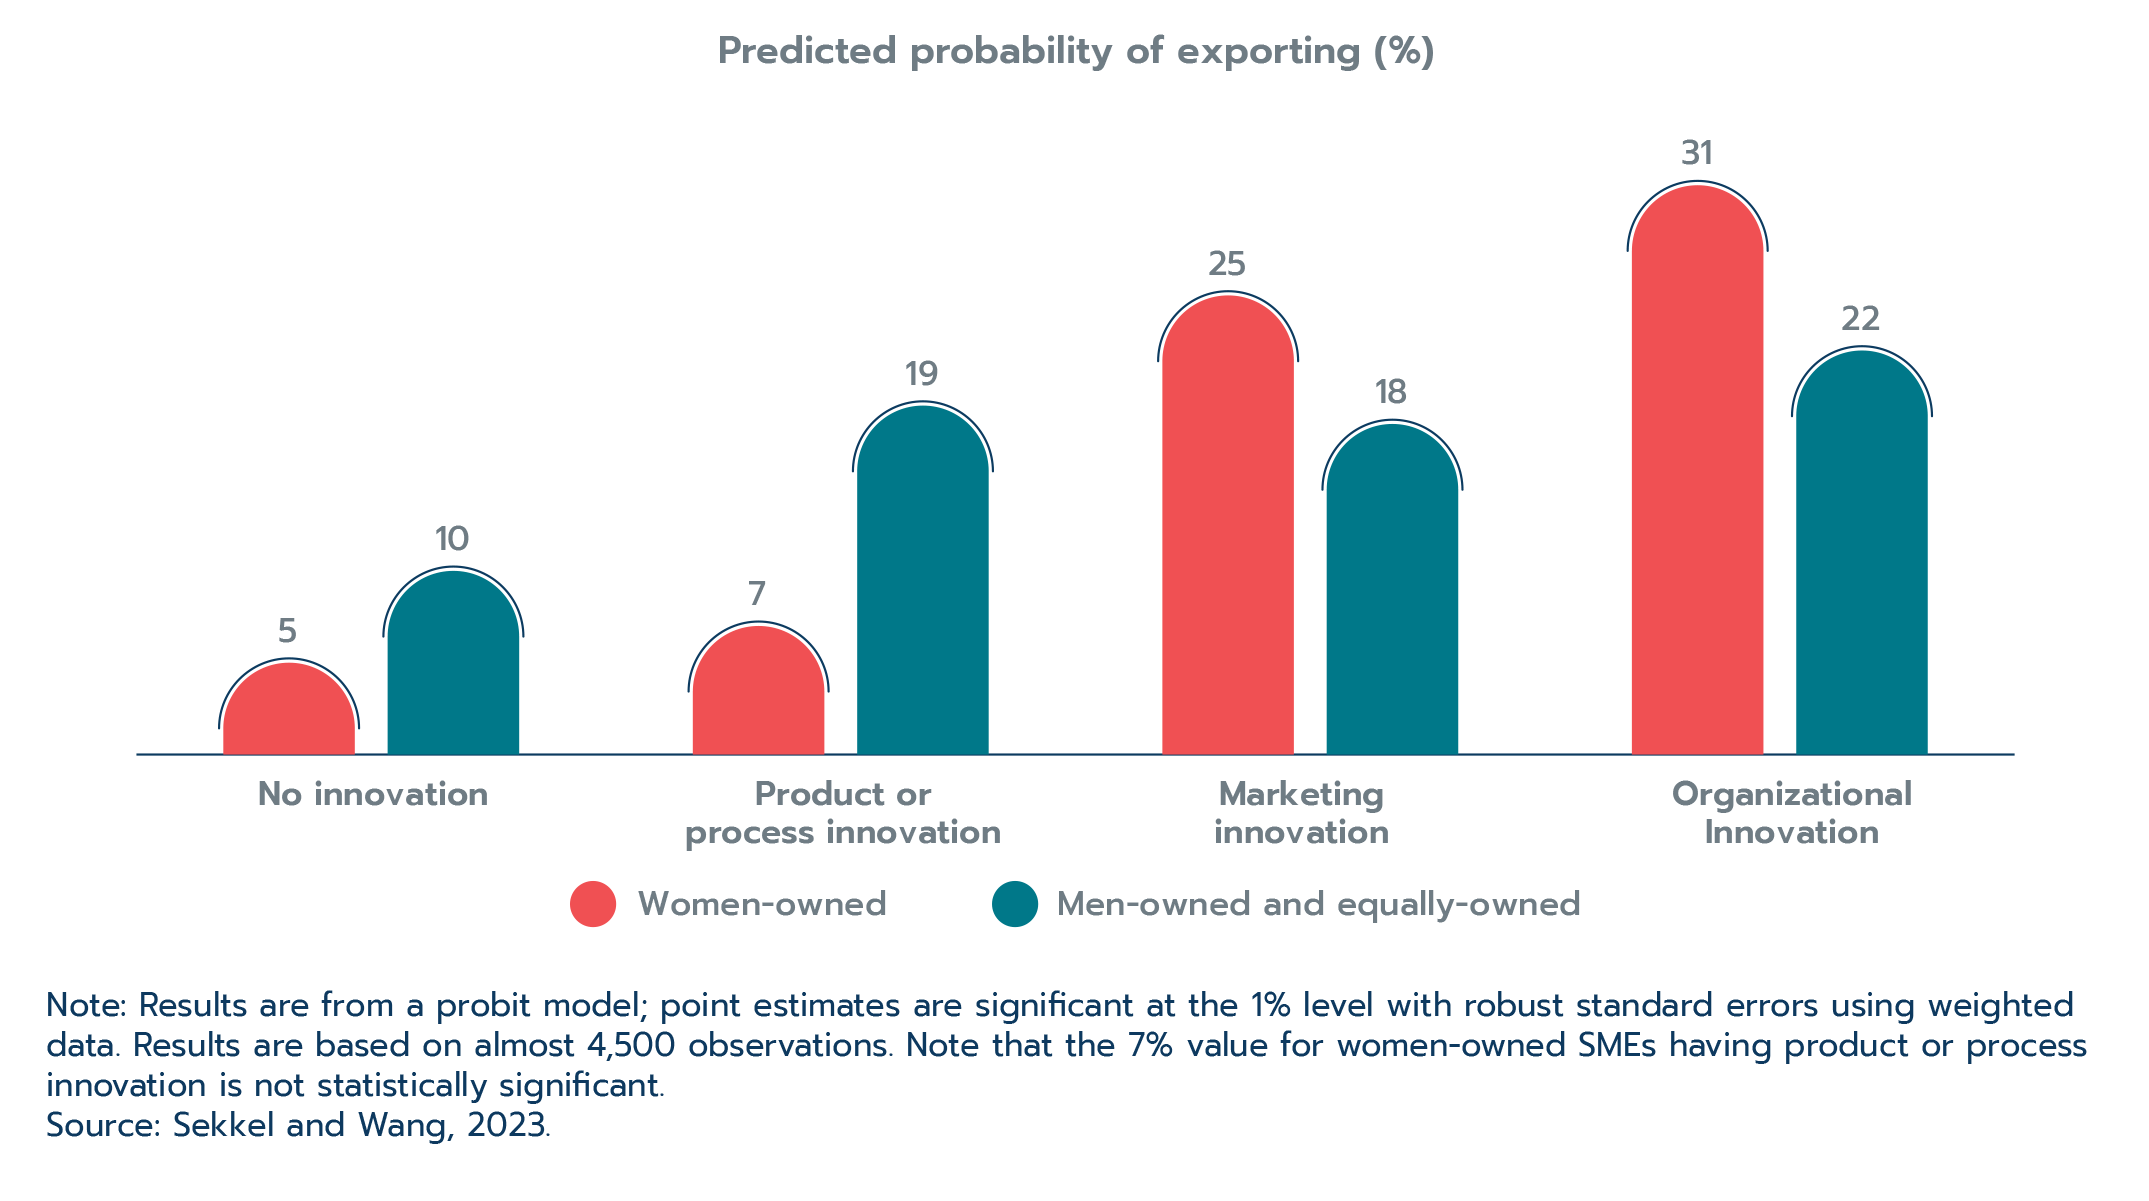
Text version
Predicted probability of exporting (%)
| Women-owned | Men-owned and equally-owned | |
|---|---|---|
| No innovation | 5 | 10 |
| Product or process innovation | 7 | 19 |
| Marketing innovation | 25 | 18 |
| Organizational Innovation | 31 | 22 |
Note: Results are from a probit model; point estimates are significant at the 1% level with robust standard errors using weighted data. Results are based on almost 4,500 observations. Note that the 7% value for women-owned SMEs having product or process innovation is not statistically significant.
Source: Sekkel and Wang, 2023.
The findings from Sekkel and Wang (2023) not only re-inforce the importance of e-commerce and innovation as enablers for women to export, they also provide evidence of the risk of neglecting to use e-commerce or to innovate. Without e-commerce and innovation, women-owned SMEs would actually be less likely than men-owned and equally-owned SMEs to export, even when controlling for firm characteristics such as size and industry.
Professional networks
Professional networks are important enablers of entrepreneurial success. These networks can help entrepreneurs access financing, find partners, employees or suppliers, generate new ideas for products, processes and business models (Halabisky, 2015). However, some international organizations report that women have lower access to traditional networks such as chambers of commerce and professional mentors (World Bank and World Trade Organization, 2020) or that they are more likely to include family and friends rather than professionals in their field (Korinek, Moïsé and Tange, 2021). There are also reports that women are more likely to leverage networks differently due to time constraints (World Bank and World Trade Organization, 2020).
There is some evidence that professional networks for women in Canada are somewhat different than for the average business owner, but no evidence that women are less likely to seek out advice. In a 2021 Canadian Survey on Business Conditions, Statistics Canada heard from almost 17,000 businesses with employees about who they would consult for advice related to opportunities or challenges over the following 12 months.
The survey found that women-owned businesses that export were less likely than average to consult mentors, employees or colleagues, professional business associations, contacts in other businesses, and even friends and family (Figure 2.26). On the other hand, they were much more likely to seek out external consultants for advice, and somewhat more likely to engage with teachers in education settings, provincial and federal government services or programs, and other sources.
While 23% of Canadian exporting firms would not expect to consult anyone for advice, only 5% of women exporters in Canada responded that they were not likely to consult anyone.
Figure 2.26: Women more likely to seek advice from external consultants

Text version
Source of advice for women-owned exporters compared to Canadian average exporters (percentage point difference)
| Percentage point difference | |
|---|---|
| External consultants | 15.3 |
| Other | 7.2 |
| Federal government services or programs | 5.2 |
| Teachers in education settings | 3.8 |
| Provincial or territorial government services or programs | 3.6 |
| Friends or family | -2.5 |
| Mentors | -4.2 |
| Contacts in other businesses | -6.3 |
| Professional business associations | -9.8 |
| Employees or colleagues | -12.8 |
| None | -17.5 |
Note: Chart includes only exporting businesses with employees. During the second quarter of 2021, exporters were asked what sources of advice they may consult in the next 12 months regarding business opportunities and challenges.
Source: Statistics Canada’s Canadian Survey on Business Conditions, second quarter of 2021 (custom data order). Calculation of the OCE.
Box 2.6: The representation of women in multinationals
Although less than 1% of firms in Canada are multinationals (MNEs), they account for one third of GDP, one quarter of jobs, and over 80% of the country ’s exports.[1] Given their importance to the Canadian economy, multinational companies play a critical role in making progress toward gender equality and contributing to inclusive trade and inclusive growth. A gender-balanced workforce provides the foundation for promoting gender equality. Better representation of women leads to increased opportunities for advancement and is key to getting more women into leadership roles and closing the gender wage gap. Multinationals in Canada, both foreign and Canadian, fare relatively well on the overall representation of women, though there is room for improvement. In 2019, 40.4% of employees in MNEs in the country were females, compared to equal representation in non-MNEs, or domestic firms. While the share of females in MNEs in Canada has remained fairly stable over the past 10 years, it has inched downwards – in 2010, it stood at 41.5%.[2] The breakdown of representation by industry reveals notable disparities. The finance and insurance industry, where two thirds of employees work in MNEs, has high female representation in its workforce. However, there are significantly fewer females employed in many industries where MNEs account for a large share of employment, such as mining and oil and gas extraction, utilities, and manufacturing (see Table 2.4). Two thirds of employees in the mining, quarrying, and oil and gas extraction industry work for MNEs, yet only 16.9% of them are females. The representation of females is higher in utilities (28.2%) where MNEs also account for two thirds of the industry’s employment, and in manufacturing (26.5%), where just over half of all employed work for MNEs. Domestic firms have similarly low representation in these industries, though fare better than MNEs with the exception of the utilities industry where they have a slightly lower share of female employees.
Table 2.4: Representation of females in industries where the majority of employment is in MNEs (2019)
| Industry | MNEs share of employment in industry (%) | Share of females employed (%) | |
|---|---|---|---|
| MNEs | Non-MNEs | ||
| Finance and insurance | 66.2 | 55.2 | 63.2 |
| Mining, quarrying, and oil and gas extraction | 66.1 | 16.9 | 18.2 |
| Utilities | 65.8 | 28.2 | 26.2 |
| Information and cultural industries | 60.3 | 36.6 | 44.6 |
| Manufacturing | 51.6 | 26.5 | 29.6 |
| Canadian economy average | n/a | 40.4 | 50.0 |
Source: Statistics Canada, custom order data. Calculation of the OCE.
While the share of females in the workforce is an essential measure of inclusiveness, additional data are needed to get a complete picture of labour market outcomes. To truly understand how women in MNEs fare, we need information on the roles they play in these firms and whether or not they are being fairly compensated for their work. Unfortunately, gender-disaggregated data on wages in MNEs are not yet available, nor are data on the share of women in senior management positions, a reflection of influence in the workplace.
The representation of women on boards is an additional measure of women’s opportunities to contribute to strategic decisions in firms. There is much progress to be made on this front. The latest available data reveal that women are significantly underrepresented, making up just 17.5% of boards of directors in MNEs in Canada in 2018.[3]
[1] Source: Calculation of the OCE based on data from Statistics Canada’s Table 36-10-0356-01, Retrieved March 7, 2023.
[2] Source: Calculations of the OCE based on custom order data from Statistics Canada.
[3] Source: Statistics Canada, custom order data.
2.5 Hearing from Indigenous exporters
Indigenous Peoples established and employed extensive trade networks across what is now North America since long before European settlers arrived. However, very little research has been done to understand the current-day experiences of Indigenous exporters, including both their challenges, enabling factors and effective supports.
The Office of the Chief Economist (GAC) partnered with the Canadian Council for Aboriginal Business (CCAB) to deepen our understanding of Indigenous exporters’ experiences. Our collaborative work aims to improve policy and programming to help Indigenous businesses succeed internationally, ultimately supporting the inclusion and participation of Indigenous Peoples in Canada’s shared prosperity.
The first CCAB-GAC co-authored study was published in 2019 in a report titled Indigenous-Owned Exporting Small and Medium Enterprises in Canada. It investigated the export experiences of Indigenous businesses, providing an initial understanding of the characteristics and challenges of these exporters (Bélanger Baur, 2019a). The findings gleaned from the 2019 report set the stage for more recent work examining these experiences in more depth with focused survey questions, a larger and more broadly-based survey sample, and an enhanced survey weighting approach, making it a significant improvement over the 2019 project.
The CCAB-GAC national Indigenous business survey heard from more than 2,600 First Nations, Métis, and Inuit-owned businesses in every province and territory in mid-2021. Most of these businesses were SMEs, and the survey heard from an estimated 14.1% of the 11,900 Indigenous businesses with employees in Canada.Footnote 11 This larger initiative was coupled with in-depth interviews with businesses and key stakeholders from three Indigenous communities in late 2022 to hear the voices of people that may not always be captured by traditional surveys.
Indigenous firm characteristics and export experience
The CCAB-GAC national Indigenous business survey found that 7.2% of Indigenous-owned SMEs exported in 2020, a lower rate than the Canadian average of 12.1%Footnote 12 (Figure 2.27). The Office of the Chief Economist is co-authoring two updated reports with the CCAB, exploring the factors that contribute to these differences, while drawing a portrait of Indigenous exporters and their international markets.
Figure 2.27: Indigenous-owned SMEs export at lower rates
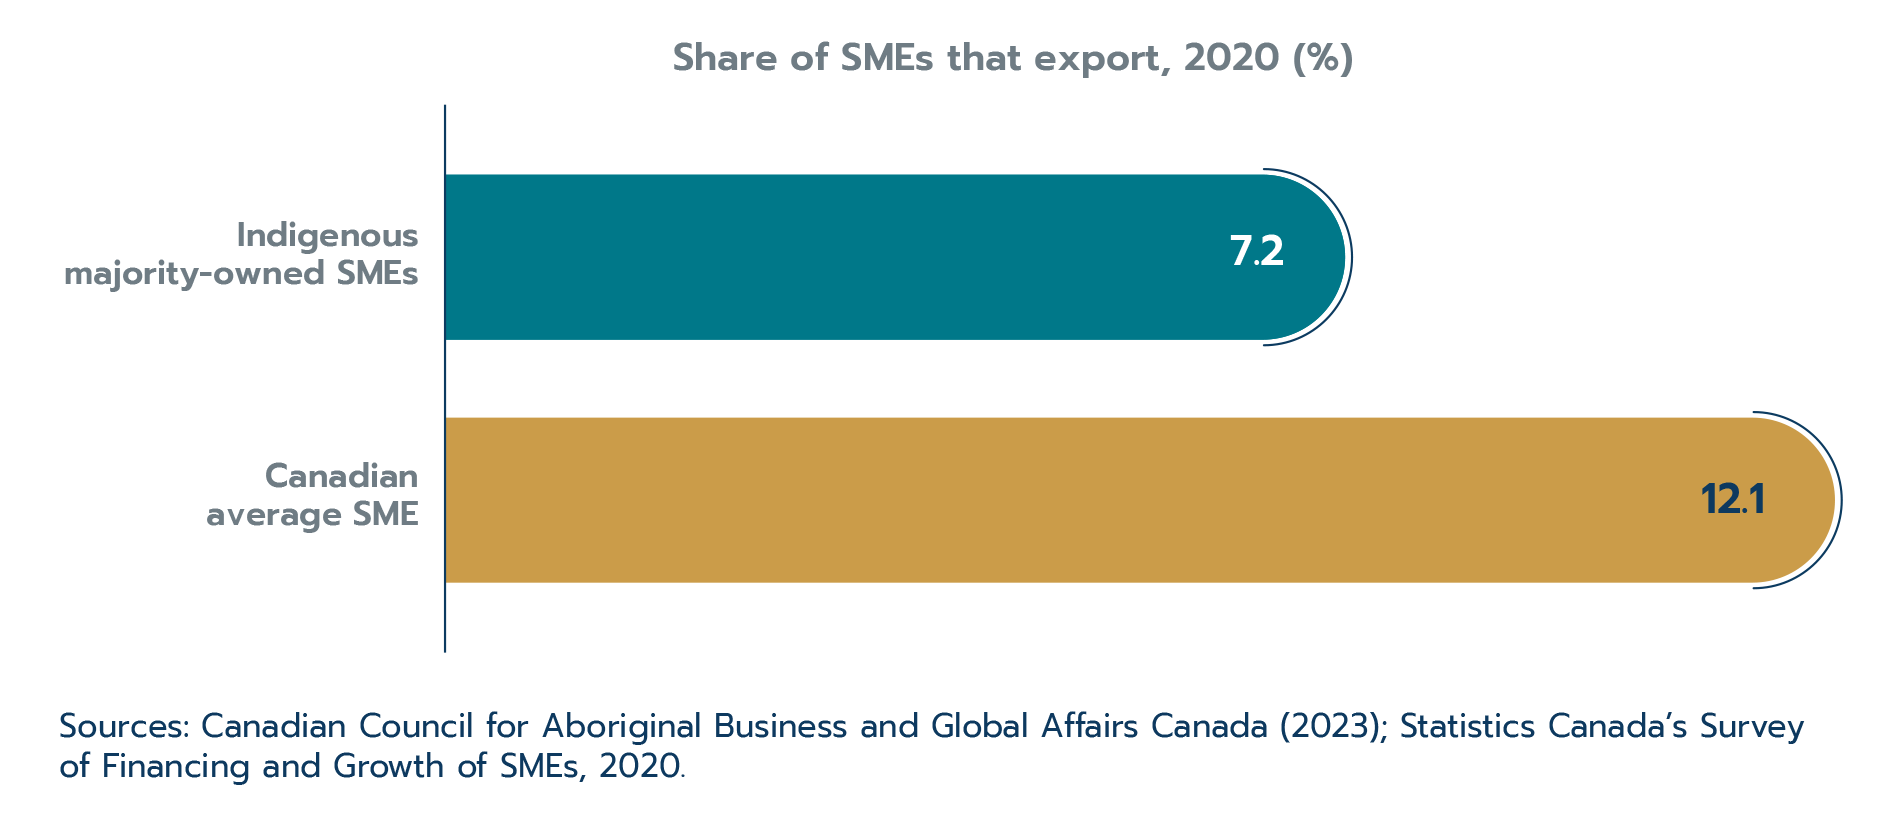
Text version
Share of SMEs that export, 2020 (%)
Indigenous majority-owned SMEs: 7.2
Canadian average SME: 12.1
Sources: Canadian Council for Aboriginal Business and Global Affairs Canada (2023); Statistics Canada’s Survey of Financing and Growth of SMEs, 2020.
The reports share what we heard from businesses about their export experiences, challenges and recommendations for supports. The results from these reports are summarized in this section.
Indigenous-owned SMEs generally have an industry mix similar to the Canadian average, with some notable differences. Indigenous firms are comparatively more likely to be found in:
- arts, entertainment and recreation services
- accommodation and food services
- information and cultural industries
- mining and oil and gas extraction industries
They are notably less present in traditionally export-intensive wholesale trade, and transportation and warehousing industries.
However, the export propensities of Indigenous firms tend to be lower than the Canadian average in most industries. For example, 3.9% of Indigenous SMEs in the natural resources sector (e.g. agriculture, forestry, mining and oil and gas extraction industries) exported compared to the Canadian average of 10.7% for this sector. In many cases, Indigenous-owned SMEs provide services to larger firms that export, making them an important part of exporters’ supply chains even though they do not export directly.
Women are highly represented in the Indigenous entrepreneurship and exporter population. Some 39.3% of Indigenous SME exporters are majority-owned by women compared to the Canadian average of 14.5% (Figure 2.28). Moreover, Indigenous women-owned SMEs tend to export at similar rates as Indigenous men-owned SMEs, which was supported in the findings of our statistical model.
Figure 2.28: Women are well-represented among Indigenous exporters

Text version
Share of SME exporters, by gender of ownership (%)
| SME exporter | Women majority-owned | Equally- owned | Men majority-owned |
|---|---|---|---|
| Indigenous SME exporters | 39.3% | 12.6% | 48.0% |
| Canadian SME exporter average | 14.5% | 14.5% | 70.9% |
Source: Canadian Council for Aboriginal Business and Global Affairs Canada, 2023, and Statistics Canada’s Survey on Financing and Growth of SMEs, 2020.
Geography plays a role in firms’ abilities to reach foreign markets. Being physically close to foreign markets and ports, and being able to access transportation infrastructure such as rail, ports and highways can be critical for exporting firms. Moreover, urban centres can allow businesses to tap into larger labour pools. While remotely-located firms may face some lower costs (e.g. property), they can pay a premium to access distant markets, which can limit their economic activity.
Unsurprisingly, Indigenous SME exporters are much more likely to be in urban areas, smaller cities and connected towns, with only 11.6% of exporters located in remote regions. Comparatively, Indigenous non-exporters are much more evenly distributed across the reports’ three “remoteness” groupings, with more than one-third located in remote regionsFootnote 13. As such, only 2.6% of Indigenous SMEs in remote regions export, compared to 11.7% of Indigenous SMEs in urban areas—a rate closer to the Canadian SME average. Unfortunately, comparable export data for remote Canadian SMEs do not exist, but one measure of rural-based Canadian SMEs estimates that they export at roughly two-thirds the rate of urban-based SMEs;Footnote 14 using this measure as a point of comparison, remoteness appears to be associated with much lower rates of export for Indigenous SMEs.
Being located in Indigenous communities can impact business operations (Indigenous communities include First Nations reserves, and Métis and Inuit Nunangat communities). Indigenous SMEs located in Indigenous communities are less likely to export (3.9%) than those based outside of Indigenous communities (11.7%).
A number of reasons for this are explored in our reports, but in summary, the Indian Act impacts on-reserve property rights, taxation, regulation and infrastructure environments. These environments affect businesses that operate on reserves, both by creating challenges for building and transferring wealth and acquiring collateral to obtain financing, and also, in some cases, by shifting business priorities and mandates as communal ownership incentivizes increased focus on serving local communities (The National Aboriginal Economic Development Board, 2013; Organisation for Economic Cooperation and Development, 2020).
Factors associated with Indigenous export activity
As part of our work, we constructed a model that identifies factors associated with the odds of exporting for Indigenous SMEs, including industry, size, location, and use of virtual sales.
Unsurprisingly, industry is an important factor for exporting activity. Indigenous SMEs in the following industries have considerably higher odds of exporting than Indigenous SMEs in accommodation and food services (the base group used for comparison purposes):
- manufacturing
- arts, entertainment and recreation
- agriculture, forestry, fishing, and hunting
- mining, quarrying and oil and gas extraction
- professional, scientific, and technical services
Being located in an Indigenous community (e.g. a First Nations reserve) was a significant factor in a firm’s odds of exporting; however, remoteness explains much of this effect. Being located in a remote region is associated with a 65.0% reduction in a firm’s odds of exporting, while being located in an Indigenous community is associated with a 42.0% reduction (Figure 2.29). Roughly one-quarter of Indigenous SMEs are located in both remote regions and Indigenous communities, and are thus more likely to be affected by these compounding geographic and location factors in their decision and ability to export.
Figure 2.29: Statistically significant factors associated with odds of exporting for Indigenous-owned SMEs
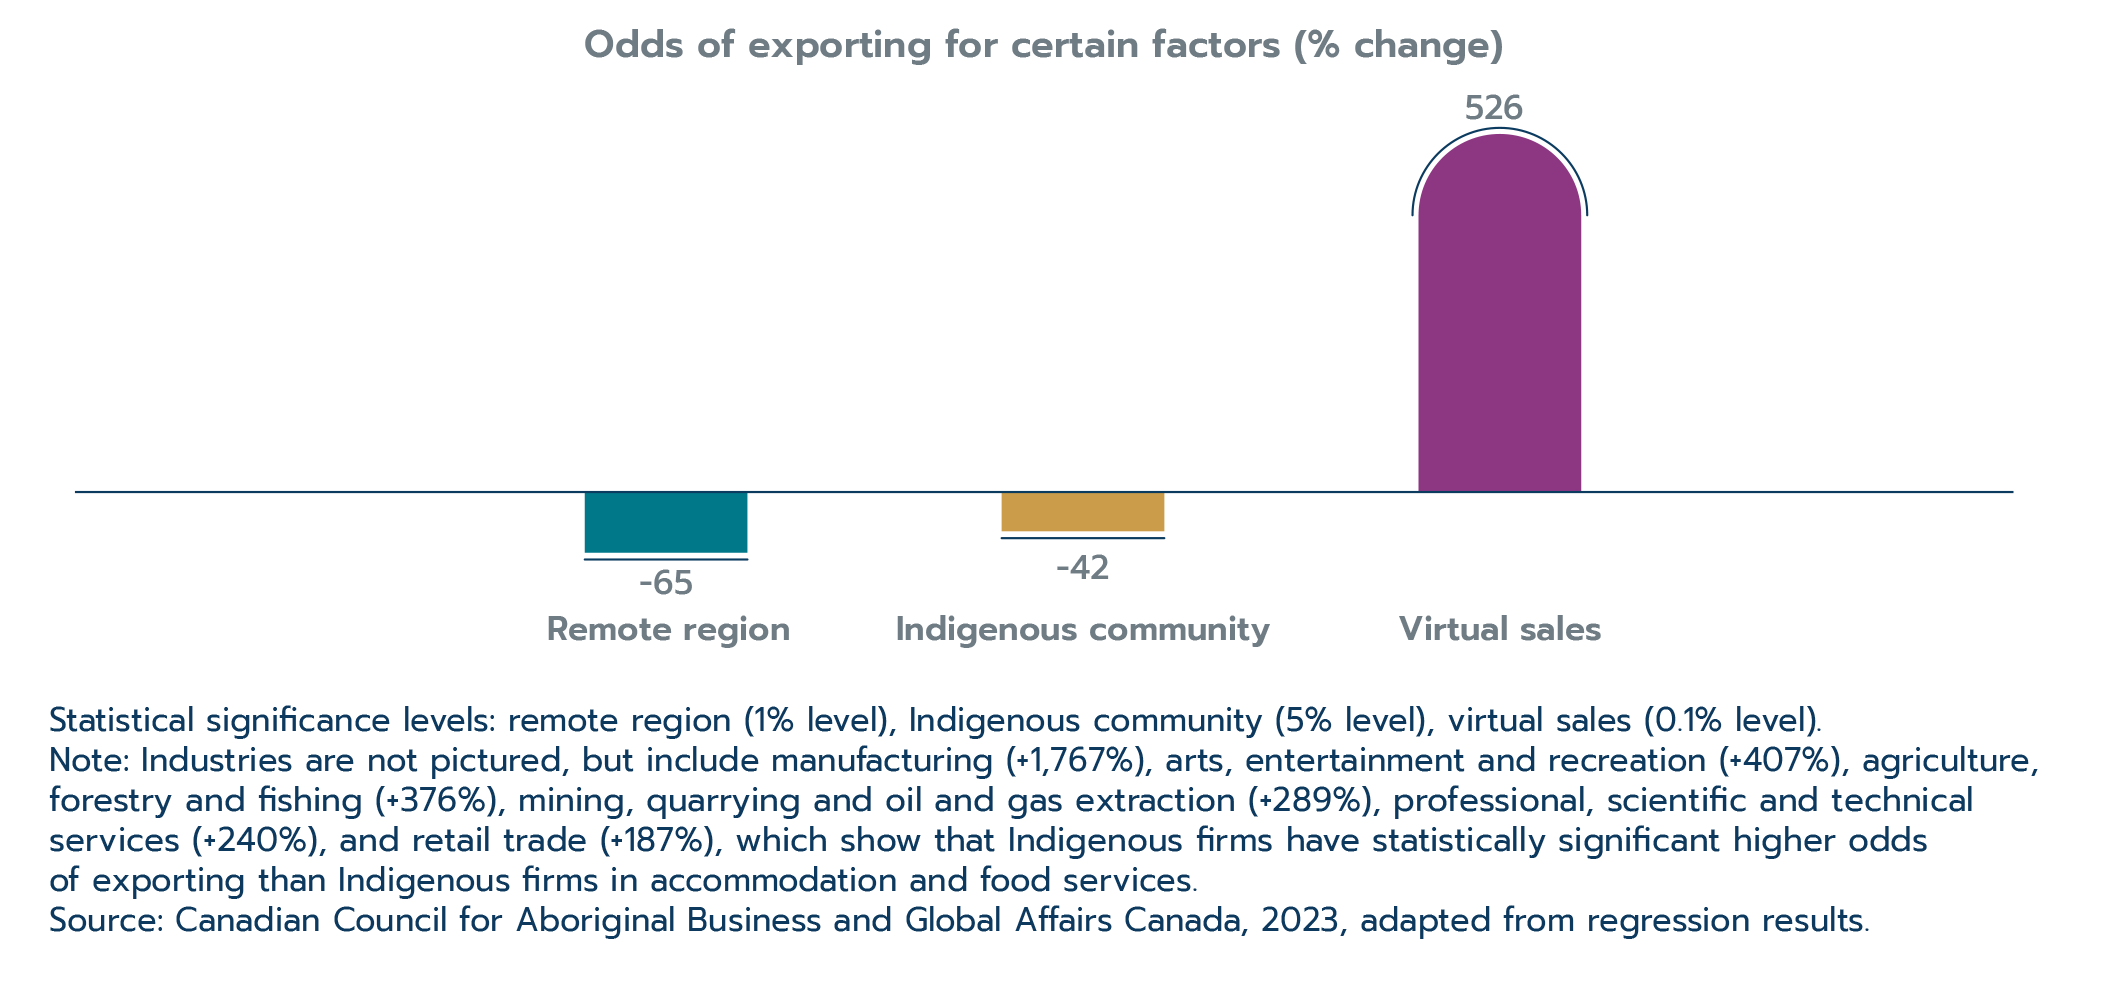
Text version
Odds of exporting for certain factors (% change)
Remote region: -65%
Indigenous community: -42%
Virtual sales: +526%
Statistical significance levels: remote region (1% level), Indigenous community (5% level), virtual sales (0.1% level).
Note: Industries are not pictured, but include manufacturing (+1,767%), arts, entertainment and recreation (+407%), agriculture, forestry and fishing (+376%), mining, quarrying and oil and gas extraction (+289%), professional, scientific and technical services (+240%), and retail trade (+187%), which show that Indigenous firms have statistically significant higher odds of exporting than Indigenous firms in accommodation and food services.
Source: Canadian Council for Aboriginal Business and Global Affairs Canada, 2023, adapted from regression results.
Virtual sales are important for Indigenous exporters, with 80.3% of exporting firms having online sales compared to just 27.5% of non-exporting Indigenous SMEs. Our model reveals that firms that offer virtual sales are associated with 6 times higher odds of exporting when compared to firms without virtual sales. Remotely-located firms made up a larger percentage of firms that offer virtual sales to reach customers (34.2%) than Indigenous SMEs in urban areas (28.0%).
Meanwhile, firm size was not a statistically significant factor in the odds of exporting. This is in itself an unusual finding; as discussed in Section 2.2, the probability of exporting normally increases with firm size, because larger firms can have the resources needed to overcome the costs of exporting.
Another factor that did not have a statistically significant link with the odds of exporting was the gender of the business owner. Indigenous SMEs majority-owned by women did not have higher or lower odds of exporting when compared to men-owned Indigenous SMEs; this is consistent with findings for Canadian SMEs overall (Sekkel and Wang, 2023).
Targeted export markets—high interest in Oceania
Indigenous SMEs export to markets all over the world. While the U.S. is the market of choice for the majority of SME exporters (Indigenous and non-Indigenous alike), Indigenous businesses tend to be more interested in doing business in Oceanic destinations (i.e. Australia and New Zealand) relative to the Canadian average.
Australia was the third most popular international destination market for Indigenous goods and services, with 16.1% of exporters mentioning it as a destination, possibly due to the high value placed on Indigenous products or a shared interest in supporting Indigenous businesses (Figure 2.30).
Australia is an especially popular destination for Indigenous SMEs engaged in the arts, entertainment and recreation, retail trade, and professional, scientific and technical services industries. Australia is not normally a top destination for Canadian exporters; less than 8% of Canadian SMEs who export goods target Australia (the figure for services exporters is unknown).
Figure 2.30: Top 12 international destination markets for Indigenous goods and services exporters, 2020
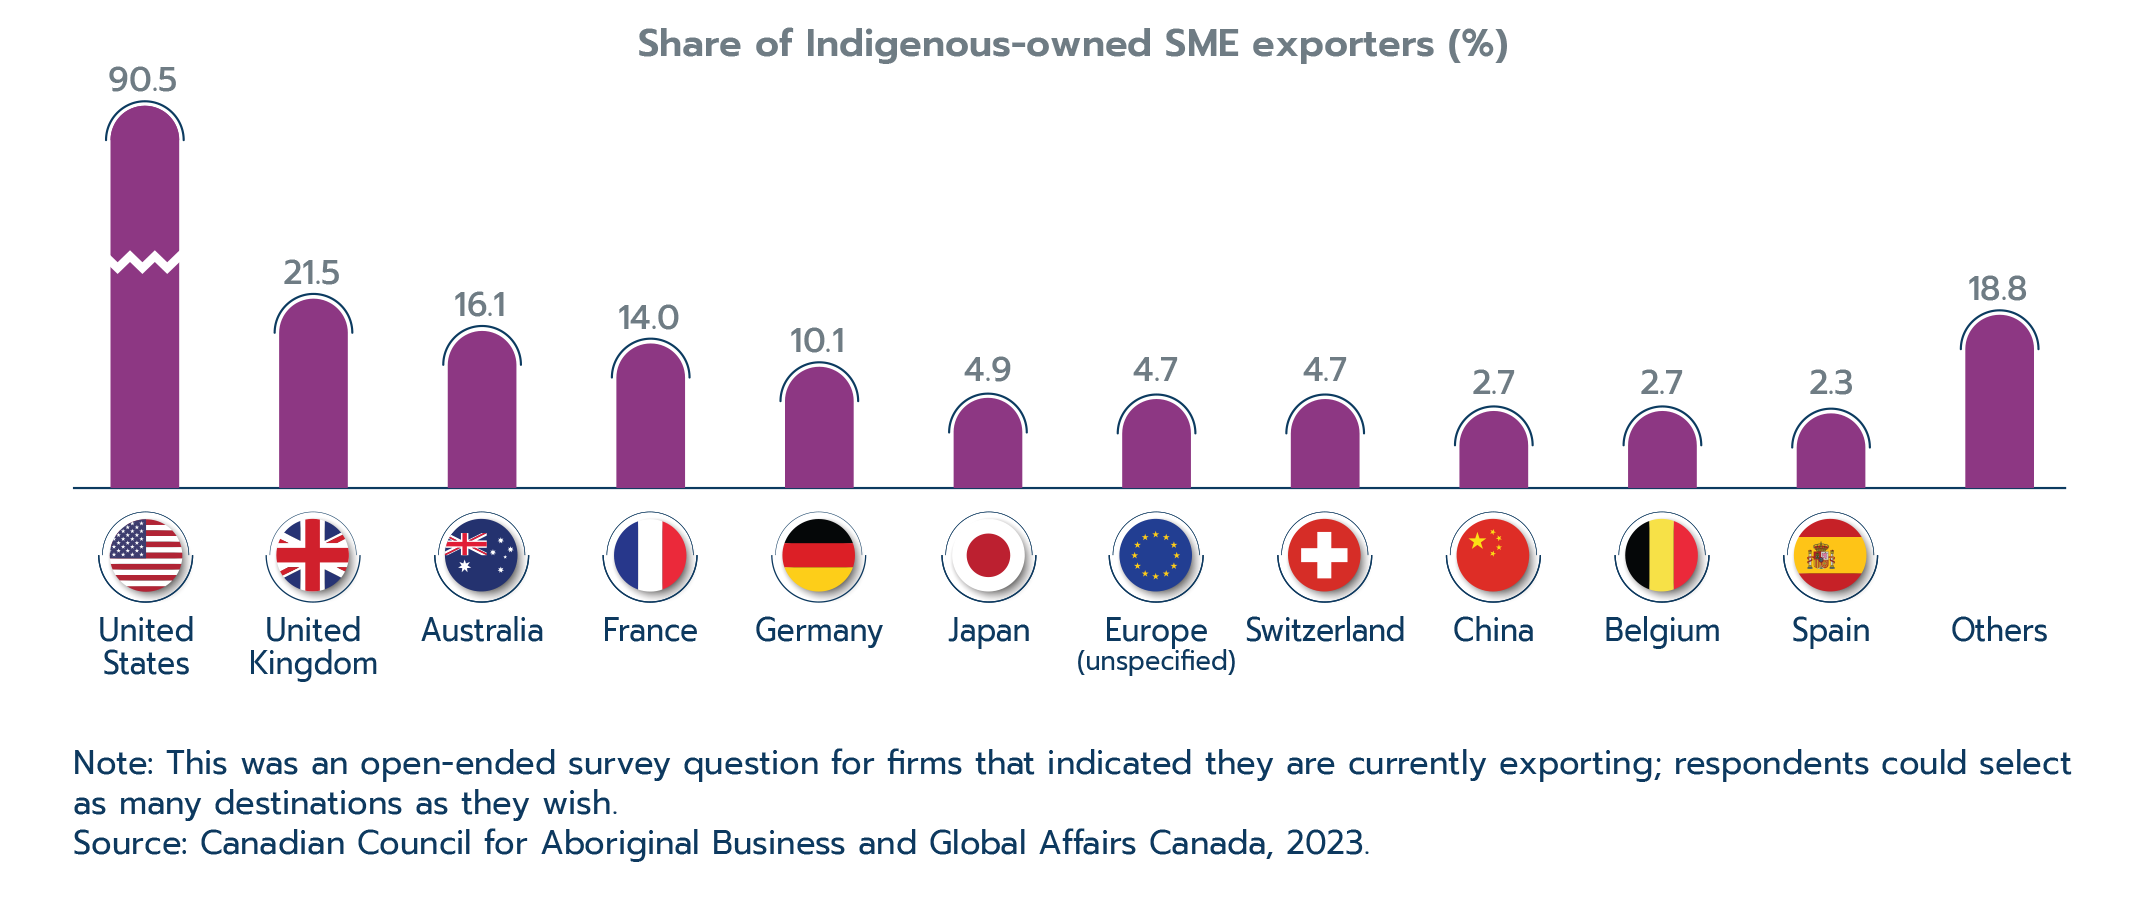
Text version
Top 12 international destination markets for Indigenous goods and services exporters, 2020
| Country | Share of Indigenous-owned SME exporters (%) |
|---|---|
| United States | 90.5 |
| United Kingdom | 21.5 |
| Australia | 16.1 |
| France | 14.0 |
| Germany | 10.1 |
| Japan | 4.9 |
| Europe (unspecified) | 4.7 |
| Switzerland | 4.7 |
| China | 2.7 |
| Belgium | 2.7 |
| Spain | 2.3 |
| Others | 18.8 |
Note: This was an open-ended survey question for firms that indicated they are currently exporting; respondents could select as many destinations as they wish.
Source: Canadian Council for Aboriginal Business and Global Affairs Canada, 2023.
There is a notable interest in starting to export among Indigenous SMEs that are not currently exporting. Indigenous SMEs are four times more likely to report plans to start exporting (16.3%) than the Canadian average (3.8%). The U.S. is the most popular market for Indigenous SMEs planning to start exporting, followed by Germany, the United Kingdom, France, and Europe (unspecified markets). These are in-line with the target markets mentioned for the average Canadian SME (Statistics Canada, 2022).
However, unlike the average Canadian SME, Australia is also a significantly more popular target market for Indigenous SMEs that wish to start exporting: 18.8% of respondents listed Australia as an intended destination market. New Zealand also appeared in the top 10 target markets, with 9.6% of firms reporting interest in expanding there. The top three industries for Indigenous SMEs that currently do not export but plan to start exporting are accommodation and food services (17.6%), professional, scientific and technical services (17.4%), and arts, entertainment and recreation (13.2%).
Entrepreneurs report obstacles to business growth and exporting
The 2020 CCAB-GAC national survey asked Indigenous business owners to share the challenges they face in growing their businesses and exporting. Unsurprisingly, the top answer to both of those questions related to the economic conditions prevailing in the context of the pandemic.
More than 60% of Indigenous SMEs indicated that economic conditions are a challenge to growth, while two-thirds of exporters cited the impacts of the pandemic specifically as a moderate or major barrier to exporting. There is no doubt that the pandemic made business operations particularly challenging, with one-quarter of Indigenous SMEs reporting net losses in 2020 (both exporters and non-exporters). (Canadian Council for Aboriginal Business and Global Affairs Canada, forthcoming).
Another top-cited obstacle to business growth was the difficulty of attracting employees with the right skills or qualifications (reported by 61.8% of SMEs). It is quite striking to see this challenge ranked so high on the list, and it highlights the complexities of business growth requiring specialized skills. This may be particularly difficult for businesses located in smaller communities and remote regions which do not have a large labour pool to draw from. In fact, this was the top challenge for businesses located in remote regions, with 66.5% citing it as a significant obstacle to business growth. It was also the second most common obstacle cited by 59% of businesses located in urban areas or semi-connected towns (the top challenge being overall economic conditions).
Business costs were also a highly reported challenge, with more than half of all businesses citing them as a significant obstacle to business growth; though inflation overall wasn’t yet a major concern in 2020, there were substantial price increases in food and transportation categories that may have started impacting businesses’ bottom lines at the time of the survey (Statistics Canada, 2023a). Moreover, supply chain challenges had surfaced, raising shipping costs and scarcity (or creating major delays) for required inputs.
Financing and infrastructure were also mentioned as significant challenges to growth. Access to equity or capital (more than 40% of firms) and access to financing (almost 40%) may have been driven in part by pandemic-related challenges, but they were also cited by more than one-third of businesses in our 2019 study (Bélanger Baur, 2019a).
The top-cited infrastructure challenge was digital in nature, with almost 40% of businesses saying they lacked access to reliable internet, telephone or other information technologies; this is particularly notable in light of our analysis that shows how important virtual sales are for exporting. Physical infrastructure challenges, including electricity, water and roads, were cited as obstacles to growth by around 26% of Indigenous SMEs.
Many of the challenges cited were dependent on the business’ location. Notably, the share of firms that reported digital infrastructure as a challenge was more than 12 percentage points higher among firms located in Indigenous communities (43.2%) than those outside of Indigenous communities (30.8%). Remotely-located firms were also much more likely to cite this challenge (46.1%) compared to urban firms (30.9%), highlighting the differences in access to high-quality digital infrastructure. A similar trend was observed for remote and Indigenous community-based firms in citing physical infrastructure challenges such as roads, water and electricity.
The survey asked Indigenous exporters (including those that exported in the past, but had stopped) to rate various export challenges. Following the impacts of the pandemic, the top export obstacles were logistical in nature, such as distance to customers, transportation costs and brokerage fees, with almost half of all Indigenous SME exporters citing them as a moderate or major export challenge (Figure 2.31). Given that many Indigenous businesses are located outside of major urban centres, and that physical infrastructure has been cited as an obstacle to business growth by around one-quarter of Indigenous SMEs, it is not surprising to see these factors among the top export challenges.
Figure 2.31: Indigenous-owned SMEs’ obstacles to exporting
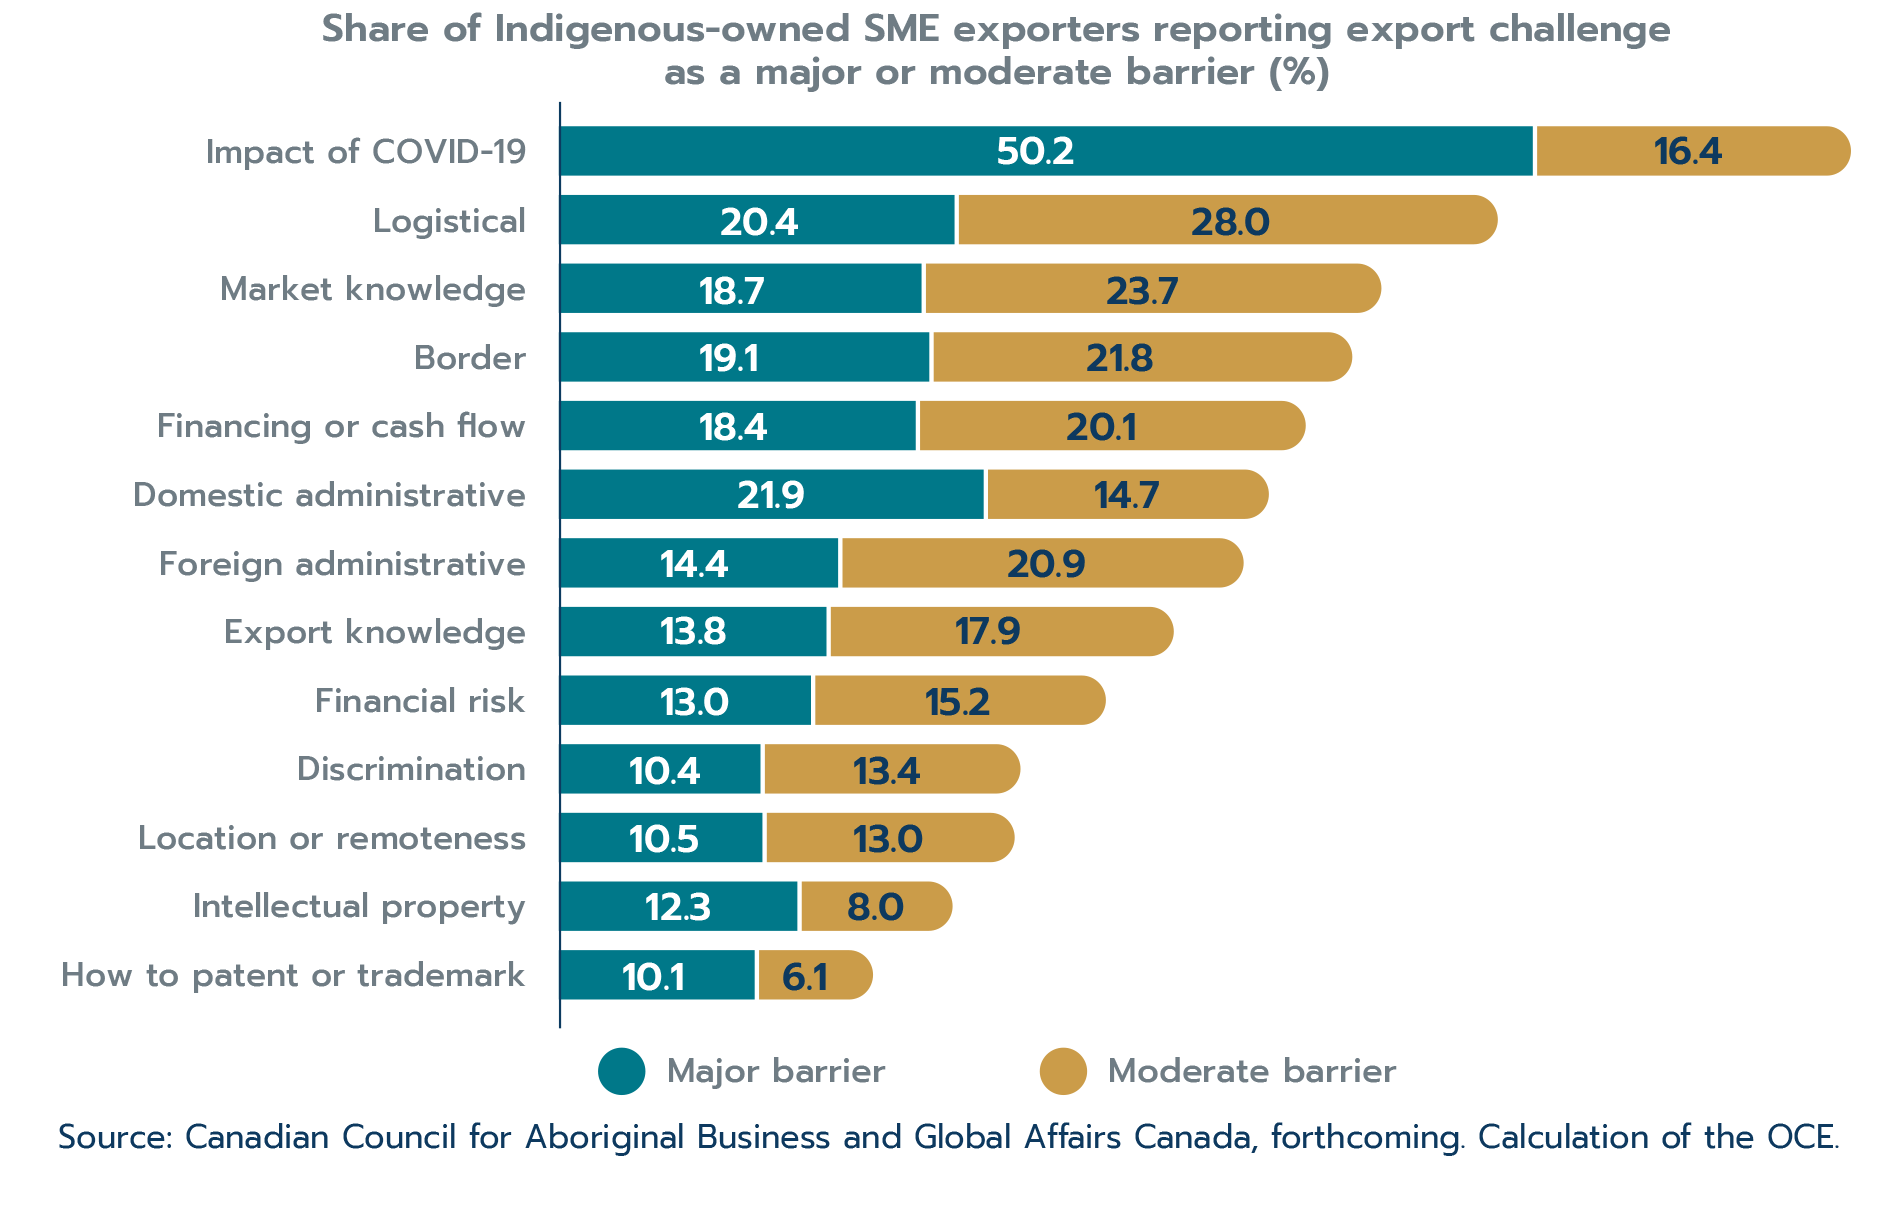
Text version
Share of Indigenous-owned SME exporters reporting export challenge as a major or moderate barrier (%)
| Challenge | Major barrier | Moderate barrier |
|---|---|---|
| Impact of COVID-19 | 50.2 | 16.4 |
| Logistical | 20.4 | 28.0 |
| Market knowledge | 18.7 | 23.7 |
| Border | 19.1 | 21.8 |
| Financing or cash flow | 18.4 | 20.1 |
| Domestic administrative | 21.9 | 14.7 |
| Foreign administrative | 14.4 | 20.9 |
| Export knowledge | 13.8 | 17.9 |
| Financial risk | 13.0 | 15.2 |
| Discrimination | 10.4 | 13.4 |
| Location or remoteness | 10.5 | 13.0 |
| Intellectual property | 12.3 | 8.0 |
| How to patent or trademark | 10.1 | 6.1 |
Source: Canadian Council for Aboriginal Business and Global Affairs Canada, forthcoming. Calculation of the OCE.
Market knowledge issues such as lack of knowledge of local language and culture, or lack of awareness of potential export markets were cited as major or moderate barriers by 42.4% of Indigenous SME exporters. These challenges can be targeted with trade programs, such as the Trade Commissioner Service (TCS), which provides advice and support to exporters.
Border obstacles such as tariffs, non-tariff barriers, import quotas, customs duties and border security issues, were cited by 40.9% of Indigenous exporters as being moderate or major barriers. Canada’s trade policies can also target these border obstacles by reducing or eliminating them through initiatives such as free trade agreements (FTAs).
Box 2.7: Export Development Canada’s innovative financing solutions for Indigenous businesses
Access to financing and cash flow are recurring challenges reported by Indigenous-owned SMEs. The pandemic further emphasized how prevalent financial challenges are (Canadian Council for Aboriginal Business, 2022). In 2020, Indigenous people were more likely to use personal financing, financing from friends and relatives, or government loans, grants, or subsidies to start their business, and less likely to use credit from financial institutions, capital leasing or investments from angel investors or venture capital sources than the average Canadian entrepreneur (Statistics Canada, 2022).
Recognizing these different funding and export challenges, Export Development Canada (EDC) developed an Indigenous strategy that focuses on creating equitable access to its products (such as financing and insurance), and flexible lending practices that recognize the unique challenges, business structures, and financial obstacles faced by the Indigenous business community. This strategy is centered on financing and insurance products, and also seeks to build knowledge and create connections, regardless of Indigenous businesses’ existing experience in international trade. EDC also works with indirect exporters who are part of the export supply chain (i.e. firms that supply goods or services to exporting firms).
To help address the financing challenges facing many Indigenous firms, EDC engages with financial institutions to increase Indigenous firms’ access to capital and financial programs to support export growth. EDC works with financial institutions to provide risk-sharing loan guarantees to Indigenous businesses.
By sharing the risk with EDC, banks can increase their loan facility, extend lines of credit or margin international assets or inventory for Indigenous business clients. Risk sharing arrangements can also be structured through EDC’s credit insurance, which can be leveraged as collateral for traditional bank lines of credit. Therefore, not only can Indigenous businesses insure themselves against non-payment, they also have increased access to financing to enable international expansion.
Export enablers
Understanding why businesses start exporting can shed light on their motivations and export objectives, which helps to craft targeted programs to support their efforts. Interestingly, the most common reason why Indigenous-owned SMEs become exporters is simply that they were approached by customers or clients located outside of Canada (37.4% of exporters cited this reason); indeed, exporting as a result of being approached was twice as common as being motivated to expand one’s customer base (18.2% of exporters) or wanting to increase sales or revenues (another 18.1%). While no comparable data are available, there is no reason to believe these motivations are distinct from those of Canadian SME exporters in general.
However, the fourth most frequent reason why Indigenous SMEs began exporting is unique—11.3% indicated that they began exporting because customers were interested in products or services from Indigenous businesses. These firms are mostly found in the arts, entertainment and recreation (26.1%), information and cultural (21.7%), and manufacturing industries (21.0%), and they export to the U.S., Europe and Oceania. More information is needed to determine whether these exports were driven by customer tastes, supplier diversity programs, or other factors.
The CCAB-GAC national Indigenous survey asked firms that either export, or intend to, how helpful various supports would be in improving their ability to export (Figure 2.32). Helping to make connections with Indigenous clients or partners had the highest share of businesses deeming it “very helpful” (63.0%). In fact, the top five supports all had to do with making business connections or financing.
Organizations offering supports to Indigenous exporters need to take note of the unique recommendation for Indigenous-to-Indigenous connections, and the importance placed on it.
Figure 2.32: Export supports for Indigenous businesses
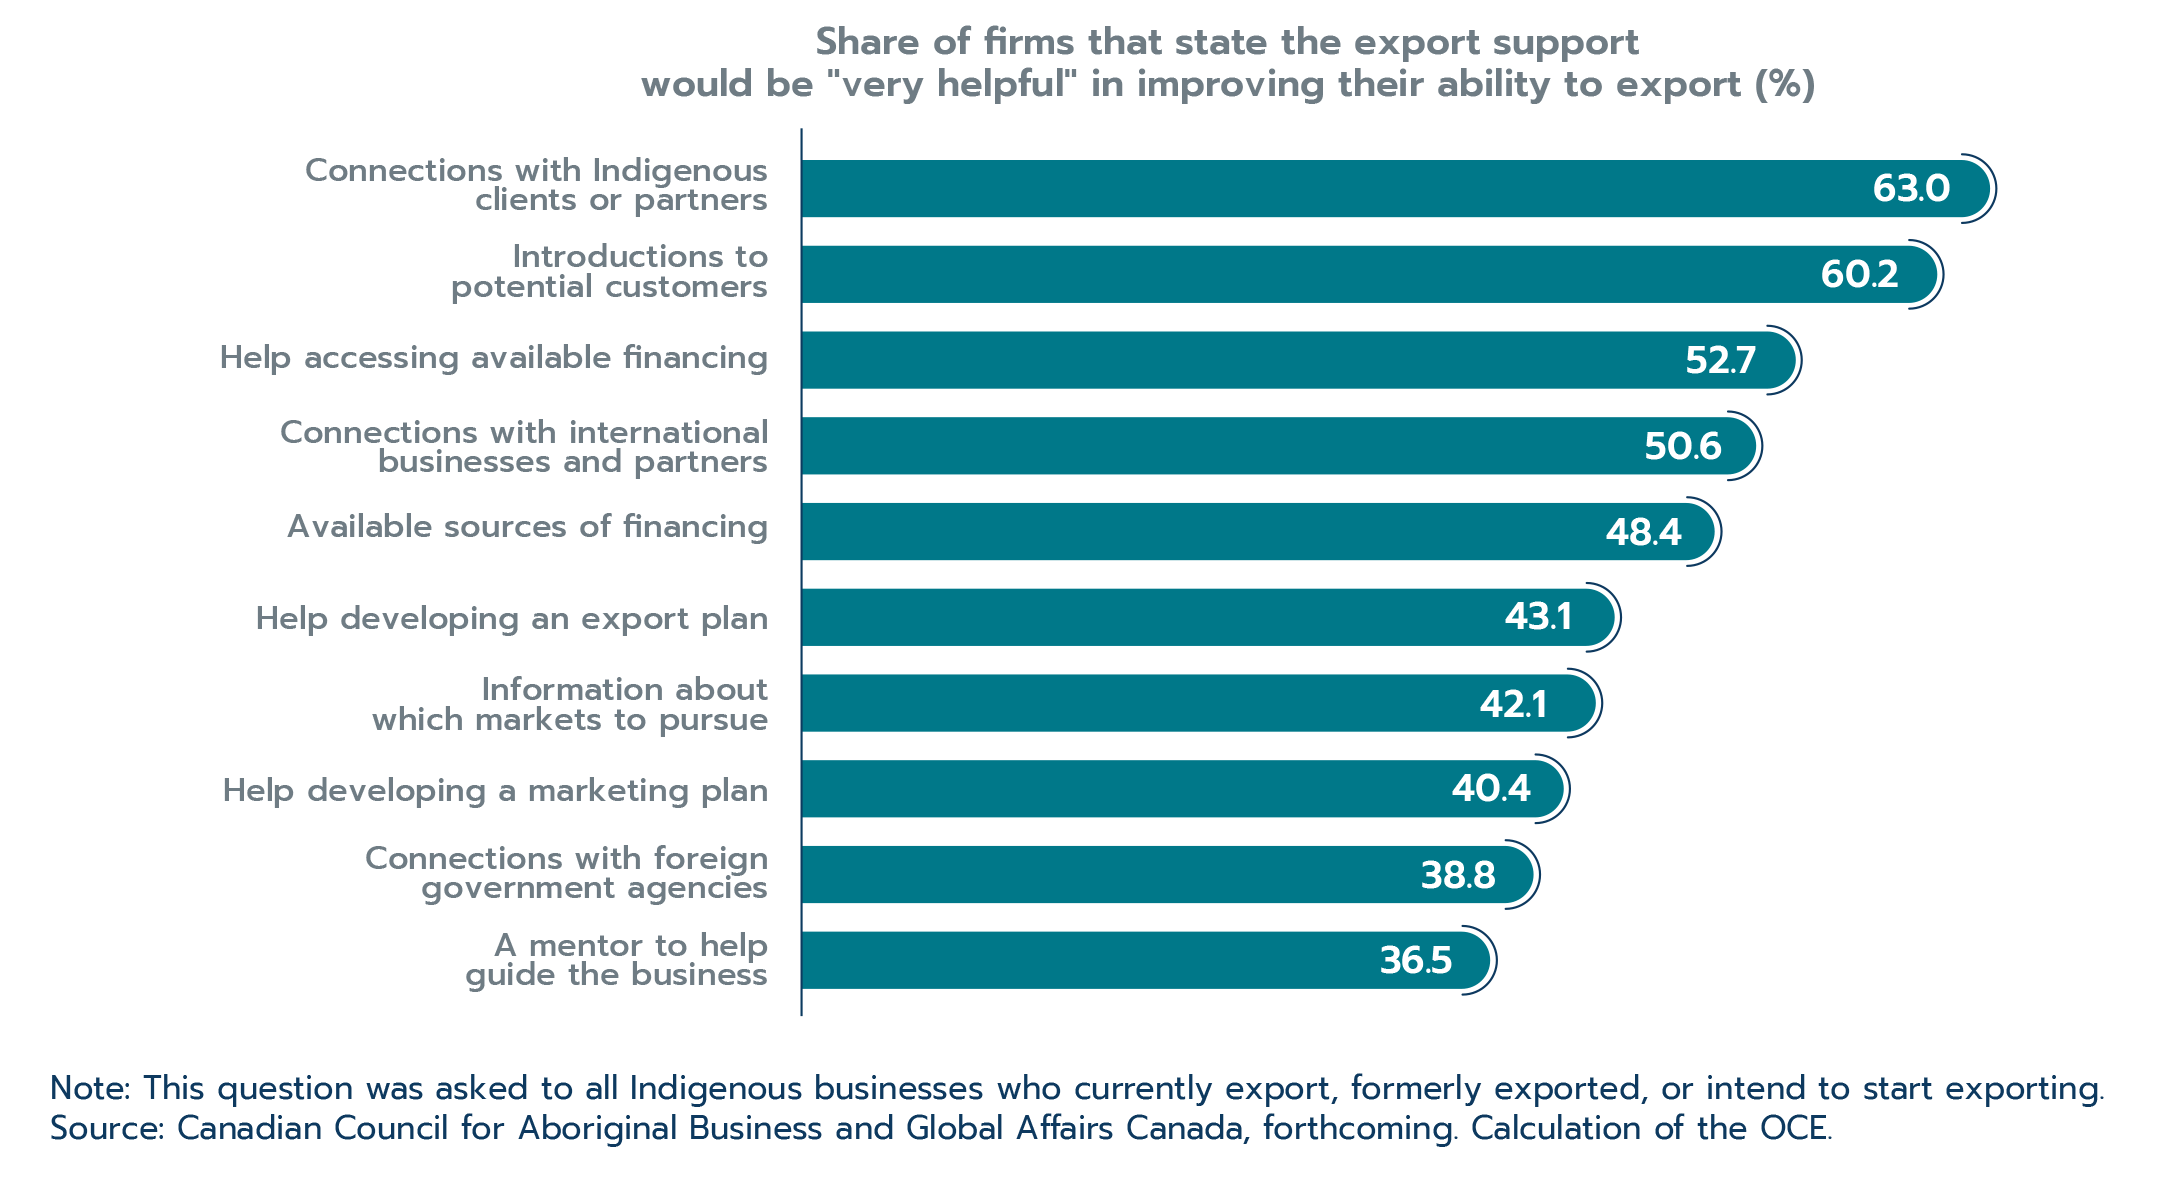
Text version
Share of firms that state the export support would be "very helpful" in improving their ability to export (%)
| Usefulness of export supports | % of firms |
|---|---|
| Connections with Indigenous clients or partners | 63.0 |
| Introductions to potential customers | 60.2 |
| Help accessing available financing | 52.7 |
| Connections with international businesses and partners | 50.6 |
| Available sources of financing | 48.4 |
| Help developing an export plan | 43.1 |
| Information about which markets to pursue | 42.1 |
| Help developing a marketing plan | 40.4 |
| Connections with foreign government agencies | 38.8 |
| A mentor to help guide the business | 36.5 |
Note: This question was asked to all Indigenous businesses who currently export, formerly exported, or intend to start exporting.
Source: Canadian Council for Aboriginal Business and Global Affairs Canada, forthcoming. Calculation of the OCE.
Box 2.8: About CCAB-GAC collaborative projects
The Office of the Chief Economist (GAC) and the Canadian Council for Aboriginal Business (CCAB) were the principal partners in projects on Indigenous exporters. Both organizations collaborated on project design, survey questionnaires, analysis and interpretation of results and co-authoring the reports.
The CCAB is an Indigenous-led, non-partisan, national business association, with the mission to promote, strengthen, and enhance a prosperous Indigenous economy through fostering business relationships, opportunities and awareness.
An Indigenous advisory committee made up of First Nations, Métis and Inuit leaders provided guidance, advice and feedback at every stage of the projects. The projects followed best-in-class research ethics, including many of the First Nations principles of data ownership, control, access and possession—more commonly known as OCAP®. In a novel approach, the data used in this project are not owned or held by the government; anonymized data required for analysis were accessed through a secure data portal.
Several organizations contributed to the more recent projects. Big River Analytics participated in the design of the 2020 CCAB-GAC national Indigenous survey and conducted the important data weighting exercise in line with best practices. Big River Analytics is an Indigenous-owned and-operated organization located in Northern B.C. The national survey was administered by Environics Research Group. The Bank of Canada contributed to the survey questionnaire and financing.
Acknowledgements
The State of Trade is an annual, flagship report produced by Global Affairs Canada's Office of the Chief Economist. Each year, the report is made possible by a dedicated team of public servants and other contributors.
The State of Trade was published under the direction of Marie-France Paquet, Chief Economist, with guidance from Shenjie Chen, Cristina Popovici, Mélanie Raymond, and Aaron Sydor. The primary authors of the State of Trade 2023 are Crystal Arnburg, Jeff Bennet, Arif Mahmud, and Jacqueline Palladini. Special features (boxes) were written by Nancy Blanchet, Benjamin Ebella (Trade Commissioner) and the Inclusive Trade Promotion Team, the inclusive trade team at Export Development Canada, Kevin Jiang, Sheila Rao, Colin Scarf, Tuan Tran, and Georgina Wainwright-Kemdirim (Trade Agreements Secretariat). Data were vetted by economists Kevin Jiang, Julia Sekkel, Tuan Tran and Michelle Zilbergerts.
The design of the report was produced by Global Affairs Canada's Creative Services, in particular Pascale-Annie Paquin, Carl Emery and Liette Guérin under the direction of Isabelle Haché and France Séguin. The web version of the report was developed by Jennifer Rose and Gabriel Seguin, with support from Sophie Alder and Jessica Hinds. Jean Pierre Toupin (CIGC Services conseils inc.) edited and translated the report.
We are immensely grateful for the commitment of these individuals and teams to the State of Trade 2023.
Bibliography
Bélanger Baur, A. (2019a). Indigenous-owned exporting small and medium enterprises in Canada. Ottawa and Toronto: Global Affairs Canada and the Canadian Council for Aboriginal Business. Retrieved from: https://www.international.gc.ca/trade-commerce/inclusive_trade-commerce_inclusif/indigenous-autochtone/indigenous_sme-pme_autochtones.aspx?lang=eng
Bélanger Baur, A. (2019b). Women-owned exporting small and medium enterprises - Descriptive and comparative analysis. Ottawa: Global Affairs Canada. Retrieved from: https://www.international.gc.ca/trade-commerce/economist-economiste/analysis-analyse/women_owned-export-entreprises_femmes.aspx?lang=eng
Blanchet, N. (2021). Immigrant-led SME Exporters in Canada. Ottawa: Office of the Chief Economist, Global Affairs Canada. Retrieved from: https://www.international.gc.ca/trade-commerce/inclusive_trade-commerce_inclusif/sme-exporter-pme-exportatrice.aspx?lang=eng
Canadian Council for Aboriginal Business. (2022). COVID-19 Indigenous business survey: Phase 3. Toronto: Canadian Council for Aboriginal Business. Retrieved from: https://www.ccab.com/research/publications/community-development/covid-phase-iii/
Canadian Council for Aboriginal Business and Global Affairs Canada. (2023). Adàwe: Export experiences of Indigenous entrepreneurs. Toronto and Ottawa: Canadian Council for Aboriginal Business and Global Affairs Canada.
Canadian Council for Aboriginal Business and Global Affairs Canada. (forthcoming). [Title TBD]. Toronto and Ottawa: Canadian Council for Aboriginal Business and Global Affairs Canada.
Devillard, S., Vogel, T., Pickersgill, A., Madgavkar, A., Nowski, T., Krishnan, M., . . . and D. Kechrid. (2017). The power of parity: Advancing women’s equality in Canada. Montreal: McKinsey Global Institute. Retrieved from: https://www.mckinsey.com/featured-insights/gender-equality/the-power-of-parity-advancing-womens-equality-in-canada
European Commission. (2021). Commission staff working document: Evaluation of Recommendation of 6 May 2003 concerning the definition of micro, small and medium-sized enterprises. Brussels: European Commission. Retrieved from: https://ec.europa.eu/transparency/documents-register/detail?ref=SWD(2021)279&lang=en
Evenett, S., and N. Pisani. (2022). Less than nine percent of western firms have divested from Russia. Available at SSRN 4322502.
Gould, D. (1994). Immigrant links to the home country - empirical implications for United States. Review of Economics and Statistics, 302-316.
Gueye, B., Lafrance-Cooke, A., and J. Oyarzun. (2022). Identifying Indigenous business owners and Indigenous-owned businesses. Ottawa: Statistics Canada. Retrieved from: https://www150.statcan.gc.ca/n1/pub/11-633-x/11-633-x2022008-eng.htm
Halabisky, D. (2015). Entrepreneurial activities in Europe – Expanding networks for inclusive entrepreneurship. Paris: OECD. Retrieved from: https://doi.org/10.1787/5jrtpbz29mjh-en
Head, K., and J. Ries. (1998). Immigration and trade creation: Econometric evidence from Canada. Canadian Journal of Economics, 47-62.
Innovation, Science and Economic Development Canada. (2023). Minister Ng highlights how the Black Entrepreneurship Program is helping Black-owned businesses. Ottawa: Innovation, Science and Economic Development Canada. Retrieved from: https://www.canada.ca/en/innovation-science-economic-development/news/2023/02/minister-ng-highlights-how-the-black-entrepreneurship-program-is-helping-black-owned-businesses.html
International Monetary Fund. (2022). World economic outlook: Rising caseloads, a disrupted recovery, and higher inflation (January 2022). Washington, DC: IMF. Retrieved from: https://www.imf.org/en/Publications/WEO/Issues/2022/01/25/world-economic-outlook-update-january-2022
International Monetary Fund. (2023). World economic outlook: Near-term resilience, persistent challenges (July 2023). Washington, DC: IMF. Retrieved from: https://www.imf.org/en/Publications/WEO/Issues/2023/07/10/world-economic-outlook-update-july-2023
Jiang, K., and J. Sekkel. (2023). Characteristics of SME exporters in Canada. Ottawa: Office of the Chief Economist, Global Affairs Canada.
Korinek, J., Moïsé., E., and J. Tange. (2021). Trade and gender: A framework of analysis. Paris: OECD Publishing. Retrieved from: https://doi.org/10.1787/6db59d80-en
Lileeva, A., and D. Trefler. (2010). Improved access to foreign markets raises plant-level productivity...for some plants. Quarterly Journal of Economics, 1051-1099.
Melitz, M. J., and D. Trefler. (2012). Gains from trade when firms matter. Journal of Economic Perspectives, 91-118. https://pubs.aeaweb.org/doi/pdfplus/10.1257/jep.26.2.91
OECD. (2019). Unpacking e-commerce: business models, trends and policies. Paris: Organisation for Economic Cooperation and Development. Retrieved from: https://doi.org/10.1787/23561431-en
OECD. (2020). Linking Indigenous Communities with Regional Development in Canada. Paris: Organisation for Economic Cooperation and Development. Retrieved from: https://www.oecd.org/canada/linking-indigenous-communities-with-regional-development-in-canada-fa0f60c6-en.htm
OECD. (2023). Of bytes and trade: Quantifying the impact of digitalisation on trade. Paris: Organisation for Economic Cooperation and Development. Retrieved from: https://doi.org/10.1787/11889f2a-en
Office of the Chief Economist. (2012). State of trade 2012: international trade and its benefits to Canada. Ottawa: Global Affairs Canada. Retrieved from: https://www.international.gc.ca/trade-commerce/economist-economiste/state_of_trade-commerce_international/special_feature-2012-article_special.aspx?lang=eng
Office of the Chief Economist. (2020). The Canada-United States-Mexico agreement: economic impact assessment. Ottawa: Global Affairs Canada.
Office of the Chief Economist. (2022). State of Trade 2022: The Benefits of Free Trade Agreements. Ottawa: Global Affairs Canada. Retrieved from: https://www.international.gc.ca/transparency-transparence/state-trade-commerce-international/2022.aspx?lang=eng
Office of the Chief Economist. (2023a). An overview of Canada’s trade performance under the CPTPP after three years: Has the CPTPP delivered on its promise?. Ottawa: Global Affairs Canada.
Office of the Chief Economist. (2023b). Annual Merchandise Trade Report 2022. Ottawa: Global Affairs Canada.
Piermartini, R., and R. Teh. (2005). Demystifying modelling methods for trade policy (No. 10). WTO Discussion Paper.
Scarffe, C. (2022). Price or quantity effect? The impacts of the pandemic on Canadian trade. Global Affairs Canada. Retrieved from:
Sekkel, J. V. (2020). Women-Owned SMEs and Trade Barriers. Ottawa: Global Affairs Canada. Retrieved from: https://www.international.gc.ca/trade-commerce/economist-economiste/analysis-analyse/women_owned_smes_trade-pme_commerce_appartenant_femmes.aspx?lang=eng#a2v
Sekkel, J., and W. Wang. (2023). Summary of "Closing the gender gap in exporting: identifying women's exporting successes using firm-level data for Canada", a presentation at the WTO World Trade Congress on Gender (December 2022). Ottawa: Global Affairs Canada. Retrieved from: https://www.international.gc.ca/trade-commerce/economist-economiste/analysis-analyse/executive-summary-resume.aspx?lang=eng
Statistics Canada. (2021a). Immigrant entrepreneurs in Canada: Highlights from recent studies. Ottawa: Statistics Canada. Retrieved from: https://www150.statcan.gc.ca/n1/pub/36-28-0001/2021009/article/00001-eng.htm
Statistics Canada. (2021b). Survey on Financing and Growth of Small and Medium Enterprises, 2020. Ottawa: Statistics Canada. Retrieved from: https://www23.statcan.gc.ca/imdb/p2SV.pl?Function=getSurvey&SDDS=2941
Statistics Canada. (2022). The Daily: Survey on Financing and Growth of Small and Medium Enterprises, 2020. Ottawa: Statistics Canada. Retrieved from: https://www150.statcan.gc.ca/n1/daily-quotidien/220302/dq220302b-eng.htm
Statistics Canada. (2023a). Consumer Price Index, monthly, seasonally adjusted. Retrieved from: https://www150.statcan.gc.ca/t1/tbl1/en/cv.action?pid=1810000601
Statistics Canada. (2023b). Index of Remoteness. Ottawa: Statistics Canada. Retrieved from: https://www150.statcan.gc.ca/n1/pub/17-26-0001/172600012020001-eng.htm
Sui, S., and D. Goldfarb. (2014). Not for beginners: Should SMEs go to fast-growth markets? Ottawa: The Conference Board of Canada.
The National Aboriginal Economic Development Board. (2013). Addressing the barriers to economic development on reserve. Gatineau: The National Aboriginal Economic Development Board. Retrieved from: http://www.naedb-cndea.com/reports/addressing-barriers-to-economic-development-on-reserve.pdf (PDF and English only).
The National Aboriginal Economic Development Board. (2016). Reconciliation: Growing Canada’s economy by $27.7 billion. Gatineau: The National Aboriginal Economic Development Board. Retrieved from: http://www.naedb-cndea.com/reports/naedb_report_reconciliation_27_7_billion.pdf
Tran, T. (2021). 2020 Canadian export trends by size. Ottawa: Office of the Chief Economist, Global Affairs Canada. Retrieved from: https://www.international.gc.ca/trade-commerce/economist-economiste/analysis-analyse/trade-exporter-tendances-exportations.aspx?lang=eng
United Nations Conference on Trade and Development. (2023). Investment trends monitor: Issue 44. Geneva: UNCTAD. Retrieved from: https://unctad.org/system/files/official-document/diaeiainf2023d1_en.pdf.
World Bank and World Trade Organization. (2020). Women and trade: The role of trade in promoting gender equality. Washington DC: World Bank. Retrieved from: https://www.worldbank.org/en/topic/trade/publication/women-and-trade-the-role-of-trade-in-promoting-womens-equality.
World Trade Organization. (2023). Global trade outlook and statistics. Geneva: WTO. Retrieved from: https://www.wto.org/english/res_e/booksp_e/trade_outlook23_e.pdf.
Yu, E. (2019). Size and pattern of exporter trade diversification: preliminary results from firm-level data research. Ottawa: Global Affairs Canada.
- Date Modified: