Before there were computer programs for building 3D molecular models, models of protein structures had to be built by hand. Biochemists in the 1960s and 1970s built three-dimensional representations of their molecules by bending wires into the shapes of their proteins’ backbones and adding plastic shapes to represent the atoms. Others used styrofoam sheets and glue.
These models made from wire and plastic inspired the aesthetics of their modern computer graphics counterparts, but were difficult to share with other researchers. Grainy 2D photos, which the journals almost always printed in black-and-white, didn’t do the proteins’ intricate folds and lengthy amino acid chains justice. And although the journals often printed the entire chemical structure of a newly discovered protein—down to every last hydrogen bond—it was still difficult to discern the similarities and differences between structures.
Jane Richardson of Duke University had read the NIH papers about the structure of immunoglobulin when they first came out in the late 1970s. She and her husband Dave Richardson had spent years poring over x-ray crystallographic images of proteins in order to figure out the proteins’ biochemical structure, and the protein they were studying at the time was an antioxidant called superoxide dismutase (2SOD). The Richardsons had noticed from the papers that 2SOD and immunoglobulin shared some common features, but that was typical.
Proteins are chains of smaller chemicals called amino acids. They all have a ‘backbone’ of interlocking carbon, nitrogen, and oxygen atoms that hold the amino acid chain together, and most proteins have pretty similar ratios of carbon to nitrogen. What sets each protein apart from ananother is the sequential order of amino acids, which controls how the protein folds itself from a one-dimensional chain into a three-dimensional structure. Chemical tests can give you a pretty good idea of how many carbon, nitrogen, and oxygen atoms are in a protein, and genetic tests can tell you the order of the amino acids in the chain, but to figure out the unique folding pattern, you have to obtain an extremely close-up image of the protein. That image can’t be a traditional photograph; at the atomic scale of twisting protein chains, the wavelength of light is much too big to actually see anything. To get an image of a protein, you have to shoot it with short-wavelength x-rays and measure the rays that bounce back at you off the protein’s atoms.

Structural biology is painstaking, eye-strain-inducing, time-consuming work, and for most of the twentieth century, structural biologists were stuck trying to convey those structures through drawings of chemical bonds, x-ray crystallography data, and black-and-white white photographs of models because those were the types of images that could be printed on journal pages.
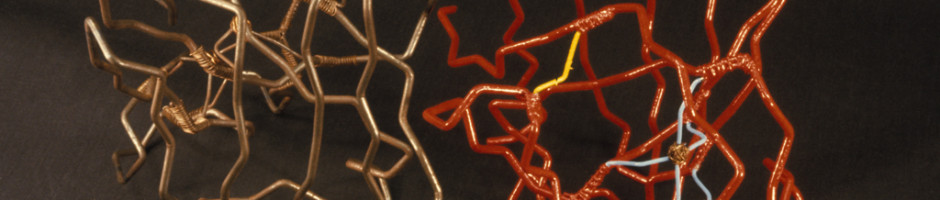
So despite reading the immunoglobulin structure papers and noticing a few similarities, the Richardsons didn’t fully realize the depth of immunoglobulin’s resemblance to 2SOD until they saw the wire model at a molecular biology conference. “ I was carrying the [wire model of 2SOD] and a friend who works on immunoglobulin structures was carrying a model of that, and we ran into each other in the doorway,” said Jane. “And we just sort of stared at each other’s models and said, ‘My God! They’re the same!’”
The Richardsons and their NIH colleague David Davies spent the better part of the session turning and comparing the two models from every possible angle. The topologies of 2SOD and immunoglobulin were dead-ringers for each other.
Nowadays, researchers can perform the physical analysis the Richardsons and Davies did by comparing wire physical models via computer programs. Not only did these programs not exist when the Richardsons first started in protein biology, but researchers hadn’t even settled on an effective method for illustrating which parts of a protein were in front of other parts in the 2D images.
One method the Richardsons used was to draw a series of two-dimensional cross-sections of the hypothesized protein structure, similar to the way that blueprints include a different 2D floor plan for each section of the building. But those diagrams failed to capture the fact that atoms within proteins aren’t organized into floor-like layers; the protein’s backbone is twisted into helices or ruffles and ridges, winding its way in and out of each two-dimensional slice.

When Jane and Dave Richardson met as undergrads in the early 1960s, the very first protein structures were just debuting. Dave, who was a chemist by training, was immediately fascinated by these elaborate little molecules living inside cells. Jane, who had double majored in philosophy and astronomy, took a bit longer to warm up to them. Many of the chemists at MIT, where Dave began his graduate studies, felt the same. Studying proteins was too time-consuming and highly unlikely to yield useful results.
“My fellow students were saying, ‘This is silly; We’re never going to get anywhere’—well actually, the professors told me that. I was still excited about [protein structure],” said Dave.
Meanwhile, Jane was working on her master’s in philosophy at Harvard but finding that she missed working on scientific projects. As a teen, she had garnered national attention as a high school astronomer when she placed third in the prestigious Westinghouse Science Talent Search. As an undergrad, she continued studying math and physics before eventually deciding to major in philosophy. But when she moved to Harvard to complete her master’s, something didn’t quite click. “They didn’t focus on the things I was interested in,” Jane said. “So I spent a lot of time in the botany department learning about plants.”
After completing her botany-infused philosophy master’s, Jane ended up getting a job as a technician in the lab where Dave was doing research in as a grad student. The two began working together on the structure of a protein called Staphylococcal nuclease.
“We started out as amateurs. Most of the early structures were being done by the big labs in England and some of the big labs in the US. And we weren’t connected with any of those people,” said Jane. “It was kind of fun. We’d end up reverse engineering the methodology and visiting the library twice a year to read up on papers. This was such a longshot for the chemist we were working for that he mostly left us alone, which was also nice.”
The two spent a lot of nights trying to draw proteins on the blackboard and poring over X-ray crystallography data. After the better part of a decade, in 1971, they finally published their solution to the structure of staph nuclease. It was only the 12th protein structure that had ever been solved.
After Dave wrapped up his PhD in 1970, the Richardsons moved to Duke and started their own lab. The lab was technically headed by Dave, but Jane continued working with x-ray crystallography data. In many ways, not being a tenured professor gave her a lot more freedom to work on science without interference.
“I think my philosophic training is very useful. The basis of that is to question everything. Also not having been trained in the same sets of preconceptions as everybody else, that tends to be easier to do,” said Jane. “I often had the advantage of being an outsider so I didn’t mind as much as most people do sounding dumb. But it gets hard after this many years to keep up that sense that I really am an outsider.”
Collecting the x-ray crystallography data that allows structural biochemists to calculate where atoms are in relation to each other is a long, laborious process that can take four to five years. Proteins are slippery by nature. It’s very hard to get them to line up in a stable crystal. “Growing protein crystals was then, and still is to some extent, a black art,” the Richardsons wrote in an email. It could take years to grow a protein crystal large enough to yield reliable data, and processing the diffraction data on 1970s computers was also incredibly time-consuming. But without the high-res images that come out of crystallography labs, the biochemists can’t do their part of the study; solving protein structures can therefore mean doing a lot of waiting while the crystallography happens, and Jane spent much of the early 70s—while the Richardsons were waiting for the crystallography data about 2SOD—trying to come up with a foolproof way to draw the structures.
“I was trying to find ways to compare other people’s structures,” Jane said. “The entire first year or two [at Duke] was just learning how to do those drawings. So it was very gradual. I’m not an artist. I can’t draw other things all that well.”

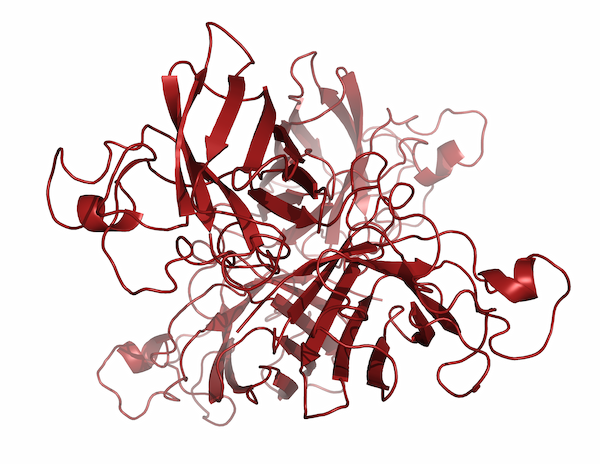
Since proteins are too small to be photographed directly, representations of them are often based off of earlier representations. One strategy their lab used was to paint the backbone of the wire model with a special paint that glowed under UV light. With the lights switched off, they took photos, and those photos ended up being a key inspiration for Jane’s later ribbon drawings of protein backbones. Focusing just on the backbone, it became a lot easier to show the folds and curls of the protein. But it was still not easy.
“A lot of good illustration is, as you probably are aware, taking things away so that you’re left with the essential picture,” said Dave. “The issue, of course, is that you might cut off something vital and that it might never be recovered.”
“The big deal is to really look at the drawing critically and ask whether it really shows what you mean it to show,” Jane said. “You have to try to forget all of what you know and try pretend that it’s new.”
This was one area where Jane’s ability to focus her attention on one subject and let the rest of the world fall away really paid dividends. After spending years meticulously diagramming existing protein structures, Jane began to realize that comparing the ways proteins folded could allow researchers to infer evolutionary and functional relationships. In the late 1970s, she began identifying recurring structural motifs in proteins, which culminated with the 1981 publication of “The Anatomy and Taxonomy of Proteins,” a mega-review that combined analyses of existing structures with some of the Richardsons’ newest research. Although her diagrams had been becoming more and more like the now-familiar ribbon drawings, most people in the field point to “The Anatomy and Taxonomy of Proteins” as the ribbon diagrams’ official debut. “It was almost one of those things where people said, ‘Oh! Why weren’t we doing that before?’ And it got adopted almost immediately,” Jane said.
But the Richardsons also made a concerted effort to help the ribbon diagrams catch on by drawing images of the various recurring structural motifs that Jane had noticed and distributing those images to other researchers for use in slides. By 1985, the ribbon drawings were so widely recognized that the MacArthur Foundation gave Jane a MacArthur Genius Fellowship in order to continue her work. But Duke still hadn’t made her a tenured professor.
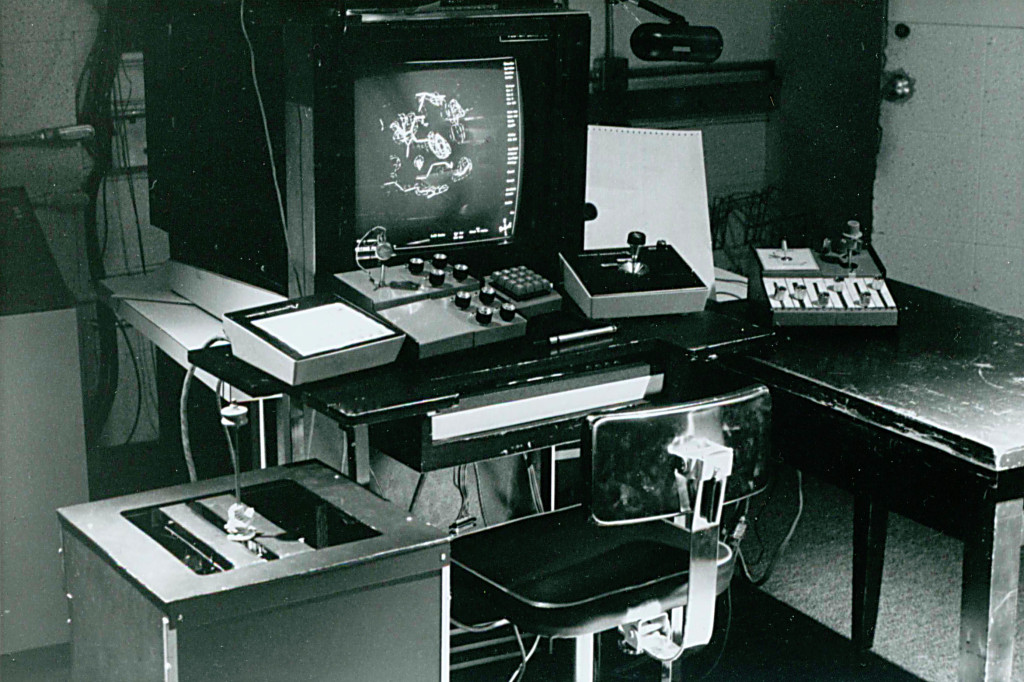
In the early 1980s, the Richardson lab shifted gears slightly and began working on computer-based ways to diagram proteins.
In 1992, they teamed up with the newly launched Protein Science journal to launch Kinemage graphics via a computer program called Mage, which produced rotating 3D images of a protein that could be displayed on Apple desktop computers. Protein Science distributed the first kinemages as article supplements contained on a floppy disk that arrived with each issue.
“Sometimes the authors would make their supplements,” said Jane. “But for each issue, I would go through and pick at least a few things that I thought could be illustrated really well, make a kinemage, and then go back and forth with the author.”
At first, the kinemages were the scientific equivalent of doorbusters: “When we went to the meeting—it would have been in 1991 probably—we never got to any of the sessions that year, because there was a crowd out where we were showing this, and it was usually 10 people deep,” Jane said. But after a while, people got used to them. Other competing programs emerged. Plus the demand for 3D graphics got so high that the Richardson couldn’t keep up with it. Journal editors began hiring people specifically to work with scientists on graphics and the Richardsons went back to developing new computer programs for studying structure.
Since the early 1990s, the computerized protein visualization field has gotten bigger and more diversified, but the Richardsons have remained key players. In addition to releasing revamped versions of Kinemage, they also developed a program that allows biochemists to identify and diagram the areas of proteins that bind to other proteins or biomolecules (aka the “contact surfaces”) and a program called MolProbity that allows researchers to double check their proposed structures for errors and/or unlikely formations. They’ve also remained active contributors to the Protein Data Bank and are now working on software that predicts the structures of folded RNA fragments.
“We tend to go off on tangents that no one else is doing,” said Jane. “Also it tends to be more productive because we’ve never really liked going to the hottest most competitive thing where you know somebody’s going to come up with the answer—if it’s possible—even if you don’t. It’s easier to go off in a direction where maybe nobody else would do it, at least any time soon.”
In 1991, Duke finally granted Jane tenure. (That same year, she was elected to the National Academy of Sciences and to the American Academy of Arts and Sciences.) Ever since, the pair has been co-heading the lab, teaching students, and advocating for an approach to visualization that favors interactivity and comprehensibility over aesthetic complexity.
“When we first developed Dave’s computer graphics tools, we were doing it for presentation. So we were thinking about it as illustrating journal articles and for teaching,” said Jane. “But we discovered that it was what we needed in order to describe the structures to ourselves.”