Putting the answer to a typical user's main question in big red type at the top of your homepage would guarantee high usability, right? Wrong — at least for the U.S. Census Bureau's homepage, where 86% of users failed to find the country's current population when it was presented in large red numbers.

Homepage for www.census.gov, as tested.
In a reduced screenshot, the population count is the only information that's clearly readable, so it makes the task easier than it is in real life. On the actual site, users often ignored the big red characters.
The following heatmap from one of our eyetracking studies shows how users looked at this homepage. Their task was to find the current population of the United States.
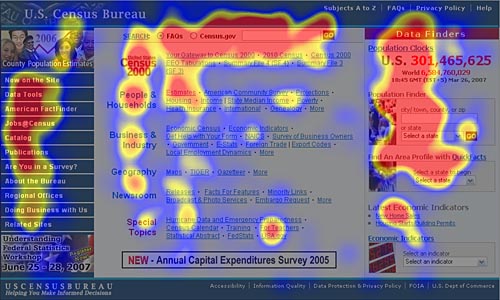
The areas users looked at the most are colored red;
the yellow areas indicate fewer views, followed by the least-viewed blue areas.
Gray areas didn't attract any fixations.
At first, the heatmap seems fine:
- users scanned the main parts of the page,
- the categorization of the main content area worked particularly well, and
- users gave considerable attention to the Population Clock and the Population Finder.
On closer inspection, however, it's clear that users only fixated on the first third of the number that shows current population. In other words, people scanned that area, but didn't actually read the number. (Only a small percentage — as indicated by blue coloring — looked at the last 2/3 of the number.)
Where People Looked
As the following pie chart shows, only 14% of participants used the Population Clock to answer the question. None of the remaining users found the correct answer, though most did find the population for an earlier year somewhere inside the site.

How users reacted to the Population Clock in the upper right of the Census homepage.
Only 14% of test participants used this feature when asked to find the current population.
Most people saw the feature, but didn't use it to complete the task.
Although it's not the major reason this homepage design failed, banner blindness does play a role here. Users tend to ignore heavily formatted areas because they look like advertisements. Thus, about 1/3 of users never even saw the Population Clock. However, most people did fixate on this area because it's not as overly formatted as most promotional features. So, most users saw the Population Clock; they just didn't use it, even though it contained the exact information they were looking for.
Beyond banner blindness, the major reason this homepage failed is that it used made-up terms or branded descriptions rather than plain-spoken words. Terms like "Population Clock," "Population Finder," and "QuickFacts" are not as descriptive as a simple line of text that says:
Population of the United States: 302,740,627 (as of Aug. 31, 2007)
Search-Dominant Users and Other Behaviors
The heatmap above is averaged across users, so it's not the best way to analyze the Census homepage's usability. In this case, there were 4 distinct user behaviors at play, and we need to analyze each separately.
The following gaze plots show examples of the 4 main classes of user behavior:

Each gaze plot shows one user's eye movements:
each blue dot is a fixation, with bigger dots indicating longer periods of looking.
- Plot A shows a classic search-dominant user. This user looked around the page briefly and then went straight to search. This was the predominant behavior in this study, accounting for 57% of users. The specific user shown in gaze plot A didn't look at the Population Clock at all; other search-dominant users had a few fixations in that area, but quickly abandoned it in their dash for the search box.
(Note that even this very search-dominant user took a quick look at all the other parts of the page — such as the left-hand navbar and the main content categories — but never looked at the right column with the ad-like areas. The user also stopped scanning the navbar when it turned into a graphical promotion and stopped scanning the content categories above the banner promoting a new survey. Banner blindness in action.) - Plot B shows a navigation-dominant user. This user looked at the navigation options — both in the center of the page and down the left-hand navbar — before clicking on the most promising link. Navigation-dominance was a rare behavior in this study; it's more common on sites that don't feature homepage tools, such as those that attracted users in plots C and D.
- Plot C shows a tool-dominant user attracted to the drop-down menus and type-in fields of the Population Finder. Many sites don't have such interactive features, but when they do exist, they tend to attract a good proportion of users: people like parts of websites where they can do something and thus feel in control (even though they often fail, because of poor application usability).
- Plot D shows a successful user who found and used the Population Clock to answer the question. This specific user was actually a search-dominant user, as indicated by the many early fixations in the search area. However, just before searching, the user was drawn to the Population Clock screen area and gradually engaged with it enough to realize that it contained the answer, freeing the user from having to search.
(Also note the long fixation on the "Census 2000" logo in the upper left of the content area: many users considered — or even clicked — this option, but of course it led to numbers that were 7 years out of date.)
Sadly, in this case, neither search, nor navigation, nor the Population Finder led the majority of users to the correct answer. Indeed, search was particularly bad on this site. One user said, "I know where I can probably find it faster: Google," and promptly abandoned the official Census Bureau site's own search. (In fact, she did find a reasonable — though less accurate — answer on another site using an external search.)
Although most users found some population number, whether from 2000, 2005, or 2006, it wasn't the current number. As one might expect from the Census Bureau, the site was rife with population statistics. The problem was that the outdated statistics weren't supplemented with links to the current numbers, violating the guideline to situate follow-ups in context.
Conflicting Usability Guidelines?
The Internet manager in charge of this losing design might defend the work by pointing out that it complies with #4 of my top-10 guidelines for homepage design: Offer a clear starting point for the main tasks users will undertake when visiting the site. Clearly, something was done right, with a task analysis that concluded that it would be a primary goal of visitors to this site to identify the current population of the United States and to have an easy way to find the populations of individual states and cities.
Even better, the site follows several recommendations from the full list of published homepage usability guidelines:
- Guideline #4: Emphasize the highest priority tasks so that users have a clear starting point.
- Guideline #29: Use examples to reveal the site's content. Rather than just describing what the site offers, the Census homepage states the actual population number. Juicy content for this type of site.
- Guideline #53: Offer tools for high-priority tasks directly on the homepage. The Population Finder is exactly such a tool, and obviously attracted users. (We also asked people to find the population of Texas, and the success rate was much higher for this task.)
(This site does many other things right; here I'm listing only those guidelines directly related to finding the population number.)
Despite obeying so many usability guidelines, the site has the miserably low success rate of 14% for its most important task. The site fails users because it violates several other guidelines for homepage usability:
- Guideline #19: Don't use clever phrases and marketing lingo.
- Guideline #63: Limit font styles and other text formatting.
- Guideline #91: Don't look like an ad.
So what good are usability guidelines if — as this example seems to show — they are always in conflict?
Actually, the guidelines don't contradict each other when it comes to the Census homepage. (Sometimes we do have conflicting guidelines, as in the matter of intranet staff directories. That's why we call them guidelines: because they aren't always firm and sometimes require interpretation or, in rare cases, deviation.)
In this case, though, it's possible to feature the high-priority tasks, show the main number directly on the homepage, and have a tool for the rest without using marketing-style terms, heavy formatting, and otherwise making the important area look like an ad or a promotion. That is, the designer could have followed all 6 guidelines simultaneously.
In many studies of corporate and e-commerce sites, we observe users ignoring the very page sections that have the most business value because the site is selling them too hard. Learn from the Census Bureau's mistake: try a softer approach with more straightforward, user-centered information. Let go of the fancy formatting and the fancy words.