
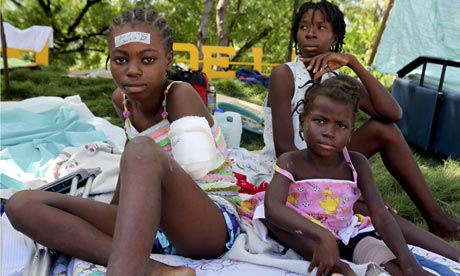
One year ago today Haiti was hit by an earthquake which devastated its already fragile infrastructure.
- The world in information
- : Guardian wallcharts
-
- Find this on the Guardian bookshop

In the months since the quake we at the datablog have been keeping track of the aid pledged and the uncommitted pledges. We found a particularly interesting set of data from Relief Web that shows:
- the amount of money pledged by each country and each aid agency
- the projects that are expecting funds and have received funds
- how much of the money pledged has actually got through to the projects intended.
We have used the daily updates of aid pledged to Haiti in a range of displays through the year.
Now we would like to present the whole year of Relief Web data showing the total funding for Haiti since the earthquake. Obviously throughout the year Haitian's have faced other problems such as the Cholera outbreak in the latter part of 2010, and funding addressed at these problems is included in the yearly picture.
The Relief Web site sums up the funding situation from January to December 2010 as: the requested amount of aid was $1.5bn and the funding received was $1bn, despite receiving pledges for $2.8m.
The funding situation so far for Haiti in 2011 according to Relief Web is that $906m are requested to for aid projects and funding so far has been $44m.
This diagram shows the committed pledges by country and by organsiation for all of 2010.
The data below shows the pledged and uncommitted pledges for each country, each aid agency and each project that is expecting aid. Please tell us what you think will add to this data.
Download the data
• DATA: download the full datasheet
• Get the latest update and spreadsheet from Reliefweb
World government data
• Search the world's government data with our gateway
Can you do something with this data?
Flickr Please post your visualisations and mash-ups on our Flickr group or mail us at datastore@guardian.co.uk
• Get the A-Z of data
• More at the Datastore directory
• Follow us on Twitter
Data summary
|
AREA
|
Year
|
Total resources available $
|
Unmet requirements $
|
Covered % per year
|
Uncommitted pledges
|
|---|---|---|---|---|---|
|
SOURCE http://fts.unocha.org/reports/daily/OCHA_R32sum_A893.XLS |
|||||
| AGRICULTURE | 2011 | 0 | 43,087,517 | 0 | 0 |
| CAMP COORDINATION AND CAMP MANAGEMENT (CCCM) | 2011 | 15,379,294 | 77,581,497 | 17 | 0 |
| CLUSTER NOT YET SPECIFIED | 2011 | 0 | 0 | 0 | 0 |
| COORDINATION AND SUPPORT SERVICES | 2011 | 0 | 10,235,233 | 0 | 1,000,000 |
| EARLY RECOVERY | 2011 | 0 | 115,114,021 | 0 | 0 |
| EDUCATION | 2011 | 0 | 32,898,882 | 0 | 0 |
| FOOD AID | 2011 | 0 | 101,987,574 | 0 | 0 |
| HEALTH | 2011 | 11,189,264 | 124,458,097 | 8 | 0 |
| LOGISTICS | 2011 | 0 | 24,800,000 | 0 | 0 |
| NUTRITION | 2011 | 0 | 26,665,608 | 0 | 0 |
| PROTECTION | 2011 | 0 | 60,751,529 | 0 | 0 |
| SHELTER AND NON-FOOD ITEMS | 2011 | 0 | 91,835,715 | 0 | 0 |
| WATER, SANITATION AND HYGIENE | 2011 | 17,725,163 | 153,251,812 | 10 | 0 |
| AGRICULTURE | 2010 | 31,526,150 | 27,291,886 | 54 | 0 |
| CAMP COORDINATION AND CAMP MANAGEMENT(CCCM) | 2010 | 36,196,220 | 42,583,240 | 46 | 0 |
| CLUSTER NOT SPECIFIED | 2010 | 40,911,267 | -40,911,267 | 0 | 0 |
| COORDINATION AND SUPPORT SERVICES | 2010 | 21,998,478 | -137,330 | 101 | 0 |
| EARLY RECOVERY | 2010 | 53,742,941 | 86,962,859 | 38 | 0 |
| EDUCATION | 2010 | 85,523,861 | 2,013,011 | 98 | 0 |
| EMERGENCY TELECOMMUNICATIONS | 2010 | 782,460 | 3,651,305 | 18 | 0 |
| FOOD AID | 2010 | 353,744,105 | 132,998,437 | 73 | 2,111,614 |
| HEALTH | 2010 | 104,069,888 | 36,250,291 | 74 | 450,000 |
| LOGISTICS | 2010 | 64,629,799 | 25,214,077 | 72 | 0 |
| NUTRITION | 2010 | 46,236,495 | 1,872,497 | 96 | 0 |
| PROTECTION | 2010 | 42,940,134 | 28,927,598 | 60 | 100,000 |
| SHELTER AND NON-FOOD ITEMS | 2010 | 102,276,697 | 59,986,657 | 63 | 220,000 |
| WATER, SANITATION AND HYGIENE | 2010 | 97,216,853 | 13,722,721 | 88 | 0 |
| Grand Total: | 1,126,089,069 | 1,283,093,467 | 3,881,614 | ||
|
Country/ organisation
|
Committed funding, $
|
Uncommitted funding, $
|
Committed funding, $ per person
|
Date
|
|---|---|---|---|---|
|
source: http://fts.unocha.org/reports/daily/OCHA_R24_E15939.XLS and source: http://fts.unocha.org/reports/daily/OCHA_R24_E15797.XLS |
||||
| United States | 41,268,315 | 1,000,000 | 0.13 | 2011 |
| Sweden | 9,999,997 | 0 | 1.08 | 2011 |
| United Kingdom | 8,086,517 | 0 | 0.13 | 2011 |
| Japan | 7,159,000 | 0 | 0.06 | 2011 |
| Canada | 6,815,969 | 0 | 0.2 | 2011 |
| Spain | 3,591,837 | 0 | 0.08 | 2011 |
| Brazil | 2,000,000 | 0 | 0.01 | 2011 |
| Germany | 1,282,018 | 0 | 0.02 | 2011 |
| Finland | 1,111,112 | 0 | 0.21 | 2011 |
| France | 939,584 | 0 | 0.02 | 2011 |
| Netherlands | 694,444 | 0 | 0.04 | 2011 |
| Ireland | 681,064 | 0 | 0.15 | 2011 |
| Italy | 531,559 | 0 | 0.01 | 2011 |
| Denmark | 361,883 | 0 | 0.07 | 2011 |
| Switzerland | 101,626 | 0 | 0.01 | 2011 |
| Korea, Republic of | 100,000 | 0 | 0 | 2011 |
| Luxembourg | 93,765 | 0 | 0.03 | 2011 |
| Estonia | 78,534 | 0 | 0 | 2011 |
| European Commission | 0 | 29,755,672 | 2011 | |
| Cuba | 0 | 0 | 0 | 2011 |
| Mexico | 0 | 0 | 0 | 2011 |
| Private (individuals & organisations) | 1,245,497,860 | 56,271,772 | 2010 | |
| United States | 1,177,401,659 | 0 | 3.84 | 2010 |
| Canada | 163,038,795 | 0 | 4.83 | 2010 |
| European Commission | 159,730,384 | 432,900,432 | 2010 | |
| Allocation of funds from Red Cross / Red Crescent | 86,481,683 | 120,000 | 2010 | |
| Spain | 72,277,006 | 0 | 1.57 | 2010 |
| Japan | 71,664,000 | 28,177,000 | 0.56 | 2010 |
| Saudi Arabia | 50,000,000 | 0 | 2010 | |
| Central Emergency Response Fund (CERF) | 38,506,425 | 0 | 2010 | |
| Sweden | 37,351,986 | 278,940 | 4.02 | 2010 |
| France | 36,136,891 | 254,212,454 | 0.58 | 2010 |
| Germany | 33,999,292 | 0 | 0.42 | 2010 |
| United Kingdom | 33,272,548 | 450,000 | 0.54 | 2010 |
| Norway | 31,875,024 | 0 | 0.15 | 2010 |
| Brazil | 28,784,328 | 10,000,000 | 0.15 | 2010 |
| Denmark | 26,584,971 | 0 | 4.81 | 2010 |
| Netherlands | 22,045,134 | 0 | 1.32 | 2010 |
| Italy | 21,180,161 | 0 | 0.35 | 2010 |
| China | 13,976,315 | 5,000,000 | 0.01 | 2010 |
| Switzerland | 13,719,899 | 0 | 1.77 | 2010 |
| Australia | 12,913,876 | 0 | 1.46 | 2010 |
| Russian Federation | 10,900,000 | 0 | 0.08 | 2010 |
| Mexico | 10,505,384 | 0 | 0.1 | 2010 |
| Belgium | 9,986,956 | 0 | 1.12 | 2010 |
| Finland | 8,243,388 | 0 | 1.54 | 2010 |
| Thailand | 6,752,381 | 0 | 0.1 | 2010 |
| Allocations of unearmarked funds by UN agencies | 6,545,153 | 0 | 2010 | |
| Ireland | 6,408,289 | 0 | 1.42 | 2010 |
| United Arab Emirates | 6,037,973 | 2,703,542 | 0.59 | 2010 |
| Carry-over (donors not specified) | 5,298,462 | 0 | 2010 | |
| India | 5,000,000 | 0 | 0 | 2010 |
| Austria | 4,379,418 | 0 | 12.81 | 2010 |
| Ghana | 3,000,000 | 0 | 1.76 | 2010 |
| World Bank | 3,000,000 | 100,000,000 | 2010 | |
| Luxembourg | 2,521,894 | 0 | 0.77 | 2010 |
| Nigeria | 2,501,000 | 0 | 0.16 | 2010 |
| Congo, The Democratic Republic of | 2,500,000 | 0 | 2010 | |
| Turkey | 2,300,000 | 0 | 0.03 | 2010 |
| Poland | 2,031,169 | 0 | 0.07 | 2010 |
| Bahrain | 2,000,000 | 0 | 2.53 | 2010 |
| Equatorial Guinea | 1,999,977 | 0 | 2010 | |
| Indonesia | 1,750,000 | 0 | 0.01 | 2010 |
| Portugal | 1,552,249 | 0 | 0.02 | 2010 |
| New Zealand | 1,439,884 | 0 | 0.33 | 2010 |
| Kuwait | 1,250,000 | 0 | 0.56 | 2010 |
| Korea, Republic of | 1,200,000 | 8,800,000 | 0.19 | 2010 |
| Czech Republic | 1,134,357 | 0 | 0.11 | 2010 |
| Gabon | 1,000,000 | 0 | 0.02 | 2010 |
| Gambia | 1,000,000 | 0 | 0.59 | 2010 |
| Guyana | 1,000,000 | 0 | 0.1 | 2010 |
| Algeria | 1,000,000 | 0 | 0.03 | 2010 |
| Congo, Republic of | 1,000,000 | 0 | 1.48 | 2010 |
| Morocco | 1,000,000 | 33,000,000 | 0.03 | 2010 |
| Trinidad and Tobago | 1,000,000 | 0 | 0.14 | 2010 |
| Tunisia | 1,000,000 | 0 | 0.49 | 2010 |
| Suriname | 1,000,000 | 0 | 0.02 | 2010 |
| Senegal | 1,000,000 | 0 | 0.08 | 2010 |
| Greece | 928,115 | 0 | 0.01 | 2010 |
| Slovakia | 652,669 | 0 | 0.12 | 2010 |
| Cuba | 607,500 | 0 | 0.05 | 2010 |
| Estonia | 600,764 | 0 | 0.01 | 2010 |
| Slovenia | 520,966 | 0 | 0.09 | 2010 |
| Ukraine | 503,643 | 0 | 0.38 | 2010 |
| Turkmenistan | 500,000 | 0 | 0.44 | 2010 |
| Timor-Leste | 500,000 | 0 | 0.42 | 2010 |
| Mauritius | 500,000 | 0 | 2.58 | 2010 |
| Azerbaijan | 499,978 | 0 | 0.63 | 2010 |
| Chad | 499,000 | 0 | 0.04 | 2010 |
| Croatia | 491,660 | 0 | 0.11 | 2010 |
| Bulgaria | 373,511 | 0 | 0.04 | 2010 |
| Lithuania | 296,173 | 0 | 0.09 | 2010 |
| Various (details not yet provided) | 222,384 | 0 | 2010 | |
| Burkina Faso | 200,000 | 0 | 0.01 | 2010 |
| Afghanistan | 200,000 | 0 | 0.01 | 2010 |
| Malta | 199,898 | 0 | 0.48 | 2010 |
| Liechtenstein | 190,295 | 0 | 0.03 | 2010 |
| Saint Lucia | 185,185 | 0 | 0 | 2010 |
| South Africa | 184,240 | 0 | 0.09 | 2010 |
| Burundi | 161,186 | 0 | 0.01 | 2010 |
| Benin | 150,500 | 0 | 0.22 | 2010 |
| Cyprus | 144,300 | 0 | 0.17 | 2010 |
| Hungary | 144,300 | 0 | 0.01 | 2010 |
| Council of Europe | 140,056 | 0 | 2010 | |
| Monaco | 140,056 | 0 | 0 | 2010 |
| Viet Nam | 130,000 | 0 | 0 | 2010 |
| Botswana | 128,100 | 0 | 0.07 | 2010 |
| Macedonia, Former Yugoslav Republic of | 126,075 | 0 | 2010 | |
| Malaysia | 100,000 | 0 | 0.32 | 2010 |
| Uganda | 100,000 | 0 | 0.96 | 2010 |
| Saint Vincent and the Grenadines | 100,000 | 0 | 1.92 | 2010 |
| Serbia | 100,000 | 0 | 0.61 | 2010 |
| Sierra Leone | 100,000 | 0 | 0.01 | 2010 |
| Armenia | 100,000 | 0 | 0 | 2010 |
| Grenada | 100,000 | 0 | 0.96 | 2010 |
| Kazakhstan | 100,000 | 0 | 0 | 2010 |
| Iceland | 96,000 | 0 | 0.3 | 2010 |
| Moldova, Republic of | 90,000 | 0 | 2010 | |
| British Virgin Islands | 80,000 | 0 | 0 | 2010 |
| Bosnia and Herzegovina | 73,780 | 0 | 0 | 2010 |
| Romania | 72,150 | 0 | 0.01 | 2010 |
| Andorra | 69,920 | 0 | 0 | 2010 |
| Cambodia | 60,000 | 0 | 0 | 2010 |
| Brunei Darussalam | 52,544 | 0 | 2010 | |
| Colombia | 50,000 | 0 | 0.09 | 2010 |
| Singapore | 50,000 | 0 | 0.01 | 2010 |
| Liberia | 50,000 | 0 | 0 | 2010 |
| Philippines | 50,000 | 0 | 0.01 | 2010 |
| Antigua and Barbuda | 37,037 | 0 | 0.01 | 2010 |
| Ecuador | 30,785 | 0 | 0 | 2010 |
| Mongolia | 20,000 | 0 | 0.61 | 2010 |
| Bahamas | 12,500 | 0 | 0.04 | 2010 |
| Madagascar | 5,000 | 0 | 0 | 2010 |
| Kenya | 1,987 | 0 | 0.02 | 2010 |
| Jordan | 0 | 0 | 0 | 2010 |
| Israel | 0 | 0 | 0 | 2010 |
| Jamaica | 0 | 0 | 0 | 2010 |
| Iran (Islamic Republic of) | 0 | 0 | 0 | 2010 |
| Egypt | 0 | 0 | 0 | 2010 |
| El Salvador | 0 | 0 | 0 | 2010 |
| Dominican Republic | 0 | 4,976,499 | 0 | 2010 |
| Georgia | 0 | 0 | 0 | 2010 |
| Argentina | 0 | 0 | 0 | 2010 |
| Bolivia | 0 | 0 | 0 | 2010 |
| Bangladesh | 0 | 0 | 0 | 2010 |
| Barbados | 0 | 0 | 0 | 2010 |
| Chile | 0 | 0 | 0 | 2010 |
| Malawi | 0 | 0 | 0 | 2010 |
| Lebanon | 0 | 0 | 0 | 2010 |
| Rwanda | 0 | 100,000 | 0 | 2010 |
| Qatar | 0 | 0 | 0 | 2010 |
| Nicaragua | 0 | 0 | 0 | 2010 |
| Panama | 0 | 0 | 0 | 2010 |
| Paraguay | 0 | 0 | 0 | 2010 |
| Peru | 0 | 0 | 0 | 2010 |
| Syrian Arab Republic | 0 | 0 | 0 | 2010 |
| Uruguay | 0 | 0 | 0 | 2010 |
| Union of South American Nations | 0 | 100,000,000 | 2010 | |
| Venezuela | 0 | 0 | 0 | 2010 |
| 3593395652 | 1067746311 | |||