


Talking Points:
- Big FX moves in the overnight session as the US Dollar broke out of the resistance that’s been in play over the past two months, and this helped EUR/USD to trade below the 1.1500 level for the first time in over a year. The driver appears to be emanating from Turkey, as concerns around financial conditions there have started to worry the ECB about exposure to the situation in European banks. Contagion in the European banking system is something that has long been a concern, and it appears that theme is now coming back into the spotlight.
- The British Pound continues to meltdown, albeit for different reasons. We even had a couple of flickers of positive news earlier this morning around an improvement GDP along with some comments from UK Finance Minister, Phillip Hammond, that he felt the chances are that the UK gets a Brexit-deal. Nonetheless, sellers remain firmly in control of the currency as GBP/USD has now established a fresh yearly low.
- DailyFX Forecasts on a variety of currencies such as the US Dollar or the Euro are available from the DailyFX Trading Guides page. If you’re looking to improve your trading approach, check out Traits of Successful Traders. And if you’re looking for an introductory primer to the Forex market, check out our New to FX Guide.
Do you want to see how retail traders are currently trading the US Dollar? Check out our IG Client Sentiment Indicator.
US Dollar to Fresh Yearly Highs on Turkish Concerns, EUR/USD Breakdown
US Dollar bulls have finally broken through. After seven weeks of battling with resistance at the area around 95.50, prices broke out in the overnight session, just ahead of the Euro open. The primary driver of the move appears to be emanating from a deeper breakdown in both EUR/USD and GBP/USD, and those breakdowns appear to be driven by different drivers/reasons.
US Dollar Four-Hour Price Chart: Breaking Out From Resistance to Fresh Yearly Highs
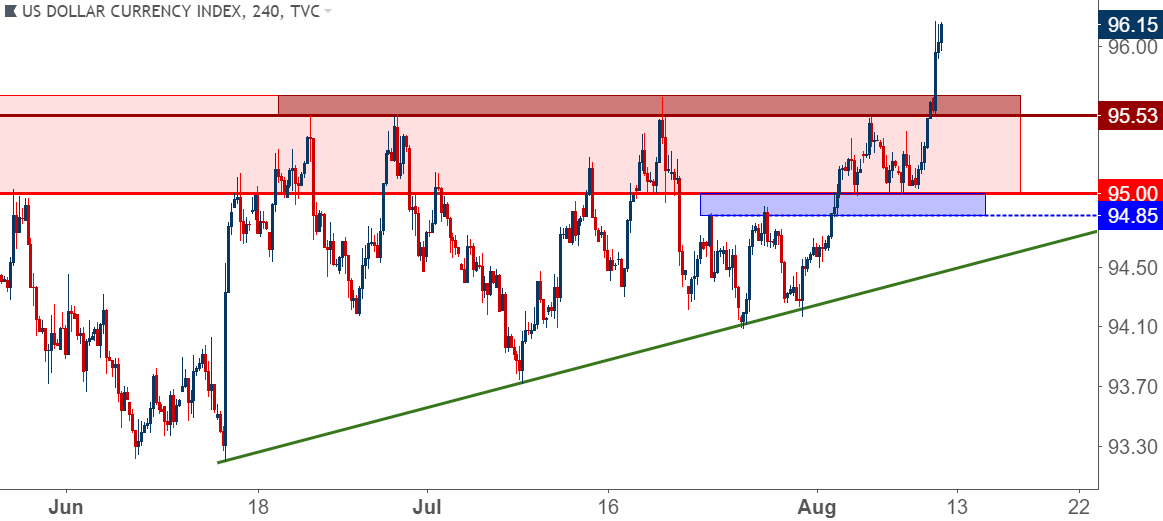
Chart prepared by James Stanley
In EUR/USD, the major concern is now contagion in the European banking system. This is something that was worrisome during the European Financial Crisis and this even started to rear its head again just a few months ago as political turmoil was starting to show in Italy. But as the economic situation in Turkey continues to worsen, the ECB is growing more concerned with exposure to the situation in European banks. And given the tight trading relationships within the banking sector in the Euro economy, one or two banks becoming problematic could spell much more trouble for the other European banks that they trade with.
Much like we saw in May, traders haven’t wanted to wait around for confirmation as the selling has continued. This brought upon a break of the support level at 1.1509, and we’re now trading at fresh yearly lows in the pair.
EUR/USD Four-Hour Price Chart: Breakdown to Yearly Lows on Contagion Fears
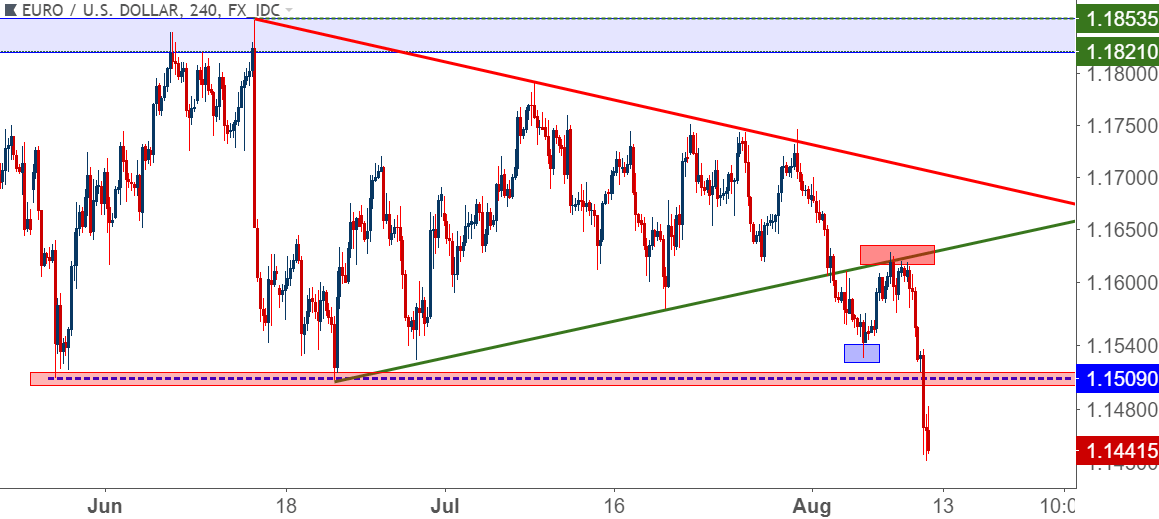
Chart prepared by James Stanley
In a corresponding move, the US Dollar broke out to fresh yearly highs on the back of that EUR/USD breakout, catching a bit of resistance at the 96.15 level before cauterizing support and pushing back-up ahead of the release of July inflation numbers out of the United States.
US Inflation Remains Strong at 2.9%, Largest YoY Gain in Core CPI Since 2008
Perhaps lost in the shuffle of this morning’s unexpected drivers was the release of July inflation numbers out of the United States. Headline CPI printed at 2.9% for the second consecutive month, matching expectations. But – on the read of Core CPI, stripping out food and energy costs, this morning’s print of 2.4% beat the expectation of 2.3%, and this represented the largest year-over-year gain in Core CPI since 2008.
US Core CPI at 2.4% in July – Largest Year-over-Year Gain Since 2008

Chart prepared by James Stanley
On the front of headline CPI, this morning brought the 11th consecutive month of inflation at-or-above the Fed’s 2% target, putting the Central Bank squarely in the driver’s seat for continued rate hikes. This happens even despite the seemingly bearish scenarios around Europe and the UK, which further exposes the US Dollar for themes of strength as we trade deeper into the second half of 2018.
US Headline CPI Comes in Above 2% for 11th Consecutive Month

Chart prepared by James Stanley
US Dollar Pushes Back Up to highs
The immediate response in the Greenback after that inflation release was a quick move back-up to the highs that were set earlier this morning. Given the scope of today’s breakout, that makes sense as traders are now coming to grips with two factors of strength for the US Dollar: Both interest rate policy on the basis of monetary policy divergence combined with apparent ‘safe-haven,’ flight-to-quality flows on the back of the growing fear of contagion in the European banking sector.
US Dollar Five-Minute Price Chart: Pushing Back-Up to Highs After Inflation
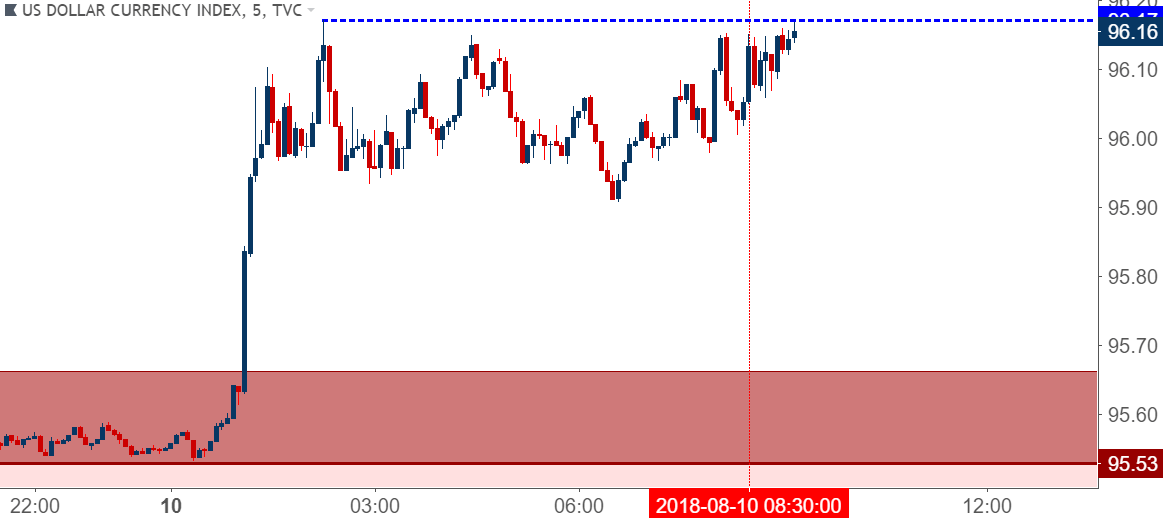
Chart prepared by James Stanley
Given the bullish response in the Dollar that had already been priced-in well ahead of this morning’s inflation release, combined with the response after the data, and we can surmise that a growing fear around contagion has been driving safe-haven flows in the US Dollar. Case in point – USD/JPY isn’t showing that Dollar-strength to the same degree as EUR/USD and GBP/USD, indicating continued Yen strength, which will often show during risk-off environments. USD/JPY remains mired in a falling wedge formation while other major pairs are printing at fresh yearly lows (or highs). This would point to the fact that the bulk of this morning’s USD-strength is more-driven from fear (of contagion) than greed (for higher rates).
USD/JPY Four-Hour: Lack of Participation in Long-USD Party Indicates Risk-Aversion as Driver
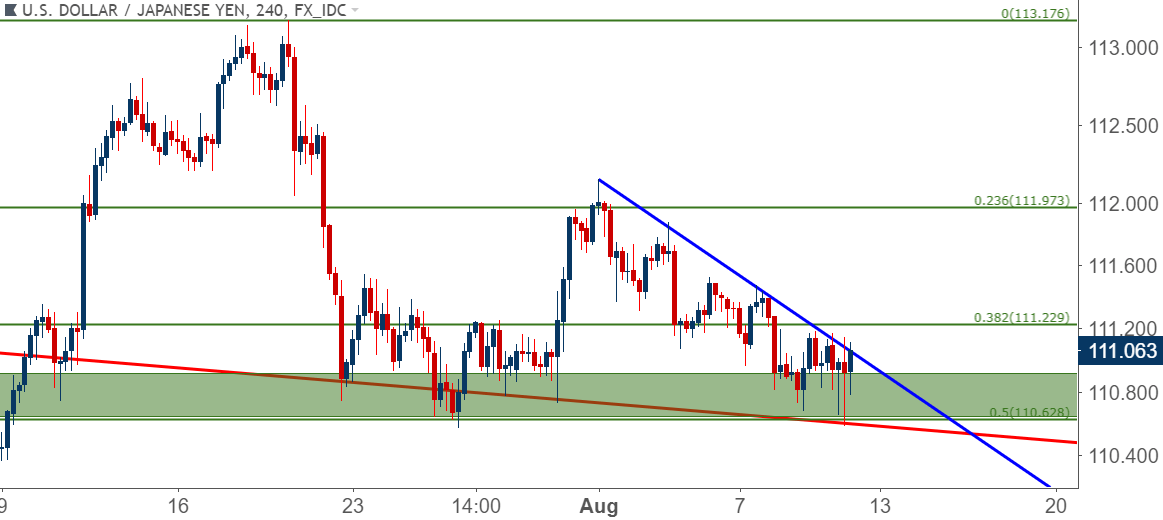
Chart prepared by James Stanley
US Dollar Perspective
In our Q3 technical forecast on the US Dollar, we were looking for continuation of the bullish breakout that started in Q2. And while it’s taken almost half of Q3 for that theme to come back to life, now that we’re at fresh highs traders would likely want to start plotting approaches based upon continuation of this theme.
Prices are now trading above the 96.00 level, which is the 23.6% Fibonacci retracement of the 2008-2017 major move in the currency. This can be a tough area to investigate long exposure, but that prior area of resistance that had held the highs in the Dollar for almost two months can now become an attractive area to follow for higher-low support in this theme. That area runs from 95.53 up to 95.66, and this can open the door for stop below prior support of 95.00 for topside continuation themes.
US Dollar Daily Price Chart: Ascending Triangle Breakout – Prior Resistance Now Becomes Support
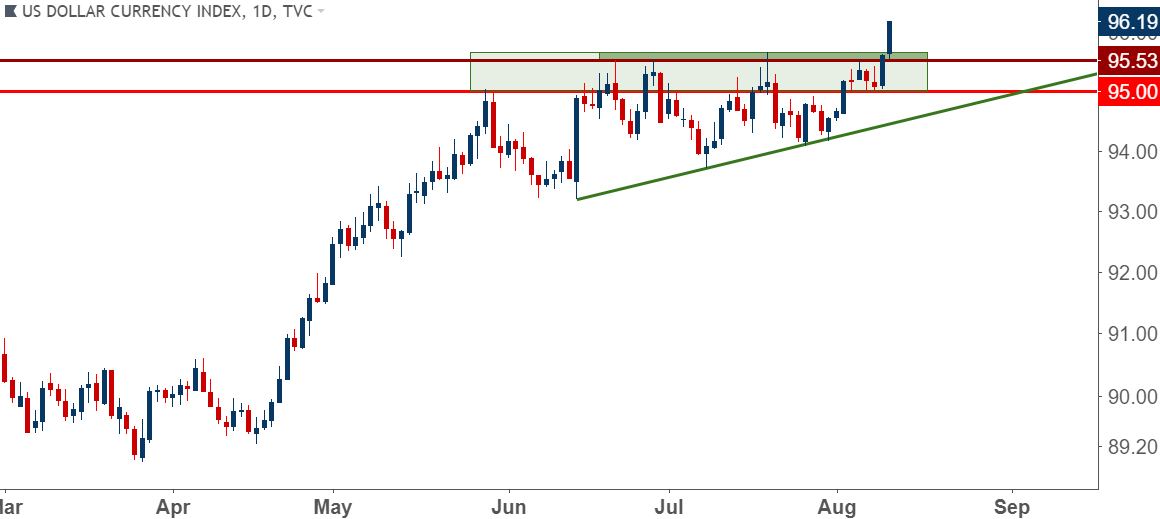
Chart prepared by James Stanley
EUR/USD Perspective
Earlier this week, EUR/USD did a resistance check at prior support – taken from the bullish trend-line that had built from late-June and held into early-August. That’s led to a breakout below the 1.1509 level that had twice turned around bearish advances, and with the pair now trading at fresh lows – the door is opened for more.
The complication at the moment is one of positioning as prices are fairly far away from any nearby points of resistance, and this can make managing risk a bit of a challenge. But – much as we looked at above (only in reverse) can be utilized for continuation strategies here. We had the build of support over a month-plus of price action, and that prior area of interest can now be re-utilized for resistance potential. Below, we look at three different levels that can be used for such a theme as we move towards next week.
EUR/USD Four-Hour Price Chart: Lower-High Resistance Potential for Bearish Continuation

Chart prepared by James Stanley
To read more:
Are you looking for longer-term analysis on the U.S. Dollar? Our DailyFX Forecasts for Q3 have a section for each major currency, and we also offer a plethora of resources on USD-pairs such as EUR/USD, GBP/USD, USD/JPY, AUD/USD. Traders can also stay up with near-term positioning via our IG Client Sentiment Indicator.
Forex Trading Resources
DailyFX offers a plethora of tools, indicators and resources to help traders. For those looking for trading ideas, our IG Client Sentiment shows the positioning of retail traders with actual live trades and positions. Our trading guides bring our DailyFX Quarterly Forecasts and our Top Trading Opportunities; and our real-time news feed has intra-day interactions from the DailyFX team. And if you’re looking for real-time analysis, our DailyFX Webinars offer numerous sessions each week in which you can see how and why we’re looking at what we’re looking at.
If you’re looking for educational information, our New to FX guide is there to help new(er) traders while our Traits of Successful Traders research is built to help sharpen the skill set by focusing on risk and trade management.
--- Written by James Stanley, Strategist for DailyFX.com
Contact and follow James on Twitter: @JStanleyFX


