

Canadian Dollar Talking Points
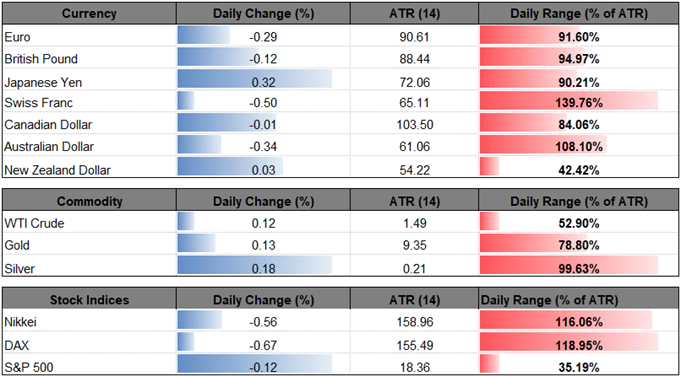
USD/CAD spikes to a fresh weekly high as updates to Canada’s Employment report dampens bets for an imminent Bank of Canada (BoC) rate-hike, but the near-term outlook has become clouded with mixed signals as the Relative Strength Index (RSI) appears to be deviating with price.
USD/CAD Retains Bullish Series Following Dismal Canada Employment Report
The unexpected 7.5K decline in Canada Employment dampens the outlook for growth and inflation as the weakness was led by a 31.0K contraction in full-time positions, and the dismal development may keep the BoC on the sidelines at the next meeting on July 11 as the ‘Governing Council will take a gradual approach to policy adjustments, guided by incoming data.’
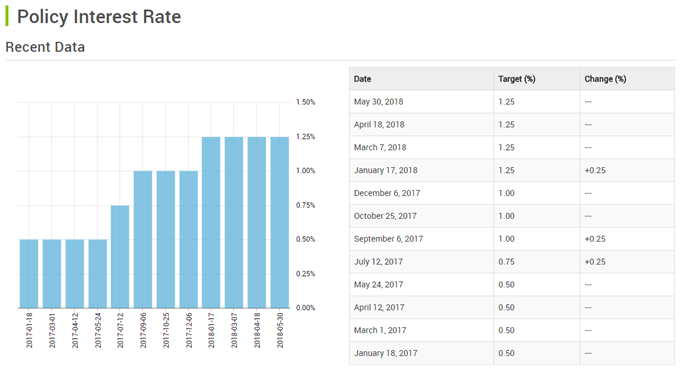
Keep in mind, recent comments from the BoC suggest the central bank will continue to normalize monetary policy in 2018 as officials warn ‘higher interest rates will be warranted to keep inflation near target,’ and Governor Stephen Poloz and Co. may strike a more hawkish tone over the coming months as ‘activity in the first quarter appears to have been a little stronger than projected.’
Nevertheless, recent price action raises the risk for run at the 2018-high (1.3125) as the pair extends the series of higher highs & lows from earlier this week, but the Relative Strength Index (RSI) fails to highlight a similar dynamic as the oscillator continues to track the bearish formation from earlier this year.
USD/CAD DAILY CHART
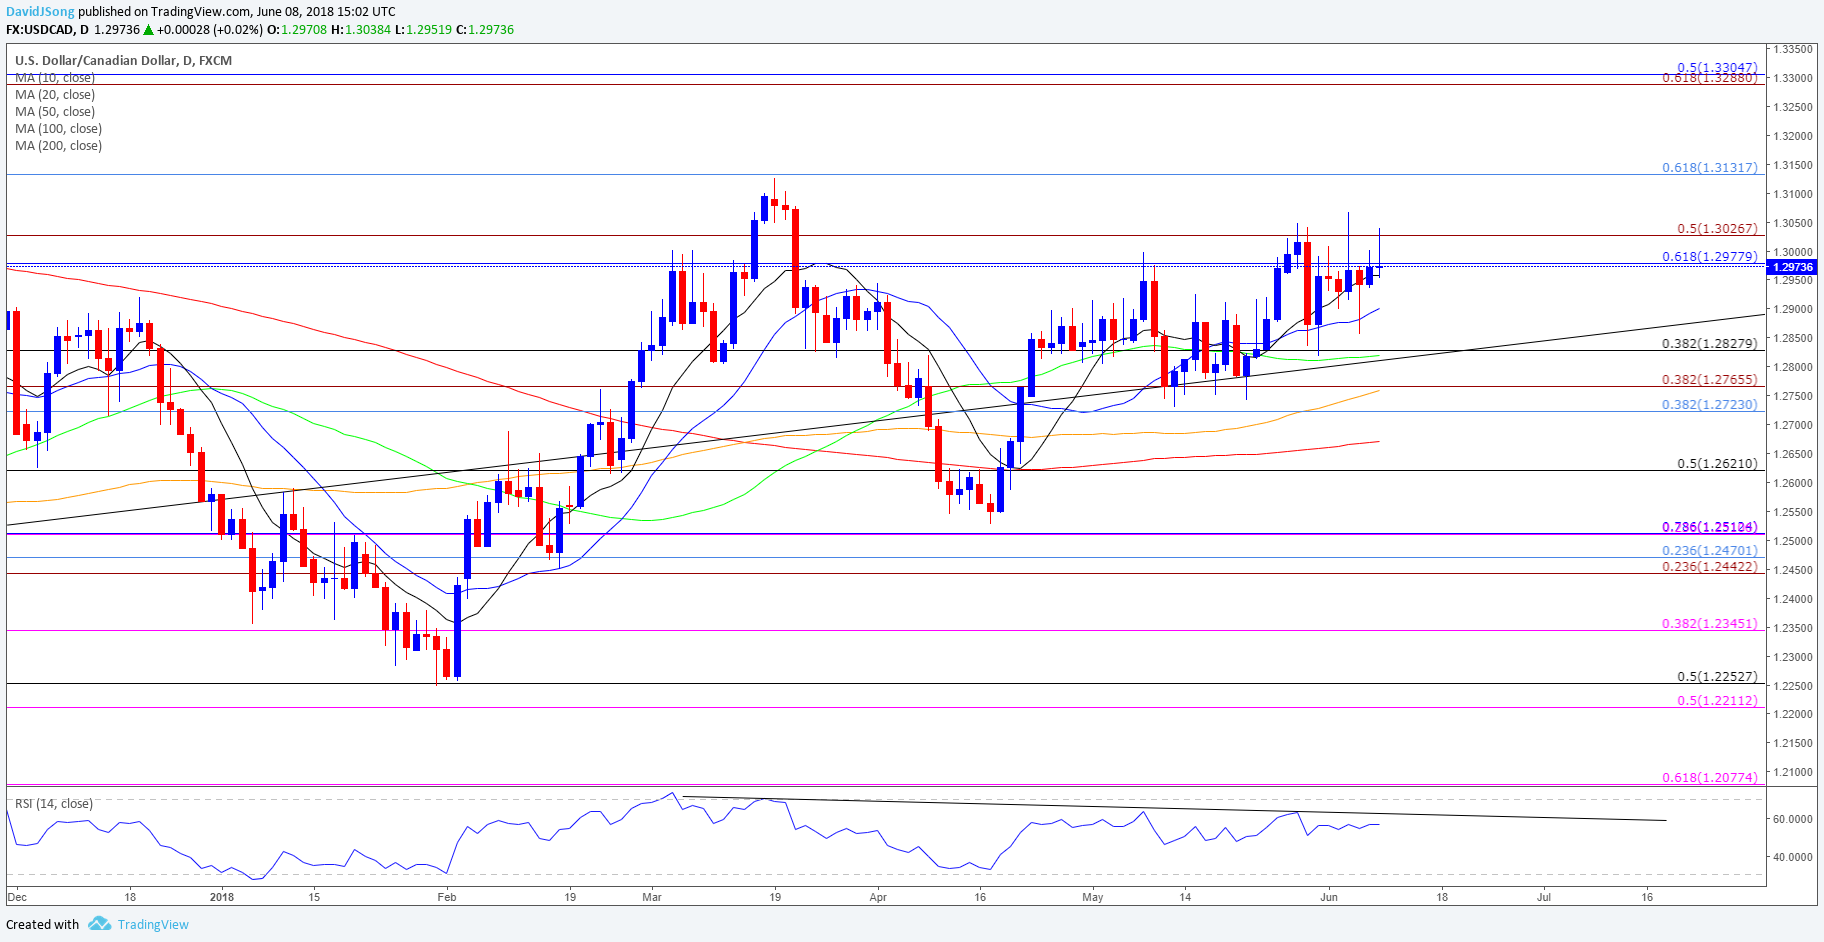
- The 2018-high (1.3125) sits on the radar as USD/CAD carves a bullish sequence, but another failed attempt to close above the 1.2980 (61.8% retracement) to 1.3030 (50% expansion) region raises the risk for range-bound conditions.
- With that said, need to see a break/close below 1.2830 (38.2% retracement) to open up the Fibonacci overlap around 1.2720 (38.2% retracement) to 1.2770 (38.2% expansion), with the next region of interest coming in around 1.2620 (50% retracement) followed by the Fibonacci overlap around 1.2440 (23.6% expansion) to 1.2510 (78.6% retracement).
Interested in having a broader discussion on current market themes? Sign up and join DailyFX Currency Analyst David Song LIVE for an opportunity to discuss potential trade setups!
ADDITIONAL TRADING RESOURCES
Are you looking to improve your trading approach? Review the ‘Traits of a Successful Trader’ series on how to effectively use leverage along with other best practices that any trader can follow.
Want to know what other currency pairs the DailyFX team is watching? Download and review the Top Trading Opportunities for 2018.
--- Written by David Song, Currency Analyst
Follow me on Twitter at @DavidJSong.