


Talking Points:
- The US Dollar is extending yesterday’s rally after the Monday test of Fibonacci support. We have high-impact USD data set to be released on both Thursday and Friday, along with a couple of European inflation prints on the economic calendar. This can keep volatility running across the Greenback as EUR/USD is back to testing the 1.1600-handle.
- This move of US Dollar strength has come along with another bearish push in both EUR/USD and GBP/USD, both of which showed rebounds from key support areas last week. In EUR/USD, the area of interest is the double-bottom around 1.1510, while Cable is fast approaching the 38.2% retracement of the ‘Brexit move’ in the pair.
- DailyFX Forecasts on a variety of currencies such as the US Dollar or the Euro are available from the DailyFX Trading Guides page. If you’re looking to improve your trading approach, check out Traits of Successful Traders. And if you’re looking for an introductory primer to the Forex market, check out our New to FX Guide.
Do you want to see how retail traders are currently trading the US Dollar? Check out our IG Client Sentiment Indicator.
US Dollar Extends Bounce from Fibonacci Support
The US Dollar is continuing yesterday’s rally after a test of a key support zone on the chart. We’ve looked into this area over the past few days, as the prices of 94.20-94.30 are a confluent area of Fibonacci support that had previously helped to define resistance in DXY. This area helped to set swing highs in both October and December of last year, along with a quick iteration of a similar instance in May and June of this year. But after the ECB’s announcement of stimulus exit in the middle of June, the Dollar popped-higher to set a fresh 11-month high. That theme of strength lasted into last Thursday, at which point USD began to pullback. Support began to show on two days ago as buyers started to react to this zone. That theme continued through yesterday and so far this morning as DXY stretches back towards the 95.00 level.
US Dollar via ‘DXY’ Four-Hour Chart: Stretching Back to 95.00 After Test of Fibonacci Support

Chart prepared by James Stanley
The remainder of this week’s economic calendar has high-impact US data set to be released both tomorrow and Friday. We also get a set of European inflation prints that will likely garner considerable attention after the bearish run that’s shown in the single currency over the past couple of months. This is also the final week of Q2, and this presents a backdrop with which quarter-end flows could show in short-term price action.
The big question around the US Dollar is whether we can challenge that 11-month high as we move towards the end of Q2. This would likely need a bit of assistance from sellers in EUR/USD, which is a viable premise given the European data that remains on the calendar for this week. If we do get a push of continuation as we move into Q3, possible resistance exists in DXY at 96.04, 96.51 and then a confluent spot around the 98.00-handle.
US Dollar via ‘DXY’ Daily Chart: Nearing 11-Month Highs as Q2 Winds Down
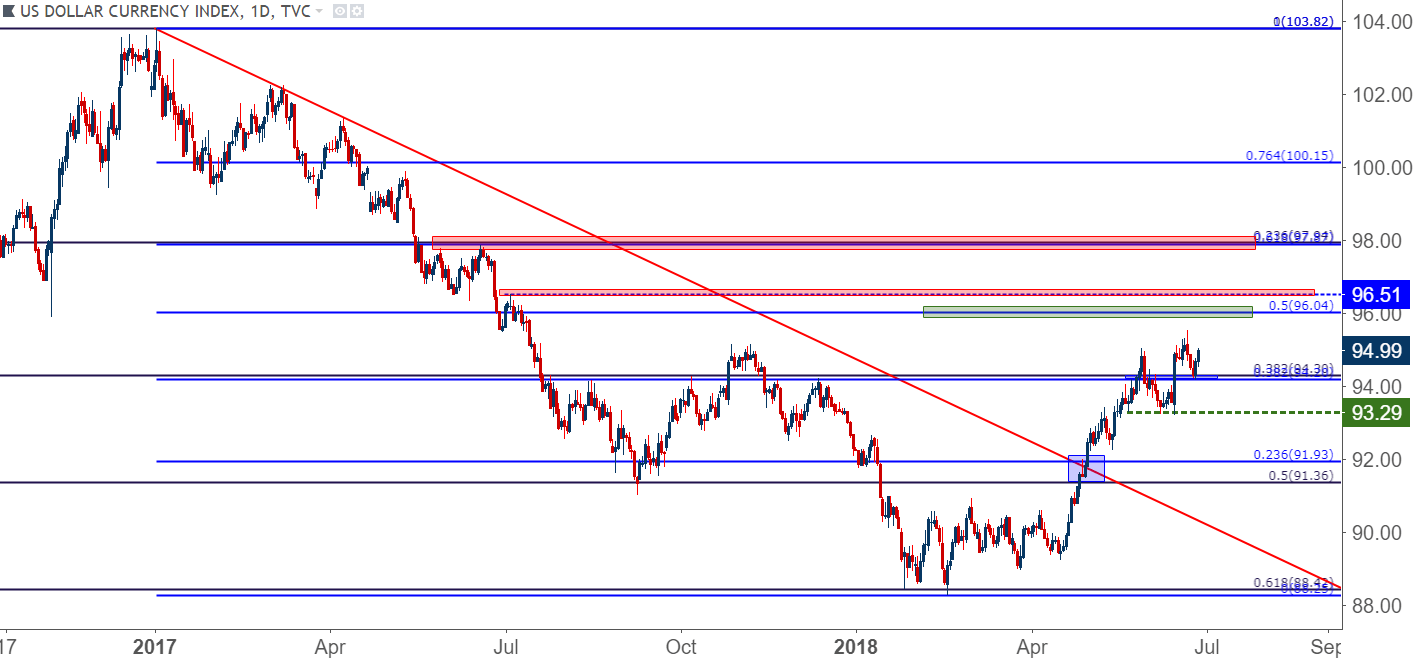
Chart prepared by James Stanley
EUR/USD Sellers Return to Push Back to 1.1600
Bears have shown back-up in EUR/USD after the pair was unable to re-test the resistance zone that we looked at yesterday. This range of prices runs from 1.1685-1.1736, and after showing multiple instances of both support and resistance since August of last year, price action has re-engaged as we look to wind down the first half of 2018.
EUR/USD Daily Chart: Fall From Resistance Zone
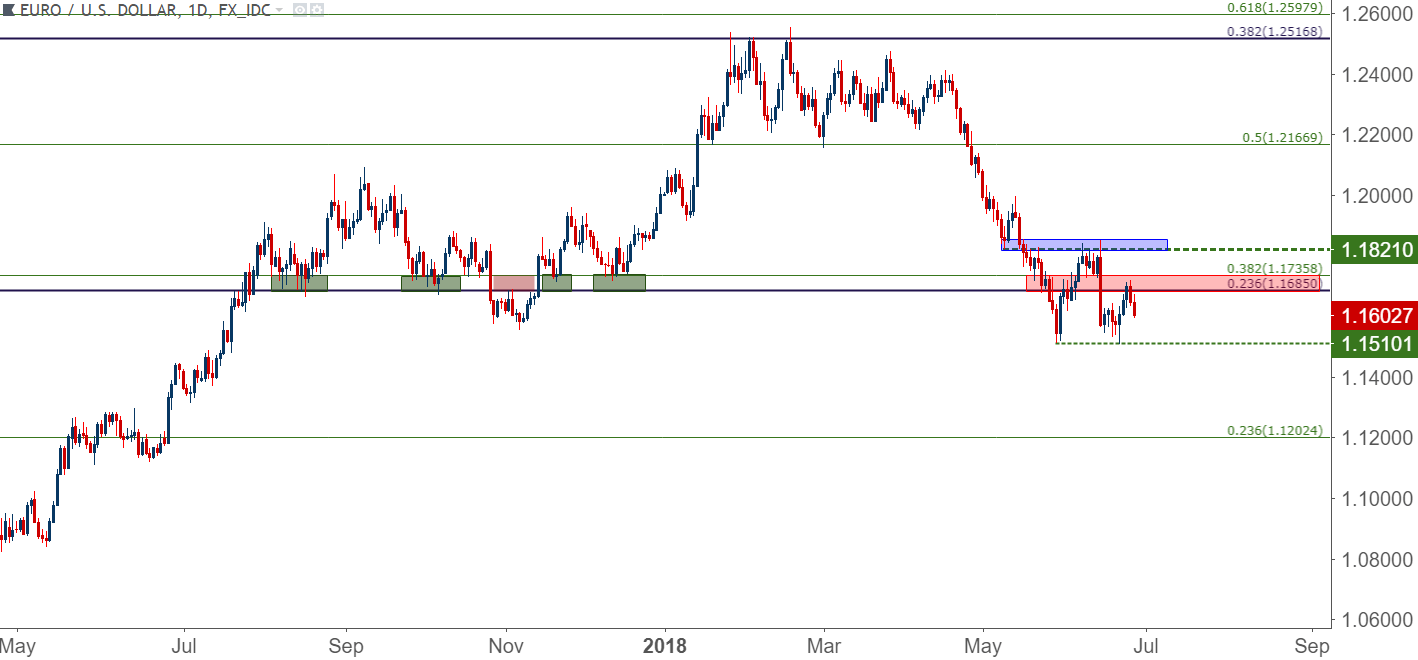
Chart prepared by James Stanley
When prices in the pair were sliding in May, a brief amount of support showed on the top side of this zone; but that was a fleeting theme as it merely led to a lower-high with which bears promptly sold. As we came into June approaching an ECB rate decision in which hopes were high for an announcement of stimulus exit, prices climbed back-above this area, f inding a week worth of support until we finally got to that ECB rate decision. But when the ECB warned that rates would stay at current levels ‘at least through the summer of 2019,’ rate hike hopes were dashed and sellers took-over to push the pair back-below this key zone on the chart.
In the past week, we saw prices climb back-towards that zone, and sellers have come back to push prices back to 1.1600. The big question at this point is whether we challenge that 11-month low as we move towards the end of Q2. And, further, will the pair finally be able to take out the 1.1500 level as we move into Q3?
EUR/USD Four-Hour Chart

Chart prepared by James Stanley
GBP/USD
GBP/USD is also tilting-lower on the morning, and prices are fast approaching a key support level. The price of 1.3117 is the 38.2% Fibonacci retracement of the ‘Brexit move’ in GBP/USD, and this price had helped to bring in a short-term reversal last week. Sellers came-back at the 1.3304 resistance level, at which point we looked at a short-side setup as part of our FX Setups for This Week. Prices have taken out the initial target and are making a fast approach towards that 1.3117 Fibonacci level.
GBP/USD Four-Hour Chart: Falling Towards Fibonacci Support at 1.3117

Chart prepared by James Stanley
If we do get a test below 1.3117, the big question is what happens at 1.3000. This could be a ‘big picture’ support level that can challenge the prospect of bearish continuation, and may even begin to open up the possibility of bullish reversal setups.
GBP/USD Daily Chart: 1.3000 Re-Test in Store?
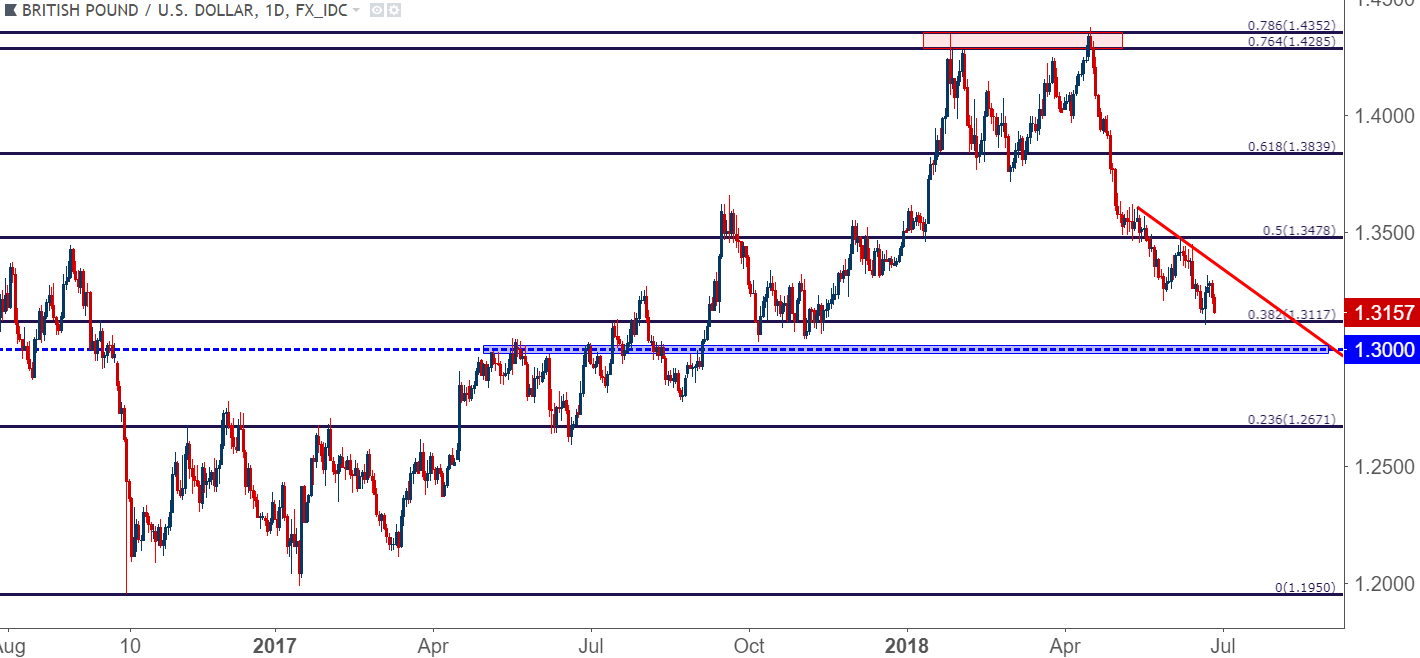
Chart prepared by James Stanley
Prospect of USD Pullback
On the other side of the US Dollar, we looked into USD/CHF for bearish USD setups this week, and prices are now testing above the resistance zone that we were looking to for bearish re-entry. This zone runs from .9890-.9920; and this had enabled the possibility of bearish positions with stops above the psychological level of parity. With prices now testing-higher, the big question is whether we see a turn ahead of that prior zone of resistance around .9980-.9995.
For those looking to fade USD-strength as we move into Quarter-End, this could remain as an attractive vehicle.
USD/CHF Four-Hour Chart: Approaching Prior Lower-High Resistance Below Parity
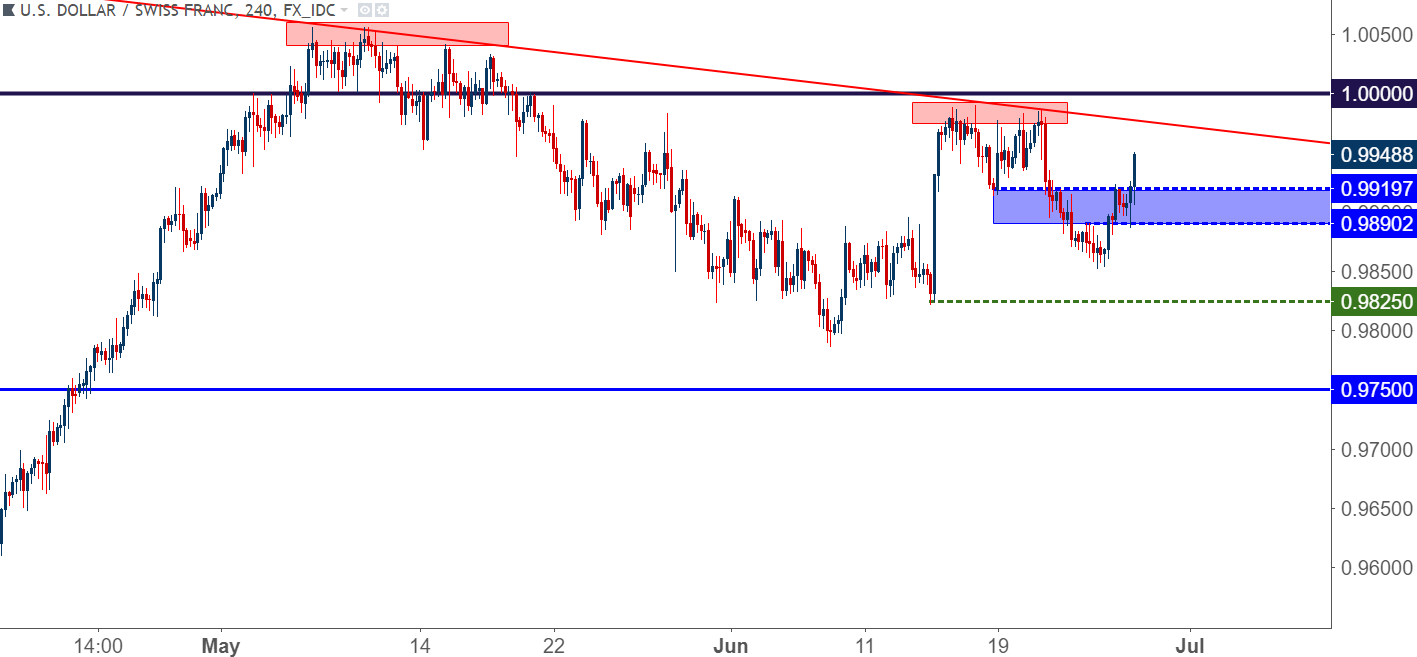
Chart prepared by James Stanley
NZD/USD Range Sees Support Test Ahead of RBNZ
Also of interest on the short-side of the US Dollar is the two-year range that’s built in NZD/USD. In May, it looked as though that range was on the way to filling in on the long side, targeting towards the .7200 level. But prices soon reversed, and now we’re seeing price action test deeper within this longer-term support zone, now just 20 pips away from the two-year low of .6781.
With an RBNZ rate decision on the calendar for tonight, the potential backdrop for reversal exists. Traders would likely want to treat this with caution, as plotting a reversal around a rate decision isn’t always a high-probability type of play; but if we do see strength began to show after tonight’s rate decision, the door could re-open for that range to fill-in; and if that range does begin to fill, there should be time to plot a more orchestrated bullish strategy outside of a brute reversal from a test of two-year lows.
NZD/USD Daily Chart: Prices Testing Support in Multi-Year Range
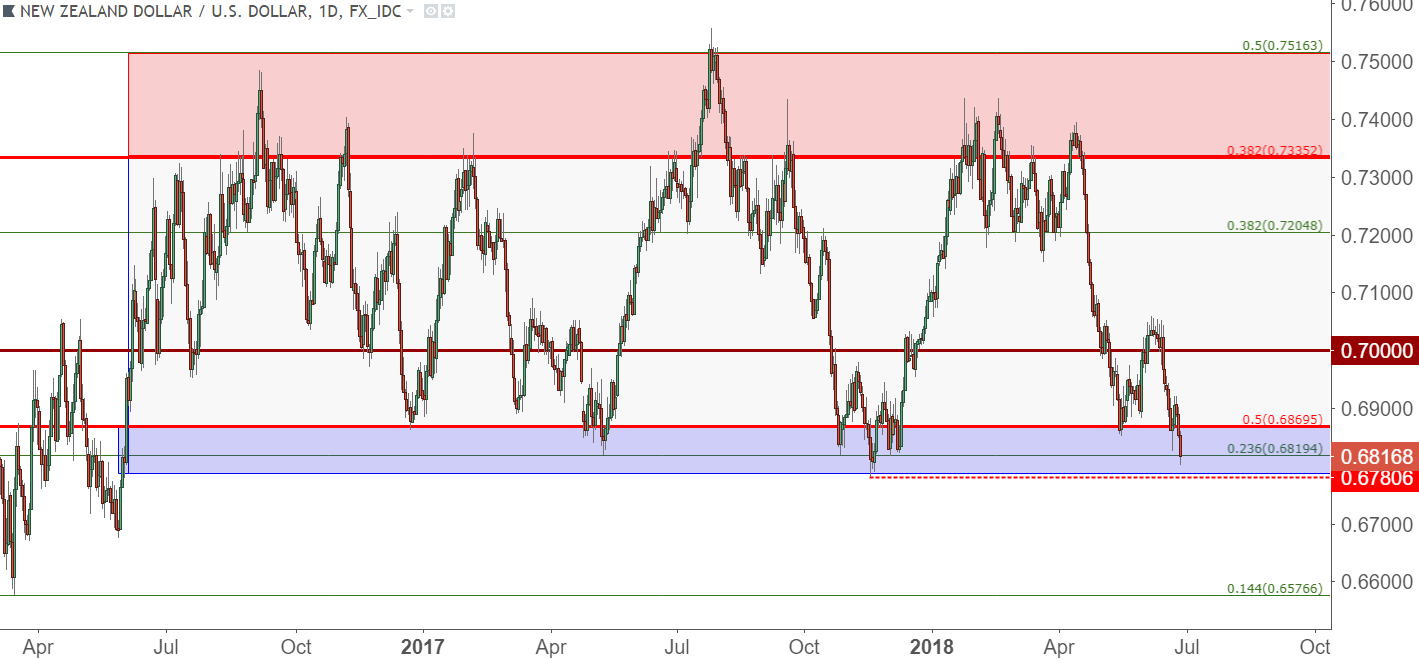
Chart prepared by James Stanley
To read more:
Are you looking for longer-term analysis on the U.S. Dollar? Our DailyFX Forecasts for Q1 have a section for each major currency, and we also offer a plethora of resources on USD-pairs such as EUR/USD, GBP/USD, USD/JPY, AUD/USD. Traders can also stay up with near-term positioning via our IG Client Sentiment Indicator.
Forex Trading Resources
DailyFX offers a plethora of tools, indicators and resources to help traders. For those looking for trading ideas, our IG Client Sentiment shows the positioning of retail traders with actual live trades and positions. Our trading guides bring our DailyFX Quarterly Forecasts and our Top Trading Opportunities; and our real-time news feed has intra-day interactions from the DailyFX team. And if you’re looking for real-time analysis, our DailyFX Webinars offer numerous sessions each week in which you can see how and why we’re looking at what we’re looking at.
If you’re looking for educational information, our New to FX guide is there to help new(er) traders while our Traits of Successful Traders research is built to help sharpen the skill set by focusing on risk and trade management.
--- Written by James Stanley, Strategist for DailyFX.com
Contact and follow James on Twitter: @JStanleyFX


