


Gold Price Weekly Technical Forecast:
- Gold prices have pulled back from last week’s bullish breakout to fresh six-year-highs, and buyers have come back to show higher-low support.
- With the ECB expected to cut rates later this week and the Fed expected to join the softer policy chorus next week, will Gold bulls continue to press the bid to fresh higher-highs?
- DailyFX Forecasts are published on a variety of markets such as Gold, the US Dollar or the Euro and are available from the DailyFX Trading Guides page. If you’re looking to improve your trading approach, check out Traits of Successful Traders. And if you’re looking for an introductory primer to the Forex market, check out our New to FX Guide.
Gold Prices Pullback From Fresh Six-Year-Highs
Gold prices have moderated after last week’s breakout. That bullish push showed-up with aggression last Thursday around some confusion in the US Dollar, with Gold bulls pushing the yellow metal up to fresh six-year-highs. The 1450 level was crossed, albeit temporarily, as a wave of USD-weakness showed through a number of markets. Friday morning trade saw that theme pull back, and Gold prices pulled back to find support around the 1421.22 level, which is the 50% marker of the 2012-2015 major move. This level had previously helped to define resistance and so far this same price has helped to hold support through this week’s open.
Gold Price Two-Hour Chart

Chart prepared by James Stanley
Taking a step back, and Gold prices are currently exhibiting support at prior resistance. For traders looking to move forward in an aggressive manner, this can keep the door open for bullish strategies with stop potential investigated underneath last Thursday’s swing-low, taken from around the 1414 level on the chart; and if that doesn’t hold, bullish entries could be investigated lower, around the same 1400 level that came into play twice last week as support.
Gold Price Eight-Hour Chart
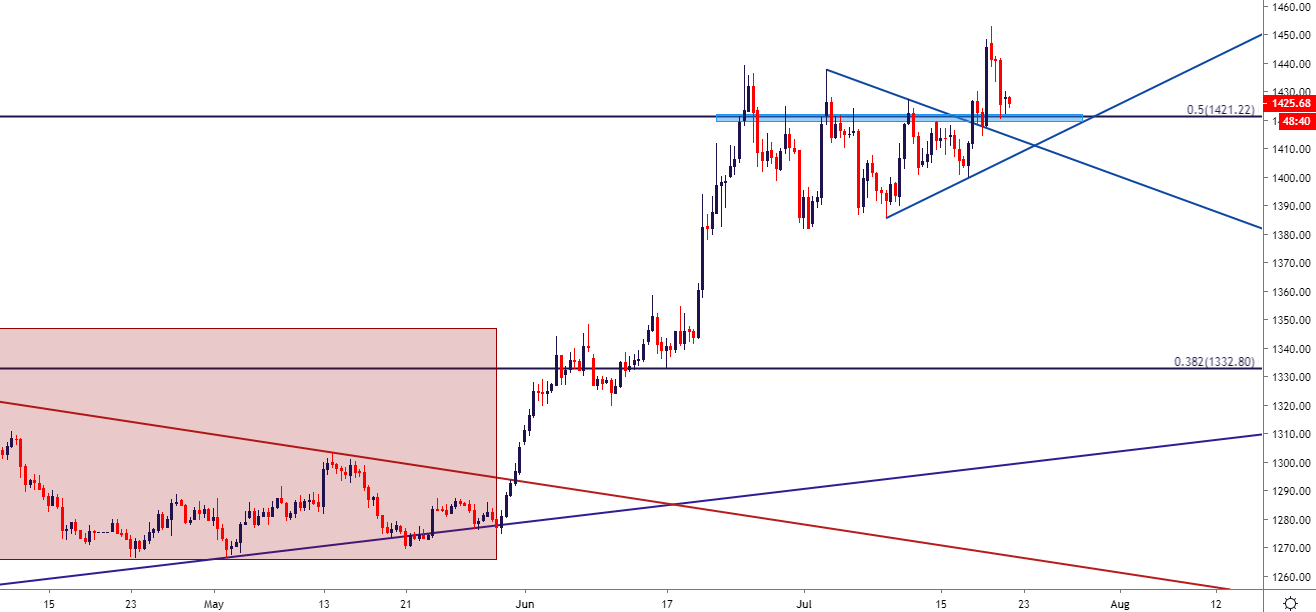
Chart prepared by James Stanley
Gold Prices Longer-Term
Taking a further step back on the chart, and the zone of resistance that’s currently helping to hold short-term support seems an imposing area on the chart. Despite last week’s push up to fresh six-year-highs, this zone has held weekly resistance for the past four completed weeks, and this is reason enough for bulls to keep risk controlled on topside continuation strategies. If this zone of resistance does currently restrain the advance, longer-term support could be sought out around 1375 and 1357.50. Above current prices, should that bullish breakout continue, the big area of attraction on the chart is a zone of confluent Fibonacci levels that runs from 1509-1527. Along the way, shorter-term resistance potential exists around 1462 and 1488.
Gold Price Weekly Chart
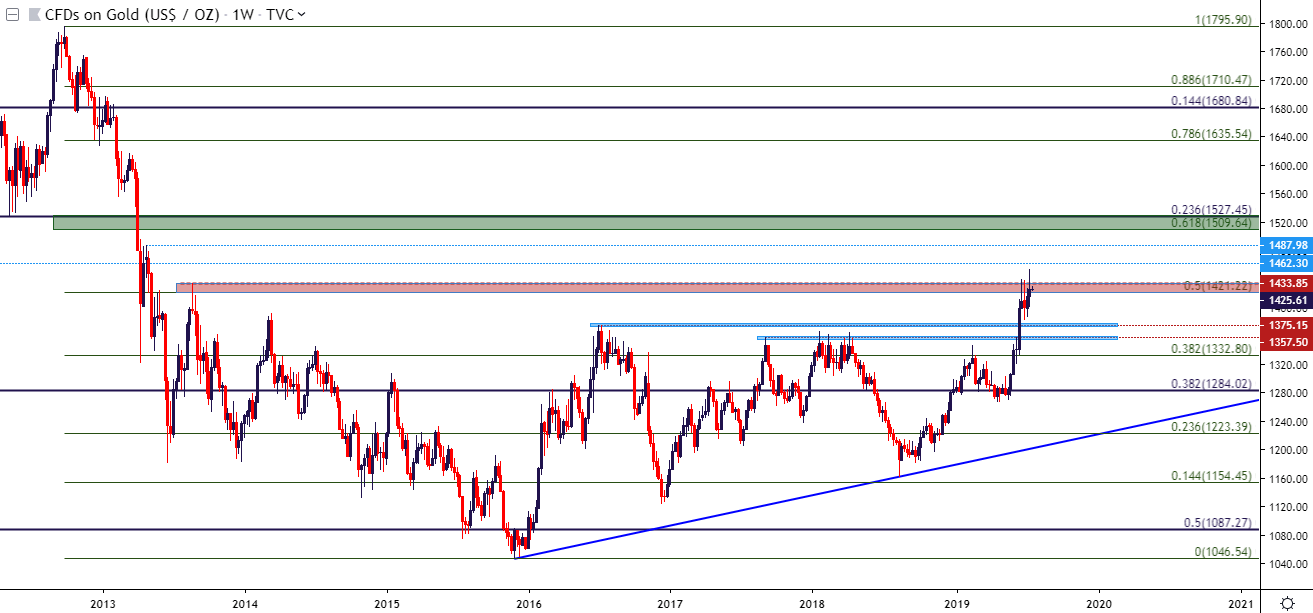
Chart prepared by James Stanley
To read more:
Are you looking for longer-term analysis on the U.S. Dollar? Our DailyFX Forecasts have a section for each major currency, and we also offer a plethora of resources on Gold or USD-pairs such as EUR/USD, GBP/USD, USD/JPY, AUD/USD. Traders can also stay up with near-term positioning via our IG Client Sentiment Indicator.
Forex Trading Resources
DailyFX offers an abundance of tools, indicators and resources to help traders. For those looking for trading ideas, our IG Client Sentiment shows the positioning of retail traders with actual live trades and positions. Our trading guides bring our DailyFX Quarterly Forecasts and our Top Trading Opportunities; and our real-time news feed has intra-day interactions from the DailyFX team. And if you’re looking for real-time analysis, our DailyFX Webinars offer numerous sessions each week in which you can see how and why we’re looking at what we’re looking at.
If you’re looking for educational information, our New to FX guide is there to help new(er) traders while our Traits of Successful Traders research is built to help sharpen the skill set by focusing on risk and trade management.
--- Written by James Stanley, Strategist for DailyFX.com
Contact and follow James on Twitter: @JStanleyFX


