Inequality is getting more attention in efforts to monitor development progress. Alongside established measures of poverty and human development there have been calls for monitoring inequality. How should this be done?
We focus here on just one aspect of inequality, though an important aspect, namely the inequality of consumption or income. This is about “inequality of results” not “inequality of opportunities,” which may be more important but is much harder to measure. And there are other dimensions of inequality that matter, such as inequality in access to health and education services. But this is the obvious place to start.
If we measure “global inequality” similarly to how we typically measure global poverty (such as the World Bank’s “$1 a day” measures) then we would ignore all country borders, pooling all residents, and measure the inequality amongst them as if the “globe” was one country. This overall inequality measure will naturally depend on the inequality between countries as well as that within them. Thus its evolution over time will depend on growth rates in poor countries relative to rich ones (roughly speaking), as well as the things happening within countries that impact on inequality.
However, if we want to track the “inequality performance” of developing countries or some subset of countries (such as a specific region) then we will probably want to isolate the within-country component of inequality. After all, this is what country efforts to reduce inequality are focusing on.
To see why this matters, consider China. Around 1980, China was one of the poorest countries in the world. Its subsequent high rates of growth reduced global inequality, and inequality in the developing world, and also in the East Asia region. So we might conclude that the countries of East Asia were doing well against inequality. But that would clearly be deceptive. Indeed, inequality was rising sharply in China from the early 1980s, and also rising in some other countries in East Asia. This illustrates that the within-country component can evolve quite differently to the between-country component.
How then can we isolate the within-country component for monitoring overall inequality? There are many inequality measures, and one can always calculate the average inequality index for a group of countries. However, only for a subset of existing inequality measures will that average accord with the within-country component of total inequality, implying a clean separation of the part we are interested in from the total inequality. Such an exact decomposition is known to be impossible for the popular Gini index. However, a less well-known inequality measure, the mean-log deviation (MLD), offers a practical solution. The MLD is simply the difference between the log of the group’s mean consumption and the mean of the logs of all the consumptions within that group. This is known to have a number of desirable properties, including exact decomposability by population sub-groups. The population-weighted MLD gives the contribution of inequality within countries to overall inequality.
We have just made some calculations of MLD across developing countries using 850 household surveys back to about 1980. We have used the database of PovcalNet and (when relevant) we have used the same methods as for our global poverty measures, including how we line up the estimates to specific reference years. (On the methods we use for measuring global poverty see our paper here.) The data have their problems, as always. For example, we have preferred to use consumption-based distributions, as consumption is expected to provide a better indicator of economic welfare than current income. However, incomes are more commonly used in some countries, notably in Latin America. Incomes tend to show higher inequality than consumption for the same economy.
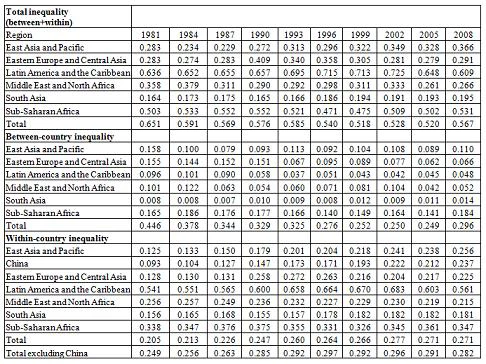
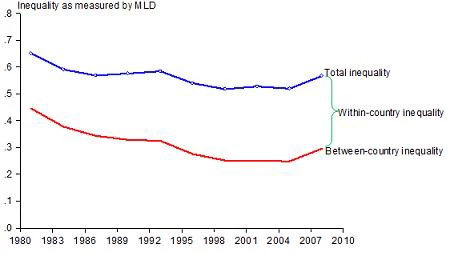
Table 1 gives our estimates by region, spanning 1981-2008 at three-yearly intervals. The top panel gives total inequality and then we give the breakdown into between and within components. Figure 1 plots total inequality for the developing world as a whole and the between-country component.
Table 1: Inequality between and within countries by region and year
Click here to see a larger version of Table 1.
We see that there has been a trend decrease in total inequality, though with ups and downs, and an increase over 2005-08. However, that pattern has largely been due to inequality between countries.
Figure 1: Inequality in the developing world
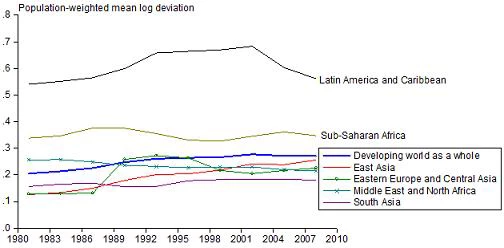
Figure 2: Evolution of average inequality within countries
The gap between the two lines in Figure 1 is the within-country component, which is what we now focus now. Over the period as a whole, we see that this has risen. This is also evident if one takes out China, which has a high weight, and also saw a large increase in inequality (Table 1, bottom panel). The within-country component accounted for less than one third of inequality in the developing world as a whole in 1981, but almost half in 2008. Figure 2 plots the within-country component by region.
How then do different regions compare in their inequality performance? Here are a few observations from Table 1 and Figure 2:
• Latin America and the Caribbean (LAC) has persistently been the region with highest average inequality within countries. Over 90% of LAC’s inequality is within countries. As others have noted, inequality has been falling noticeably in LAC since around 2000.
• Sub-Saharan Africa (SSA) is the region with the second-highest average inequality, though with no clear trend in either direction.
• South Asia has generally been a region of low inequality in incomes, though rising since the early 1990s.
• East Asia started out as the region with lowest inequality within countries, but has seen a steady rise in inequality (side-by-side with a trend reduction in inequality between countries).
• Eastern Europe and Central Asia (EECA) saw a sharp rise in average inequality in the 1990s (coming with the transition to a market economy) but has seen generally falling inequality since then.
• The Middle East and North Africa (MENA) has seen steadily falling average inequality.(Think again if you had thought rising inequality led to the Arab Spring—though inequalities of opportunity may well have played a role.)
We welcome feedback on our proposed method for monitoring inequality and on the results reported here.
Further reading on inequality: The 2006 World Development Report, Equity and Development, contains a wealth of information and insights, with special emphasis on inequality of opportunity. For a good exposition of the various ways inequality can be measured see Branko Milanovic’s book, Worlds Apart. For the more technically oriented, Francois Bourguignon’s 1979 paper provides an elegant treatment of the theoretical properties of MLD.


Join the Conversation