People who look at the Doing Business report’s Trading Across Borders indicator and the Logistics Performance Index (LPI) often wonder why one country can perform well on one of the rankings but not so well on the other although they both measure trade and logistics. In fact, earlier this year, the Doing Business team organized a workshop at the World Bank Global Knowledge and Research Hub in Kuala Lumpur to clarify the differences between the two datasets.

Let’s start off with a few definitions:
The Doing Business report is a World Bank Group flagship publication, which covers 11 areas of business regulations. Trading Across Borders is one of these areas. It looks specifically at the logistical processes of exporting and importing. Data is updated annually and the latest edition covers 190 economies. Doing Business collects data from local experts and measures performance as reported by domestic entrepreneurs, while taking into consideration factual laws and regulations.
The Logistics Performance Index is a benchmarking tool which focuses on trade logistics. It is created to help countries identify the challenges and opportunities they face as they relate to customs, border management, transport infrastructure, and logistics services. Updated biennially, the latest data and report cover 160 economies. Data is collected from global freight forwarders and express carriers who provide feedback on the logistical “friendliness” of the countries they operate.
Looking deeper into the methodology:
Doing Business follows very specific case study assumptions, to allow for comparability across all countries included in the report. For example, Malaysia imports car parts from Thailand and exports electrical machinery to China. The Doing Business indicator looks uniquely at the time and cost associated with documentary and border requirements and regulations mandatory for a shipment to cross the economy’s border. The Trading Across Borders ranking is based on the distance to the frontier scores of the eight indicators.
The LPI on the other hand, does not follow specific case study assumptions. The survey invites the respondents to rate from very low (1) to very high (5) the overall logistics “friendliness” of eight countries in which they operate along six areas. The six areas that are evaluated include: (1) Customs, (2) Infrastructure, (3) Ease of arranging shipments, (4) Quality of logistics services, (5) Tracking and tracing, (6) Timeliness. The LPI score is constructed from these six indicators using principle component analysis.
Table 1. Summary of selected differences between the Doing Business Trading Across Borders indicator and Logistics Performance Index
| Trading Across Borders | Logistics Performance Index | |
|---|---|---|
| Overview | One of the 11 areas of business regulations measured by the Doing Business report | Interactive benchmarking tool measuring performance on trade logistics |
| Coverage | 190 economies in the latest edition | 160 countries in the latest release |
| Data update | Annually | Biennially |
| Focus | Experts answer specific questions on their country's domestic logistics processes | Each survey respondent rates eight foreign countries about their logistics "friendliness" |
| Case study | Very specific case study assumptions | No case study is applied |
| Areas measured | Eight dimensions of trade, focusing on the time and cost for border and documentary compliance during export and import | Six dimensions of trade, focusing on quality of customs, infrastructure, arrangements of shipments, logistics services, tracking and tracking consignments and frequency with which shipments reach consignees |
| Ranking | Based on the distance to frontier score for eight indicators | Based on the six indicators using principle component analysis |
What is the relationship between the two scores?
Analysis shows that economies that perform well in the Doing Business Trading Across Borders indicator also tend to perform well on the Logistics Performance Index. For example, The Netherlands ranks 1st on Trading Across Borders and 4th on the Logistics Performance Index; Mongolia ranks 103 on Trading Across Borders and 108 on the Logistics Performance Index. This also means that there is a positive association between the rating that experts provide in the Logistics Performance Index survey and the responses reported by local experts in the Trading Across Borders questionnaire (Figure 1).
Figure 1. Relationship between Trading Across Borders rank and Logistics Performance Index rank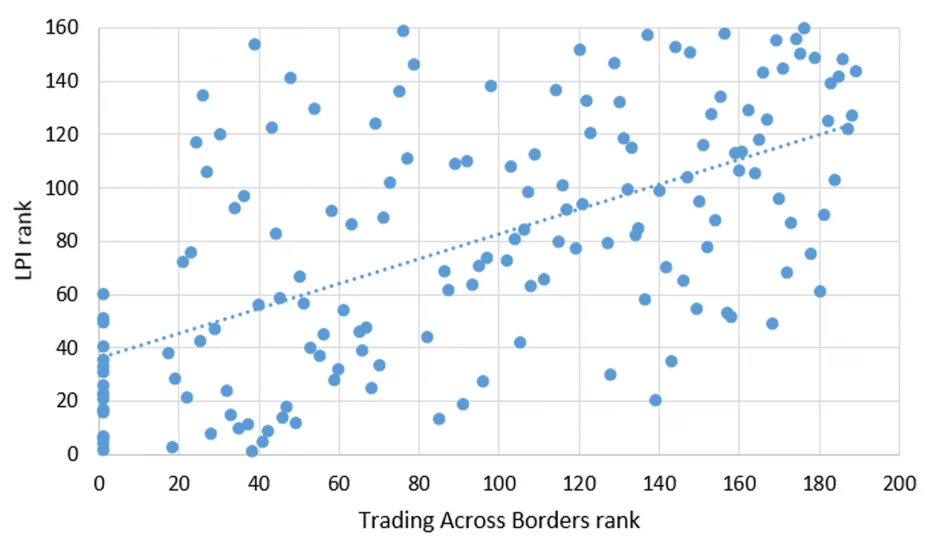
Source: Doing Business 2017 and Logistics Performance Index 2016. The correlation between the Trading Across Borders rank and the Logistics Performance Index rank is 0.59. The relationship is significant at the 1% level after controlling for income per capita. The sample includes 144 countries.
Both reports are standalone products of the World Bank Group and while some similarity between the two may be observed due to their largely shared theme, the two products are methodologically and conceptually different. That said, both datasets are powerful tools which complement each other and help policymakers pinpoint specific areas of logistics and trade that they need to improve.


Join the Conversation