As the number of RCTs increase, it’s more common to see ex ante power calculations in study proposals. More often than not, you’ll see a statement like this: “The sample size is K clusters and n households per cluster. With this sample, the minimum detectable effect (MDE) is 0.3 standard deviations.” This, I think, is typically insufficient and can lead to wasteful spending on data collection or misallocation of resources for a given budget.
Sometimes, the statement does not even specify what outcome variable the power calculation is referring to. Of course, the formula doesn’t care, but this does not mean it is irrelevant – quite the contrary. So, while David McKenzie and Abhijit Singh covered this topic really well in subsequent posts about a year ago, I will repeat a few tips/warnings for colleagues who do these calculations for their studies.
The 'so-called' rules of thumb are useless without context: Suppose that you conducted a calculation like the above and happily arrived at the conclusion that your budget allows you to have a sample size that yields an MDE of 0.3. That sounds big – many folks would be impressed with that. Suppose, however, that your program is productive inclusion for the poor and that you’re interested in monthly consumption expenditures per capita (pce). In one country for which I have consumption data, the standard deviation of pce is one-sixth of the mean among the poor. So, a positive effect size of 0.3 SD would mean an increase of 5% of the mean. If, in the absence of the program, you would have made $1,000 per month, now you’re making $1,050. Is that a large increase? I guess, we could debate this, but I don’t think so: many safety net cash transfer programs in developing countries are much more generous than that. So, we could have just given that money away in a palliative program – but I'd want much more from my productive inclusion program with all its bells and whistles.
In many instances, calculations have not been optimized with supporting measures: Generally, the calculations you see will not have factored in blocked randomization, use of baseline controls, selecting the sample to reduce the variance (as appropriate), etc. I even find that the intra-cluster correlation (ICC) coefficients can be too conservative. It’s common to see ICC set to 0.1: yes, for some variables ICC is that high or even higher. But, I have also seen ICCs for outcome indicators that are as low as 0.01. These improvements can make a big difference to the standard errors of impact estimates – sometimes reducing them by more than 20-30%. Many power calculation packages allow you to incorporate these factors (and even things like the variance in cluster sizes), so there's no excuse not to use them. Furthermore, try to get a good estimate of the ICC – perhaps during the pilot phase by using a few clusters rather than just one: it may cost a little more at that time, but could save a lot more during the regular survey phase.
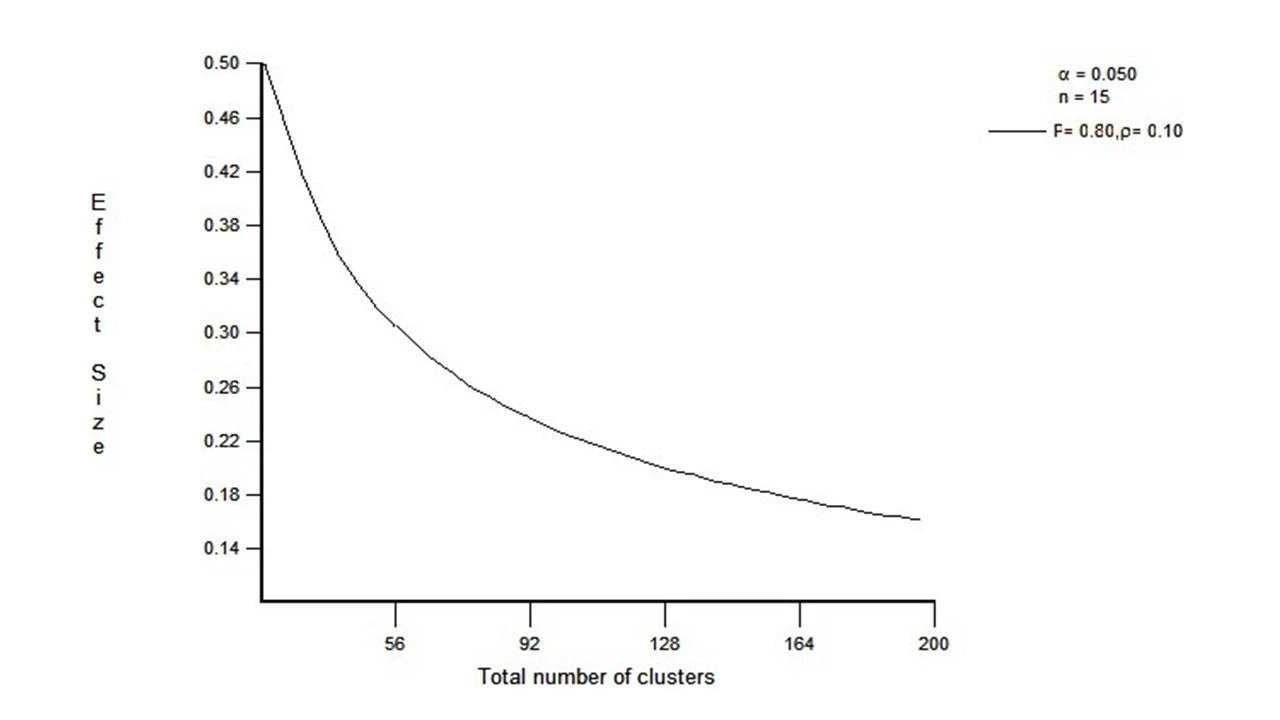
Diminishing returns to more clusters kicks in relatively quickly: Think of the same example of pce as above, but now imagine that you’ve powered yourself to detect 0.16 SD effects for a two-arm study. 100 villages per arm with 15 households per village will get you this MDE if the ICC=0.1, with no other improvements. But, that’s a lot of villages to cover. What would happen if you subtracted 33 villages from each arm, leaving each with 67? The MDE only goes up to 0.2 SD. In terms of the example above, this is the difference between being able to detect a 2.67% increase in pce vs. 3.33%! In a lot of cases, I'd be happy to trade off that increase in MDE for either saving 30% in variable survey (and intervention) costs or perhaps actually add a third arm (of 66 villages) to test an important mechanism. This happens because the decline in the MDE slows down dramatically after 50-60 clusters (all else equal):
One final example: In one of our projects dealing with early childhood assessments, we were doing ex ante power calculations with the Peabody Picture Vocabulary Test (PPVT) in Malawi. Given that many interventions do not produce impacts above 0.1-0.2 SD, it would have been tempting to use a figure in this range. But, with a standard deviation of about 6 (and mean=25 correct answers), that would be equivalent to a one-question improvement, which our ECD experts did not think was a substantial enough improvement worth detecting. So, we ended up powering the study for an MDE of more around 0.3 SD, which was much easier on our budget. And, with the care that went into block randomization and using ANCOVA with some powerful baseline predictors of follow-up child assessments, we were able to detect effects a little lower than that, despite the fact that PPVT did end up having a higher ICC than we originally had guessed.
Takeaways:
- Think about the meaningful effect size in your context and given program costs and aims.
- Power your study for large effects, which are less likely to disappear in the longer run.
- Try to use all the tricks in the book to improve power and squeeze more out of every dollar you’re spending.

Join the Conversation