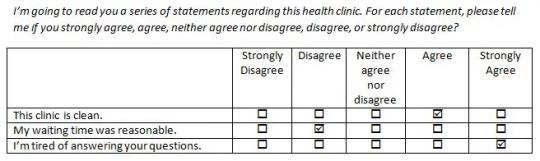
Recently Dave was in Nigeria piloting a patient exit survey for health facilities, and we had a section similar to the one above. Watching the enumerator patiently try to explain, repeatedly, the difference between “strongly agree” and “agree” seemed painful for all involved. (Do you just agree? Or do you strongly agree? Yes, for the next statement, too.) So on the second day of piloting, we use a binary scale: Do you agree or disagree? It was much less painful, but what if all the variation in opinions was not between agreeing and disagreeing but rather in shades of agreement? Maybe this intervention takes people from mild enthusiasm for the clinic’s cleanliness to radical enthusiasm. On the other hand, how much of that variation is just noise?
There is a whole literature on this agree-disagree style of survey item, sometimes called a Likert item. When you tally up the responses across the items, that’s a Likert Scale. (That’s pronounced lick-ert, and has been called by Latham (2006) “ among the most mispronounced in [his] field.”) The traditional Likert item has 5 choices: Strongly Disagree | Disagree | Neither agree nor disagree | Agree | Strongly Agree. But there are a range of design options.
How many response choices should we include? In 2010, Lietz put out a wide-ranging review piece on questionnaire design issues (from the reliability of frequency adverbs – e.g., never, frequently, always – to the use of negative versus positive formulations). (Earlier, ungated version available here.) She concludes, across a range of studies comparing 5-point and 7-point scale responses, that 7-point scales are usually more reliable, with more differentiation of responses than the 5-point scale. (To imagine a 7-point scale, imagine adding a “weakly agree” and “weakly disagree” into the mix.) But the evidence she cites isn’t unanimous, and some of it finds reliability advantages only in some samples.
My key concern with introducing more items was that we would just be introducing noise. One article that simultaneously argues against Lietz’s consensus (towards more items) but also suggests that more response items don’t induce more noise is Jacoby & Mattell’s 1971 descriptively entitled piece, “Three-Point Likert Scales Are Good Enough,” in which they gave a survey of 60 statements to 360 undergraduates. Students received anywhere from a two-response scale to a nineteen-response scale. (Just how strongly do you disagree?) Three weeks later, they administered the same test to students again. They found that the inter-temporal reliability was completely independent of the number of response possibilities: So more items didn’t increase the noise.
Take away: At least from evidence in high-income countries, the evidence seems to lean toward more items, but given that the evidence is quite mixed, there probably isn’t much loss by adapting a three-point scale (agree, neither, disagree) if the costs of applying larger scales are high (i.e., it’s very difficult for respondents to understand them).
Should I include the “neither agree nor disagree” option? Across studies, introducing a middle option attracted between 6% and 23% of respondents. It does not appear related to observed respondent characteristics (age, gender, education), and most of the draw is from weakly agree and weakly disagree options (not from “don’t know”) (This is from Lietz again.)
A key concern with “neither agree nor disagree” is that people will satisfice, a term explained by Krosnick (1991) to mean that respondents just answer something that will satisfy the interviewer while minimizing cognitive effort. However, Lietz reports extensive evidence – including from a large meta-analysis – that the neutral middle point lowers random error variance: In other words, eliminating the neutral middle does indeed increase noise.
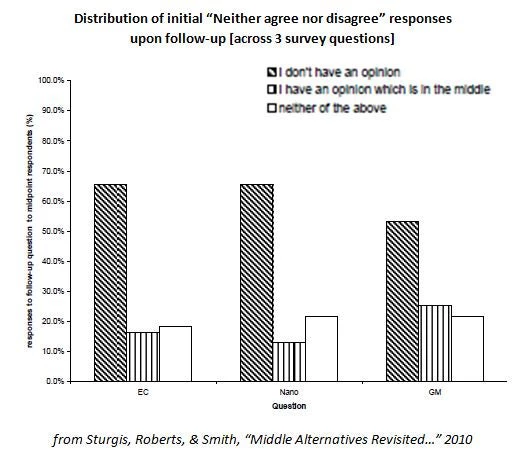
An interesting caveat to this is highlighted by Sturgis et al (2010): “Neither agree nor disagree” can either be a “hidden don’t know” (i.e., the respondent has no opinion) or it can mean a neutral opinion (i.e., the respondent is somewhere between agreeing and disagreeing). In a survey of about 3,000 respondents in Great Britain, researchers asked all those who said “neither agree nor disagree” whether they actually meant “don’t have an opinion” (which the researchers call the “hidden don’t know”) or “have an opinion which is in the middle”. The vast majority said that they didn’t really have an opinion (per the figure below): i.e., “don’t know” may have been a more apt characterization.
Sturgis et al. don’t really have a solution beyond the time-consuming option of adding a follow up question for every “neither agree nor disagree”, but for robustness it may be worth re-coding neutral responses as “don’t knows” and seeing how much it affects results. (In their sample, it matters!)
Most of this evidence is from the United States or Europe. Si & Cullen (1998) compare responses to manager surveys across the U.S., Germany, and the UK, as compared with China and Japan, finding that the latter respondents were much more likely to choose the neutral category, potentially making a larger scale with more mild responses attractive, as suggested by Sishido & Iwai (2011) – e.g., “Do you ever-so-slightly agree?”
Take away: It probably makes sense to include a neutral category, but beware (and maybe do a robustness check) in case it’s just capturing people too embarrassed to admit outright that they don’t know. And pre-test! In particular, check whether your neutral option is sucking up all your variation.
Use a visual aid? Likert items are often accompanied by visual analogue scales.
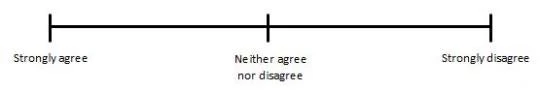
The evidence on the clarifying effectiveness of this in low-income contexts seems to be limited.
Other issues! Obviously responses for Likert items is one issue among myriad for survey design and application. A growing literature explores the adaptation of surveys across countries: Smith (2004) provides an overview, touching on issues ranging from translation for interpretive equivalence, to how different levels of acquiescence and preferences for visually or orally presented responses across cultures can bias responses if they are not taken into account during question design.
It seems clear that there is lots of room for additional work in capturing the strength of people’s opinions in low-income and low-education contexts. If there are literatures I’m missing, please let me know. Or do a study and I’ll blog about it.


Join the Conversation