It is generally thought that two groups are the big winners of the past two decades of globalization: the very rich, and the middle classes of emerging market economies.
The statistical evidence for this has been cobbled together from a number of disparate sources. The evidence includes high GDP growth in emerging market economies, strong income gains recorded for those at the top of the income pyramid in the United States and other advanced economies, as well as what seems to be the emergence of “a global middle class” and casual observations of the rising affluence of Chinese and Indians.
Until now, there was no single source from which these insights could be checked, confirmed, qualified or rejected.
However, thanks to a database of household surveys put together recently by the World Bank, we can actually find out for the first time, from a single and consistent data source, who the real winners and losers of globalization are. The results give us a much more finely grained picture of the effects of the two recent decades of globalization.
The new data set represents a compilation of household surveys from more than 120 countries for the period 1988-2008, “centered” at five-year intervals, at 1988, 1993, 1998, 2003 and most recently, 2008. Household surveys are nationally representative surveys of people’s income or consumption.
When household surveys are conducted in a sufficient number of countries, they can be combined to produce a true depiction of global income distribution. Of course, for them to be comparable also requires adjusting incomes that are reported in national currencies. This adjustment is done by converting incomes into so-called dollars of equal purchasing parity (PPP dollars) such that with $PPP 1 dollar, a person can purchase the same amount of goods and services in any part of the world.
Who gained and who lost?
What parts of the global income distribution registered the largest gains between 1988 and 2008? As figure below shows, it is indeed among the very top of the income distribution and among the emerging global middle class, which includes more than a third of the world’s population, that we find most significant increases in per capita income.
Percentage change in real income, 1988-2008, at various percentiles of global income distribution (calculated in 2005 Purchasing Power Parity/PPP dollars)
Note: based on preliminary calculations.
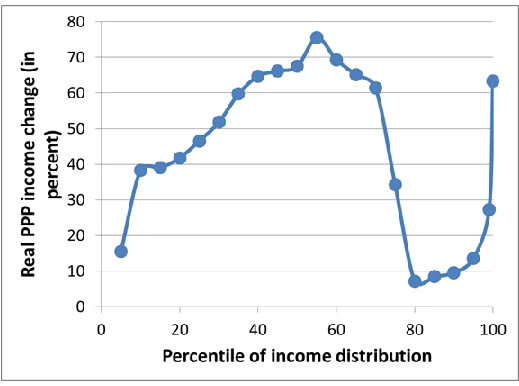
The top 1% has seen its real income rise by more than 60% over those two decades. (All the amounts are expressed in 2005 international dollars.)
An even greater increase was realized by those parts of the global income distribution that lie around the median: almost 80% real increase at the median itself, and some 70% around it.
It is there, between the 50th and 60th percentile of global income distribution (which in 2008, includes people with annual after-tax per capita incomes or consumption between 1,100 and 1,600 international dollars) that we find some 270 million Chinese, 40 million Indians, 35 million Indonesians, and about 20 million people each from Brazil, Egypt and Mexico.
The surprise is also that those at the bottom third of the global income distribution have also made significant gains, with real incomes rising between more than 40% and up to 60%. The only exception is the poorest 5% of the population whose real incomes have increased by 16% only. These numbers however should be taken with a grain of salt because among the very poor, we deal with people whose incomes are less than $PPP 300 and small variations in sample composition and measurement, can change the results by amounts of 10 or 20 dollars, per year, which, translated in percentages, may produce large gains or losses. So, the best we can say is probably that the very bottom of the global income pyramid remained about as equally poor in 2008 as twenty years earlier.
But more substantial and thus more certain increases in income among those slightly less poor allowed the proportion of what the World Bank calls the absolute poor (people whose per capita income is less than 1.25 PPP dollars per day) to decrease from 44% to 23% over approximately the same 20 years.
The biggest “non-winner” (other than the very poorest 5%) of globalization were those between the 80th and 90th percentile of the global income distribution whose real income gains were in single digits. These people, who can be called a global upper-middle class, include many from former Communist countries and Latin America, as well as citizens of rich countries with stagnant real incomes.
How global distribution changed
Global income distribution has thus changed in just two decades, from the fall of the Berlin Wall to the global financial crisis, in a most remarkable way. Without exaggeration, it is probably the profoundest global reshuffle of people’s economic positions since the Industrial revolution.
Very interesting developments happened among the top quartile: the top 1%, and somewhat less so the top 5%, gained significantly, while the next 20% in the global income distribution either gained very little or faced almost stagnant real incomes.
This created polarization among the richest quartile of the world’s population, allowing the top 1% to pull ahead of the other rich and to reaffirm both in fact and in public perception its preponderant role as winners of globalization. The fact that more than 1/4 of absolute income gains went to the top 1%, and more than ½ to the top 5%, probably further reinforced that perception.
Who are the people in the global top 1%, those with 2008 after-tax per capita income above $PPP 42,000? There we find the richest 12% of Americans -- more than 30 million people -- and between 3% and 6% of the richest British, Japanese, German and French. As well as 9% of the richest Singaporeans and Swiss.
It is a “club” still overwhelmingly composed of the “old rich” world of Western Europe, North America and Japan. The richest 1% of the embattled Euro countries of Italy, Spain, Portugal and Greece are all part of the global top 1 percentile. However, the richest 1% of Brazilians, Russians and South Africans belong there, too.
To which countries and income groups do the winners and losers belong? Consider the people in the median of their national income distributions in 1988 and 2008.
In 1988, a person with a median income in China was richer than only 10% of world population.
Twenty years later, a person at that same position within Chinese income distribution, was richer than more than one-half of world’s population. Thus, she leapfrogged over approximately 40% of people in the world.
For India, the improvement was more modest, but still remarkable. A person with a median income went from being at the 10th percentile globally to the 27th, while a person at the same income position in Indonesia went from the 25th to 39th global percentile.
An average person in Brazil gained, too. She went from being around the 40th percentile of global income distribution to about the 66th.
The position of large European countries and the United States remained about the same, with median income recipients there in the 80s and 90s of global percentiles.
So who lost between 1988 and 2008? Mostly people in Africa, some in Latin America and former Communist countries.
In 1988, an African with the median income of the continent had an income equal to two-thirds of the global median. In 2008, that proportion had declined to less than one-half.
These results show a remarkable change in the underlying global income distribution. We now live in a world with a bulge around the median with significantly rising incomes for the entire second third of global income distribution. That is the new “aspiring” global middle class.
We also see growing wealth and (probably) power of those at the very top and, remarkably, stagnant incomes for both the very poorest and the people just below the richest 1%
If emerging market economies continue to post similar growth rates over the next 20 years, we might see the bulge in the figure moving rightward. In that case, people from those countries would enter the ranks of the global upper middle class. And many of them would make it to the top 1-5 percent.
A longer version of this post appeared on The Globalist. Also, follow the discussion about this on From Poverty to Power.

Join the Conversation