The increasing availability of standardized transport data and computing power is allowing us to understand the spatial and network impacts of different transportation projects or policies. In January, we officially introduced the
OpenTripPlannerAnalyst (OTPA) Accessibility Tool. This open-source web-based tool allows us to combine the spatial distribution of the city (for example, jobs or schools), the transportation network and an individual’s travel behavior to calculate the ease with which an individual can access opportunities.
Using the
OTPA Accessibility tool, we are unlocking the potential of these data sets and analysis techniques for modeling block-level accessibility. This tool allows anyone to model the interplay of transportation and land use in a city, and the ability to design transportation services that more accurately address citizens’ needs – for instance, tailored services connecting the poor or the bottom 40 percent to strategic places of interest.
In just a couple of months, we have begun to explore the different uses of the tool, and how it can be utilized in an operational context to inform our projects.
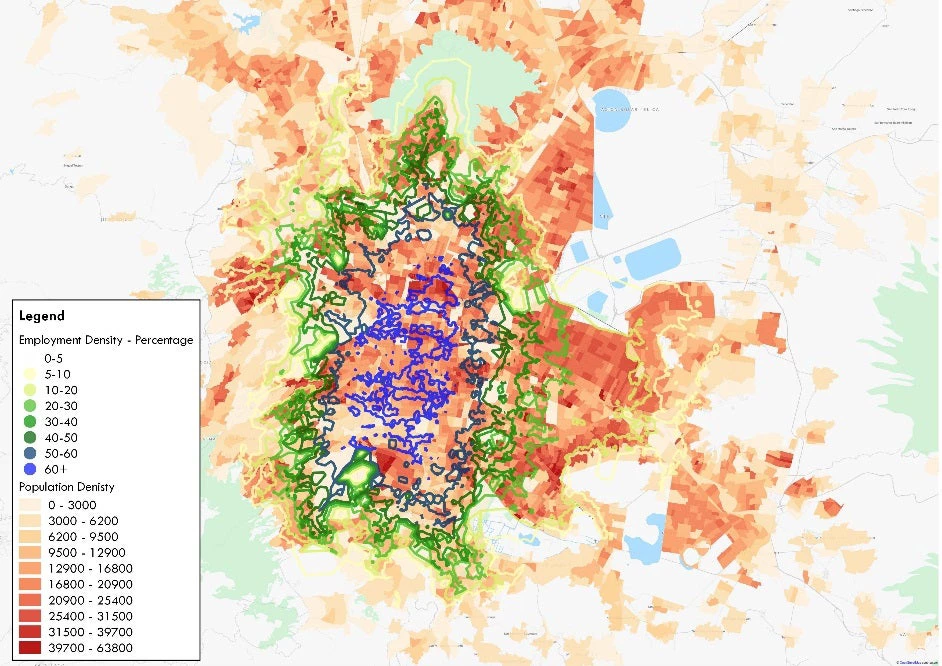
Employment Accessibility Changes in Lima, Metro Line 2. TTL: Georges Darido Comparing transportation scenarios The most obvious use of the tool is to compare the accessibility impacts of different transportation networks. The tool allows users to upload different transportation scenarios, and compare how the access to jobs changes in the different parts of the city. In Lima, Peru, we were able to compare the employment accessibility changes that were produced by adding a new metro line. It also helped us understand the network and connectivity impacts of the projects, rather than relying on only travel times.
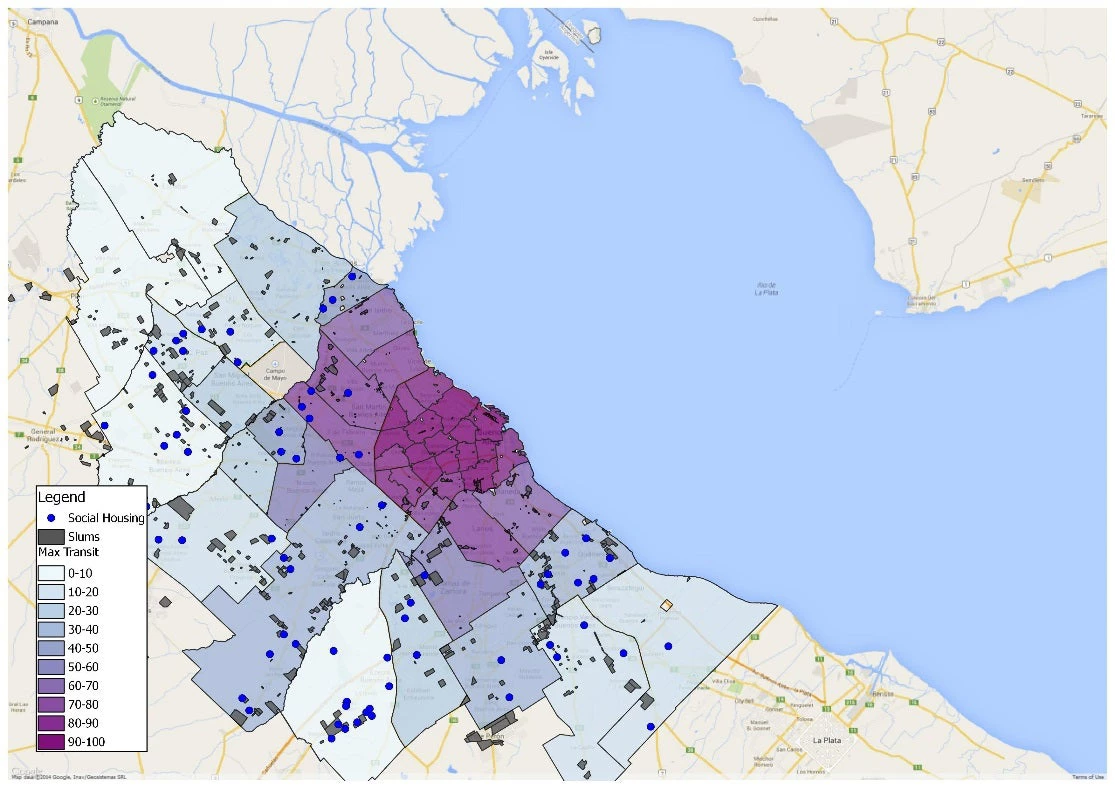
Understanding spatial form However, the tool’s uses are not limited to comparing transport scenarios. Combining the tool with earth observation data to identify the location of slums and social housing, we are to explore the spatial form of a city and the accessibility opportunities that are provided to a city’s most vulnerable population. We did so in Buenos Aires, Argentina, were we combined
LandScan data and outputs from the tool to understand the employment accessibility options available to the city’s poorest population groups.
Identifying optimal location of housing projects. TTL: Angelica Nunez Furthermore, we can use the tool to make better decisions on where to locate social housing projects. By overlaying the accessibility outputs and combining them with census data on residential location, we can find the areas in the city that offer high accessibility, but are not dense and thus appear to be ideal candidates for placing housing projects. We are also able to identify which areas might be densely populated but have poor accessibility to one or many of those services, and should be prioritized for new transit services.
Working in data-poor environments One of the main questions of the tool’s applicability is how it can be used in data-poor environments. The growing availability of high-resolution data products is allowing us to overcome this limitation. In areas such as Nairobi, Kenya, we can greatly improve our understanding of the city by combining the tool’s power with
WorldPop (which provides 100m population data). This allows us to understand a location’s accessibility to the people in the study area, and therefore identify the optimal location of employment centers, or other services such as schools and hospitals.
Using the tool and a diverse set of big data inputs, we are able to understand how accessibility varies throughout the city, rather than aggregated travel times or other broad measures that lack specificity. Ideally, the tool will be used across the World Bank Group to identify priority areas for projects, as well as indicators for ongoing projects. The widespread use of accessibility has the potential to change the way in which we evaluate the impact of urban transport projects, as well as other projects in other practices.
Exploring growth and spatial form, Buenos Aires. TTL: Shomik Raj Mehndiratta The initial months working with the tool has allowed us to explore a diverse set of environments that it can be used. Furthermore, the tool can be used beyond transport-centered projects to measure the accessibility of housing projects, as well as school, hospitals and other essential services.
We hope to continue the testing of this tool in various environments and projects, in order to fully exploit its potential to reframe this question: how does this investment help accessibility for this metropolitan area’s poorest 40 percent?


Join the Conversation