In August,
Patrick McEwan's meta-analysis of 76 randomized controlled trials (RCTs) on student learning in developing countries came out. I thought: Finally! The following month,
Krishnaratne et al. came out with another meta-analysis, this one analyzing 75 randomized and quasi-experimental studies on both enrollment and learning outcomes. These both come on the heels of
a systematic review from Kremer et al. in Science earlier this year, on the same topic.
All three studies upend the conventional wisdom that we know how to improve enrollment but not learning. Because the Krishnaratne paper has been the subject of a
blog post elsewhere, I’ll focus on the McEwan review.
Do we really have enough RCTs to say anything on this? Figure 1, adapted from McEwan’s paper, demonstrates the dramatic rise in these studies. And this shows only the randomized studies that (a) were conducted in a low- or middle-income country, (b) took place in primary schools, (c) included a business-as-usual control group, (d) measured learning using a continuous variable (i.e., not pass rates), and (e) provided enough data to calculate the treatment’s effect size and standard error for the full sample. There are many good studies that don’t fit one of these criteria, so this figure underestimates the total evidence we have. Regardless, we’ve come a long way from when Michael Kremer reviewed 9 RCTs in education in the American Economic Review in 2003.
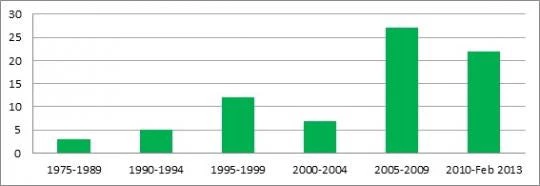
Figure 1: Expansion of RCTs on learning in developing countries (using date of first follow-up data collection)
Quick methodological note: In case you haven’t had the pleasure, meta-analyses go further than reviews of the evidence by constructing comparable estimates (in this case, standard deviations in test scores) of the impact of a treatment across studies and then combining those measures, adjusting for the relative precision of the measures in the different studies. So we go from “This worked in Kenya and India but it didn’t work in Nicaragua” to “Combining the evidence from Kenya, India, and Nicaragua, this worked.”
So, what has worked? I found two results striking: First, computer-assisted learning can be highly effective, particularly when combined with tutoring software aligned with the curriculum and a plan for their use. Computer interventions (that’s the technical term) haven’t worked when given to students and parents without any training ( as in Peru), when a plan for using them for tutoring was not adhered to ( as in Colombia), or when their use replaced instructional time ( as in India). Second, teacher training seems crucial to making other interventions work. I have seen a fair amount of teacher training that seems pretty ineffectual, and this doesn’t change that impression. But most successful interventions in McEwan’s sample (be they computer-assisted learning or contract teachers) incorporate at least some degree of teacher training. So whatever we’re planning to do, it makes sense to ensure the teachers can carry it out.
Figure 2 below shows the results across non-mutually exclusive categories: An intervention that combines computers and teacher training – as was effective in Ecuador – would appear in both categories.

Figure 2: Impact of classes of interventions
McEwan ends with a handful of practical recommendations to make impact evaluations more useful, ranging from the more familiar (e.g., add treatment arms, collect process data) to the more original (e.g., complement randomized, pilot findings with good quasi-experimental research on scaled-up interventions). Two are perhaps most useful for this kind of work: First, start reporting using a common reporting standard to make inter-evaluation comparisons more straightforward.
The second recommendation, report cost data, comes with more nuance. On the one hand, clearly more evaluations should report cost data. In this meta-analysis, 56% of treatments reported no details on the incremental costs of their programs, and most of the remaining provided minimal information. Imagine purchasing a new car with detailed information on performance but no data on price: Wait, that’s impossible to imagine. So yes, we need to report cost data. Then we can compare cost-effectiveness across interventions and see what gives us the biggest bang for our buck, right? ( JPAL has explored this exercise, as have I.)
But cost-effectiveness prioritization poses various challenges. Multiple outcomes and long-run outcomes are very difficult to capture. Even assuming away those problems ( as we do), we have to incorporate the imprecision of the estimates. This is best demonstrated graphically. (Note that I ball-parked all the numbers below using McEwan’s graphs, so this is just an exercise. Please don’t design a national education strategy based on the graph below.) Assuming no uncertainty in the cost estimates, then the blue bars on the chart below show the cost-effectiveness of the five cheapest and the one most expensive intervention with significant impacts on learning (at 90%). The prioritization is clear: The Madagascar intervention, at 43¢ per 0.2 standard deviations improved, is half the cost of the next cheapest intervention ( community participation in Indonesia) at 81¢ for the same improvement. The cheapest effective intervention is less than one-tenth the price per improvement as the fifth cheapest intervention.
Now look at the brackets on each estimate: These use the same cost, but at the top and bottom of the 95% confidence interval of the impact estimate. (McEwan suggests this experiment but doesn’t run it.) Suddenly, we cannot make any reasonable prioritization between any of the five cheapest interventions. We also cannot distinguish between the cost-effectiveness of Kenya’s teacher performance incentives and India’s computer-assisted instruction, even though the core estimate is that the former (at about $5.50) is one tenth the price of the latter (at about $51) for the same test score gain. This is because any time the lower bound estimate veers close to zero, the cost per gain literally goes off the chart (since that’s how I made the chart, but still, it gets big). So report the cost, check the price, but let’s manage expectations about what that will get us.
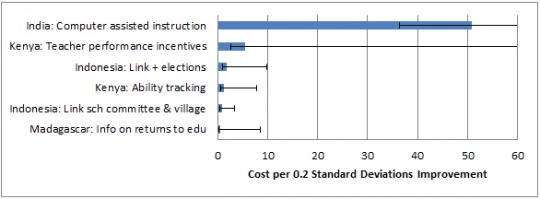
Figure 3: The Cheapest and the Most Expensive Effective Interventions
In sum, this is a very valuable collection of the evidence. With the number of education evaluations that I know are ongoing, I’m looking forward to the 2018 edition.
Bonus reading (for gold stars):
Do we really have enough RCTs to say anything on this? Figure 1, adapted from McEwan’s paper, demonstrates the dramatic rise in these studies. And this shows only the randomized studies that (a) were conducted in a low- or middle-income country, (b) took place in primary schools, (c) included a business-as-usual control group, (d) measured learning using a continuous variable (i.e., not pass rates), and (e) provided enough data to calculate the treatment’s effect size and standard error for the full sample. There are many good studies that don’t fit one of these criteria, so this figure underestimates the total evidence we have. Regardless, we’ve come a long way from when Michael Kremer reviewed 9 RCTs in education in the American Economic Review in 2003.
Figure 1: Expansion of RCTs on learning in developing countries (using date of first follow-up data collection)
Quick methodological note: In case you haven’t had the pleasure, meta-analyses go further than reviews of the evidence by constructing comparable estimates (in this case, standard deviations in test scores) of the impact of a treatment across studies and then combining those measures, adjusting for the relative precision of the measures in the different studies. So we go from “This worked in Kenya and India but it didn’t work in Nicaragua” to “Combining the evidence from Kenya, India, and Nicaragua, this worked.”
So, what has worked? I found two results striking: First, computer-assisted learning can be highly effective, particularly when combined with tutoring software aligned with the curriculum and a plan for their use. Computer interventions (that’s the technical term) haven’t worked when given to students and parents without any training ( as in Peru), when a plan for using them for tutoring was not adhered to ( as in Colombia), or when their use replaced instructional time ( as in India). Second, teacher training seems crucial to making other interventions work. I have seen a fair amount of teacher training that seems pretty ineffectual, and this doesn’t change that impression. But most successful interventions in McEwan’s sample (be they computer-assisted learning or contract teachers) incorporate at least some degree of teacher training. So whatever we’re planning to do, it makes sense to ensure the teachers can carry it out.
Figure 2 below shows the results across non-mutually exclusive categories: An intervention that combines computers and teacher training – as was effective in Ecuador – would appear in both categories.
Figure 2: Impact of classes of interventions
McEwan ends with a handful of practical recommendations to make impact evaluations more useful, ranging from the more familiar (e.g., add treatment arms, collect process data) to the more original (e.g., complement randomized, pilot findings with good quasi-experimental research on scaled-up interventions). Two are perhaps most useful for this kind of work: First, start reporting using a common reporting standard to make inter-evaluation comparisons more straightforward.
The second recommendation, report cost data, comes with more nuance. On the one hand, clearly more evaluations should report cost data. In this meta-analysis, 56% of treatments reported no details on the incremental costs of their programs, and most of the remaining provided minimal information. Imagine purchasing a new car with detailed information on performance but no data on price: Wait, that’s impossible to imagine. So yes, we need to report cost data. Then we can compare cost-effectiveness across interventions and see what gives us the biggest bang for our buck, right? ( JPAL has explored this exercise, as have I.)
But cost-effectiveness prioritization poses various challenges. Multiple outcomes and long-run outcomes are very difficult to capture. Even assuming away those problems ( as we do), we have to incorporate the imprecision of the estimates. This is best demonstrated graphically. (Note that I ball-parked all the numbers below using McEwan’s graphs, so this is just an exercise. Please don’t design a national education strategy based on the graph below.) Assuming no uncertainty in the cost estimates, then the blue bars on the chart below show the cost-effectiveness of the five cheapest and the one most expensive intervention with significant impacts on learning (at 90%). The prioritization is clear: The Madagascar intervention, at 43¢ per 0.2 standard deviations improved, is half the cost of the next cheapest intervention ( community participation in Indonesia) at 81¢ for the same improvement. The cheapest effective intervention is less than one-tenth the price per improvement as the fifth cheapest intervention.
Now look at the brackets on each estimate: These use the same cost, but at the top and bottom of the 95% confidence interval of the impact estimate. (McEwan suggests this experiment but doesn’t run it.) Suddenly, we cannot make any reasonable prioritization between any of the five cheapest interventions. We also cannot distinguish between the cost-effectiveness of Kenya’s teacher performance incentives and India’s computer-assisted instruction, even though the core estimate is that the former (at about $5.50) is one tenth the price of the latter (at about $51) for the same test score gain. This is because any time the lower bound estimate veers close to zero, the cost per gain literally goes off the chart (since that’s how I made the chart, but still, it gets big). So report the cost, check the price, but let’s manage expectations about what that will get us.
Figure 3: The Cheapest and the Most Expensive Effective Interventions
In sum, this is a very valuable collection of the evidence. With the number of education evaluations that I know are ongoing, I’m looking forward to the 2018 edition.
Bonus reading (for gold stars):
- Glewwe et al (2011) also have a review of educational outcomes in developing countries.
- McEwan has a paper discussing how to carry out cost-effectiveness analysis of education and health interventions (including how to measure costs).
- Dhaliwal et al (2012) also explore the issues with cost-effectiveness analysis – focusing on education, showing confidence bands on the estimates.

Join the Conversation