Detention
Published 1 December 2016

© Crown copyright 2016
This publication is licensed under the terms of the Open Government Licence v3.0 except where otherwise stated. To view this licence, visit nationalarchives.gov.uk/doc/open-government-licence/version/3 or write to the Information Policy Team, The National Archives, Kew, London TW9 4DU, or email: psi@nationalarchives.gov.uk.
Where we have identified any third party copyright information you will need to obtain permission from the copyright holders concerned.
This publication is available at https://www.gov.uk/government/statistics/immigration-statistics-july-to-september-2016/detention
Valid: 01 December 2016 to 22 February 2017
Data relate to the year ending September 2016 and all comparisons are with the year ending September 2015, unless indicated otherwise.
Back to ‘Immigration statistics July to September 2016’ content page.
This is not the latest release. View latest release.
1. Key facts
The number of people entering detention in year ending September 2016 decreased by 9% to 29,762 from 32,742 in the previous year.
Over the same period there was a 7% decrease in those people leaving detention (from 32,509 to 30,195). The proportion of detainees being returned or voluntarily departing the UK on leaving detention declined slightly from 47% in the year ending September 2015 to 46% in year ending September 2016. Conversely, the proportion of detainees granted temporary admission or release (TA/TR) increased slightly from 42% to 43%.
As at the end of September 2016, 2,998 people were in detention, 15% lower than the number recorded at the end of September 2015 (3,531). The fall may be partially attributed to the closure of Dover Immigration Removal Centre (IRC) in October 2015, temporary closure of Tinsley House IRC from July 2016, as well as changes in the number of people requiring detention.
People entering, leaving and in detention, solely under Immigration Act powers
| Year | Entering detention | Leaving detention | In detention(1) |
|---|---|---|---|
| Year ending September 2012 | 28,702 | 28,479 | 3,091 |
| Year ending September 2013 | 30,384 | 30,102 | 3,115 |
| Year ending September 2014 | 29,491 | 29,161 | 3,378 |
| Year ending September 2015 | 32,742 | 32,509 | 3,531 |
| Year ending September 2016 | 29,762 | 30,195 | 2,998 |
| Change: latest year | -2,980 | -2,314 | -533 |
| Percentage change | -9% | -7% | -15% |
Table notes
Source: Home Office, Immigration Statistics July to September 2016, Detention tables dt 01 q, dt 05 q and dt 11 q.
(1) The ‘in detention’ figures are as at the end of September in each year.
2. People leaving detention by nationality
In the year ending September 2016, 30,195 people left detention. Indian nationals accounted for the highest number of people leaving (3,086), a decrease of 2% compared with year ending September 2015 (3,137).
Top 5 nationalities of people leaving detention, year ending September 2016
| Nationality | Leaving detention | % Returned on leaving detention | % Granted TA/TR on leaving detention |
|---|---|---|---|
| India | 3,086 | 33% | 54% |
| Pakistan | 2,745 | 34% | 51% |
| Albania | 2,066 | 78% | 13% |
| Iran | 1,810 | 5% | 92% |
| Bangladesh | 1,652 | 27% | 58% |
Table notes
Source: Home Office, Immigration Statistics July to September 2016, Detention table dt 08 q.
Returned on leaving detention includes enforced returns, voluntary returns and refused entry at port and subsequently departed.
2.1 EU nationals leaving detention
In year ending September 2016, 4,361 EU nationals left detention, 31% more than in year ending September 2015 (3,321). The largest number was Romanian nationals (1,448; 5% of the total of all nationalities leaving detention). The second and third largest groups were Polish nationals (1,077; 4%) and Lithuanian nationals (571; 2%) respectively.
The proportion of EU nationals being returned or voluntarily departing the UK on leaving detention in year ending September 2016 was 90%, compared with 38% for non-EU nationals.
3. Reasons for people leaving detention
The decline in the proportion of detainees being returned or voluntarily departing the UK on leaving detention has slowed and slightly reversed as compared to the previous quarterly figure but still remains lower, from the most recent peak in the year ending March 2011 of 64% to 46% in year ending September 2016. Conversely, over the same period, the proportion of detainees granted TA/TR increased from 28% to 43%, and the proportion of detainees granted bail increased from 6% to 10%.
3.1 Reasons for people leaving detention (%)
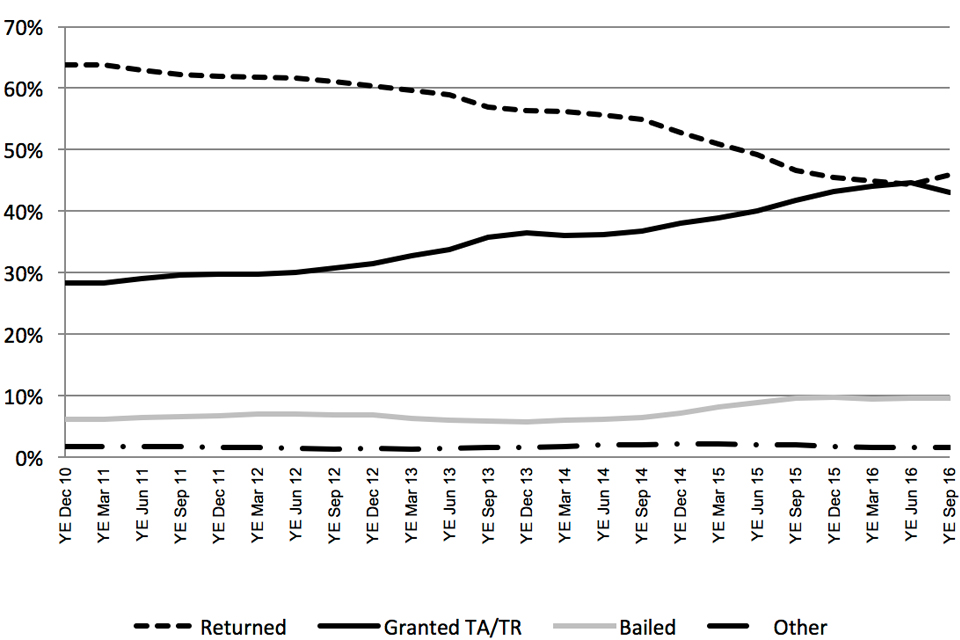
Chart notes
Source: Home Office, Immigration Statistics July to September 2016, Detention table dt 05 q.
Granted LTE/LTR (leave to enter / leave to remain); Granted TA/TR (temporary admission / temporary release).
Returned on leaving detention includes enforced returns, voluntary returns and refused entry at port and subsequently departed.
More detailed information on reasons for leaving detention may be found in the user guide.
4. Length of detention
During year ending September 2016, 30,195 people left detention. Of these, 63% had been in detention for less than 29 days, 19% for between 29 days and 2 months, and 12% for between 2 and 4 months. Of the 1,836 (6%) remaining, 203 had been in detention for between 1 and 2 years, and 37 for 2 years or longer.
In the same period, over a third (36%) of people leaving detention had been detained for 7 days or less (10,789). Of these, 52% (5,565) were returned; 46% (4,936) were granted TA/TR; and the remaining 3% were bailed (54), granted LTE or LTR (45), or released for other reasons (189). Of the 240 detained for 12 months or more, 35% were returned, 35% were bailed and 29% were granted TA/TR.
As at 30 September 2016, the longest length of time a person had been currently detained for was 1,241 days.
5. Children in detention
There were 93 children entering detention in year ending September 2016, 49% lower than the previous year (182). This was a 92% fall compared with the beginning of the data series in 2009 (1,119).
Of the 96 children leaving detention in year ending September 2016, 62 were granted TA/TR and 28 were returned from the UK. Of those leaving detention, 90 had been detained for 7 days or less, 3 for between 8 and 14 days, 1 for between 15 and 28 days and 2 for over 2 months. There were no children in detention as at 30 September 2016.
Children entering detention, solely under Immigration Act powers
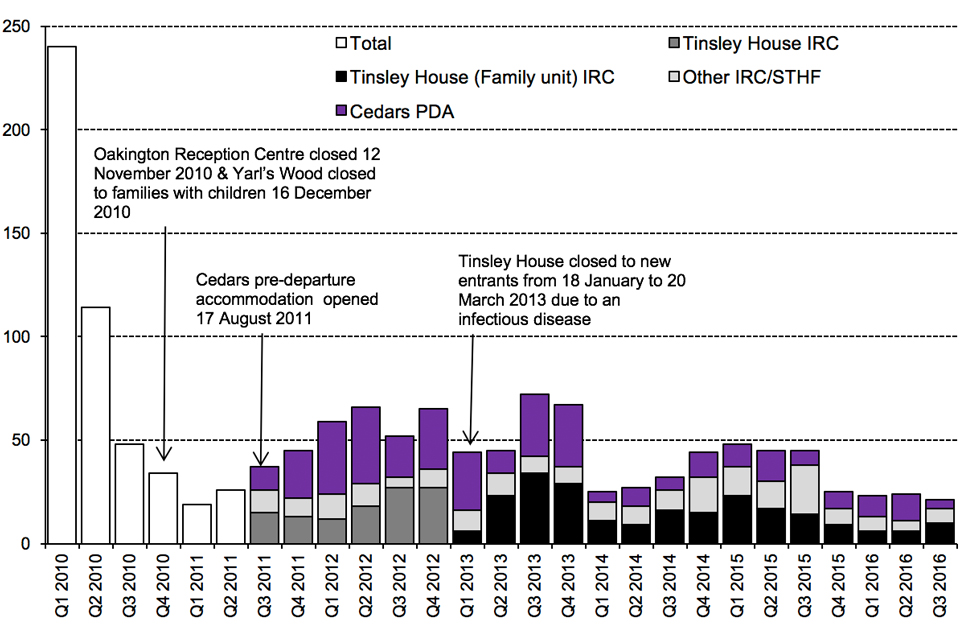
Chart notes
Source: Home Office, Immigration Statistics July to September 2016, Detention table dt 02 q.
Oakington Reception Centre closed on 12 November 2010; Yarl’s Wood closed to families with children on 16 December 2010. Cedars PDA (pre-departure accommodation) opened on 17 August 2011.
From the third quarter of 2011, all child detainees in Tinsley House are shown in Tinsley House IRC. From January 2013 child detainees in Tinsley House IRC, as part of a family, are shown in Tinsley House (Family Unit) IRC; the remainder are shown in Other IRC/STHF (short-term holding facilities).
Tinsley House IRC closed to new entrants from 18 January to 20 March 2013 due to an infectious illness.
6. Immigration detainees in prisons
As at 03 October 2016, there were 442 detainees held in prison establishments in England and Wales solely under immigration powers as set out in the Immigration Act 1971 or UK Borders Act 2007.
7. Data tables
Further data on detention are available in Detention tables dt 01 to dt 14 q.
8. Background information
The figures in this topic brief relate to the number of people entering, leaving or in detention, solely under Immigration Act powers, at immigration removal centres (IRCs), short-term holding facilities (STHFs) and pre-departure accommodation (PDA).
8.1 Migration transparency data webpage
A range of key input and impact indicators are currently published by the Home Office on the Migration transparency data webpage.