
As last week's US Census Bureau population estimates indicated, the story of population growth between 2014 and 2015 was largely about Texas, as it has been for the decade starting 2010 (See: “Texas Keeps Getting Bigger” The New Metropolitan Area Estimates). The same is largely true with respect to population trends in the nation's largest counties, with The Lone Star state dominating both in the population growth and domestic migration among 135 counties with more than 500,000 population. Florida also did very well, especially in view of the population and migration reversals that occurred around the Great Recession. Strong showings in other Southern states ensured that 80 percent of the fastest-growing large counties and those with the fastest domestic migration rates were in the South. The few remaining positions were taken up by metropolitan areas in the West (Table).
Large County Growth in Texas
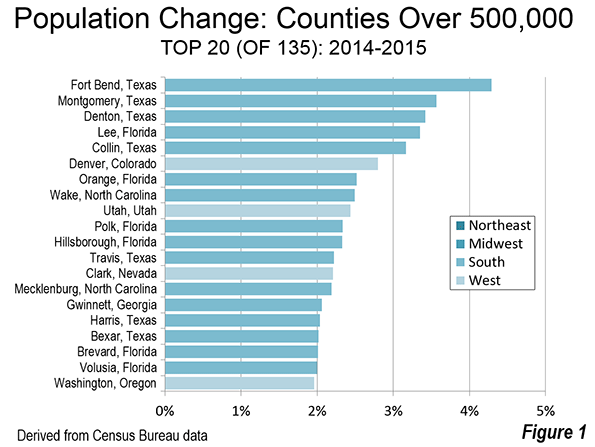
Houston, which is the fastest growing major metropolitan area (over 1 million population) in the nation includes the two fastest growing large counties. Fort Bend County added 4.29 percent to its population between 2014 and 2015 and now has 716,000 residents. Montgomery County grew 3.57 percent to 538,000. In addition to these two suburban Houston counties, Harris County, the core County ranked 16th in growth, adding 2.03 percent to its population and exceeding 4.5 million population.
Dallas-Fort Worth, the second fastest-growing major metropolitan area has two counties among the top 20. The third fastest-growing county is Denton (located north of Dallas-Fort Worth International Airport), which added 3.42 percent to its population over the past year and now has 781,000 residents. Collin County, to the north of Dallas County, grew 3.17 percent and now stands at 914,000 residents. Its current growth rate would put Collin County over 1 million population by the 2020 census.
Travis County, with its county seat of Austin, grew 2.22 percent to 1,177,000 and ranked 12th. Bexar County, centered on San Antonio grew 2.01 percent and ranks 17th.
The I-4 & Middle Florida Corridor
But there is another impressive growth story in the "I-4 & Middle Florida" corridor (the term “Central Florida“ is not used, because that usually just denotes the Orlando area). This includes counties along the Interstate 4 corridor, which runs from Tampa-St. Petersburg through Orlando to Daytona Beach as well as one county along Interstate 95 just south of Daytona Beach and adjacent to the Orlando metropolitan area.
Five of the fastest growing 20 counties with more than 500,000 population are located in this corridor. Orange County, the core of highly suburban Orlando grew at a rate of 2.49 percent between 2014 and 2015 and ranked seventh. Polk County (Lakeland metropolitan area), located midway between Orlando and Tampa-St. Petersburg grew 2.33 percent and ranked 10th. The south western terminus of Interstate 4 in Hillsborough County, which includes Tampa, Hillsborough County, grew 2.33 percent, though slightly slower than adjacent Polk County and ranked 11th. The other, north eastern terminus of Interstate 4 is located in Daytona Beach, in Volusia County. Volusia County grew at a rate of 2.00 percent and ranks 19th in population growth. Just to the south of is Brevard County, straddling Interstate 95. Brevard County (Palm Bay-Melbourne metropolitan area) grew 2.01 percent and ranked 18th in growth.
But Florida's fastest-growing large county was Lee, centered on Cape Coral and Fort Myers. Lee County added 3.35 percent to its population and now has 702,000 residents.
Other Fast Growing Counties
Denver County continued its strong growth (2.80 percent) and ranked sixth. Wake County, core of the Raleigh metropolitan area, grew at 2.49 percent and ranked eighth. Utah County, in the Provo metropolitan area grew 2.43 percent and ranked ninth.
Other counties in the top 20 included Clark (Las Vegas) in Nevada, Mecklenburg (Charlotte) in North Carolina, Gwinnett, a suburban county of Atlanta and Washington, a suburban county of Portland.
Overall, sixteen of the 20 fastest growing large counties were in the South and four in the West (Figure 1).
Largest Domestic Migration
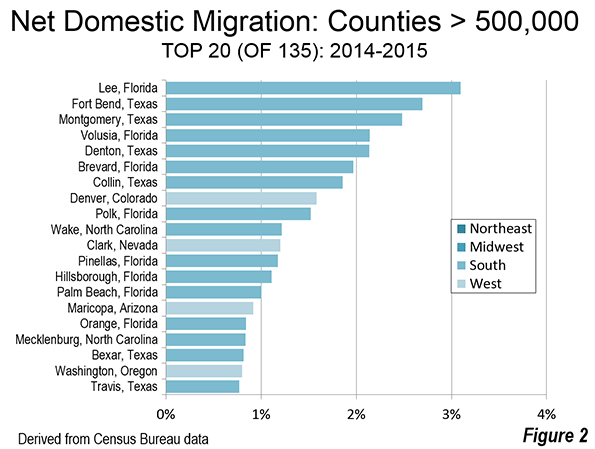
As with population growth, the top 20 in domestic migration was dominated by the South with 16 entries. Four of the migration magnets were located in metropolitan areas from the West (Figure 2).
Not surprisingly, the counties with the largest net domestic migration were often near the top of the list in population growth. Lee County, Florida (Cape Coral and Fort Myers) had the greatest net domestic migration between 2014 and 2015, at 3.10 percent. This is a particularly important reversal for Lee County, which experienced some of the most catastrophic house price declines during the housing bust.
Houston’s Fort Bend and Montgomery counties (Texas), the fastest growing large counties had the second and third largest domestic migration respectively. Denton County and Collin County, in the Dallas-Fort Worth metropolitan area ranked 5th and 7th respectively. Bexar County (San Antonio) ranked 18th, while Travis County (Austin) ranked 20th.
The I-4 & Middle Florida corridor also did well. Volusia County (Daytona Beach) ranked 4th in domestic migration, followed by its neighbor to the south, Brevard County. Polk County (Lakeland) ranked 9th, Hillsborough County (Tampa) ranked 13th and Orange County (Orlando) ranked 16th. In addition, Pinellas County (St. Petersburg), just across the bridge from Tampa ranked 12th. Palm Beach County, which is outside the I-4 & Middle Florida corridor ranked 14th.
Denver County, at 8th, was the highest ranking in domestic migration outside Texas and Florida. Other high ranking counties included #10 Wake County (Raleigh), #11 Clark County (Las Vegas), #15 Maricopa County (Phoenix), Mecklenburg County (Charlotte) and #19 Washington County (suburban Portland).
Slowest Growing Counties
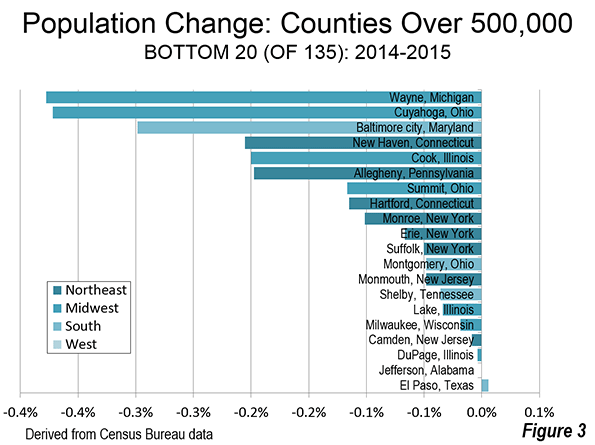
Seventeen of the 135 largest counties lost population. The 20 large counties with the least percentage population growth (or loss) were fairly evenly distributed outside the West. Eight were in the Northeast, seven in the Midwest and five in the South (Figure 3). The largest losses occurred in the counties containing core cities with some of the largest population losses in the last seven decades. These include Wayne County (Detroit), Cuyahoga County (Cleveland) Baltimore city, Cook County (Chicago) and Allegheny County (Pittsburgh), Hartford County, Monroe County (Rochester) and Erie County (Buffalo). The bottom 10 also included New Haven County, Connecticut and Summit County, Ohio (Akron).
Largest Domestic Migration Losses: A New York Story
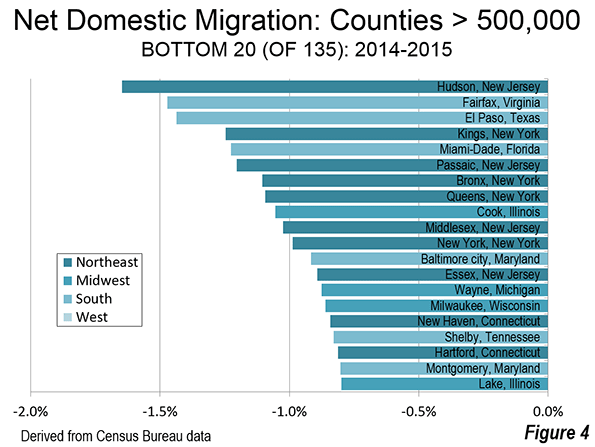
Among the 20 largest domestic migration losses, 10 were in the Northeast, four in the Midwest, and six in the South (Figure 4)
The largest domestic migration losses are taking place in the New York metropolitan area, which accounted for eight of the 13 largest counties in terms of domestic migration losses. This includes Hudson County New Jersey, which had the largest loss. It also included Kings County (Brooklyn), which had the fourth largest domestic migration loss. Bronx County had the seventh largest loss, Queens County the eighth largest loss and Manhattan County the 11th largest loss. In addition, other New Jersey suburban counties had substantial domestic migration losses, including Passaic County, Middlesex County and Essex County (Newark).
The South rated best in population growth and net domestic migration, but some large southern counties had among the largest domestic migration losses. These include Fairfax County (Washington suburb), El Paso County in Texas, Miami-Dade County in Florida and Baltimore city. Cook County (Chicago) was also among the top 10 domestic migration losers.
Moreover, the 13 large counties with the greatest losses excluded Wayne County, with its core city (Detroit) that has lost more of its population (percentagewise) than any other large municipality in the world. Yet, all of the counties listed above, including the eight in the New York metropolitan area lost a greater share of their population by domestic migrants than Wayne County.
Dominance by the South and the West
Overall, the largest counties added approximately 1.53 million residents over the past year. More than one half of that net domestic migration was in 19 counties of the South, 11 in the West, none in the Midwest and none in the Northeast. Three quarters of the net domestic migration was in just 52 of the 135 counties, with the South accounting for 30 counties. There were also 20 counties in the West, two in the Midwest and none in the Northeast. The two Midwestern counties were Franklin, Ohio (Columbus) and Dane, Wisconsin (Madison).
| US Counties Over 500,000 Population: Ranked By Population Growth 2014-2015 % | ||||||||||
| 2014-2015 & 2010-2015 | ||||||||||
| Population | Change | Dom. Migra. | ||||||||
| Rank | County, State | 4/2010 | 7/2014 | 7/2015 | Fr2010 | Fr2014 | Fr2010 | Fr2014 | Fr2010 | Fr2014 |
| 1 | Fort Bend, Texas | 585 | 687 | 716 | 131 | 29 | 22.4% | 4.29% | 13.1% | 2.69% |
| 2 | Montgomery, Texas | 456 | 519 | 538 | 82 | 19 | 17.9% | 3.57% | 11.8% | 2.48% |
| 3 | Denton, Texas | 663 | 755 | 781 | 118 | 26 | 17.8% | 3.42% | 10.4% | 2.14% |
| 4 | Lee, Florida | 619 | 679 | 702 | 83 | 23 | 13.5% | 3.35% | 10.8% | 3.10% |
| 5 | Collin, Texas | 782 | 886 | 914 | 132 | 28 | 16.8% | 3.17% | 9.3% | 1.86% |
| 6 | Denver, Colorado | 600 | 664 | 683 | 83 | 19 | 13.8% | 2.80% | 7.2% | 1.59% |
| 7 | Orange, Florida | 1,146 | 1,256 | 1,288 | 142 | 32 | 12.4% | 2.52% | 3.6% | 0.84% |
| 8 | Wake, North Carolina | 901 | 999 | 1,024 | 123 | 25 | 13.7% | 2.49% | 6.6% | 1.22% |
| 9 | Utah, Utah | 517 | 562 | 575 | 59 | 14 | 11.3% | 2.43% | 0.3% | 0.45% |
| 10 | Polk, Florida | 602 | 635 | 650 | 48 | 15 | 8.0% | 2.33% | 4.2% | 1.53% |
| 11 | Hillsborough, Florida | 1,229 | 1,318 | 1,349 | 120 | 31 | 9.7% | 2.33% | 3.4% | 1.11% |
| 12 | Travis, Texas | 1,024 | 1,151 | 1,177 | 152 | 26 | 14.9% | 2.22% | 6.5% | 0.77% |
| 13 | Clark, Nevada | 1,951 | 2,069 | 2,115 | 164 | 46 | 8.4% | 2.21% | 3.1% | 1.20% |
| 14 | Mecklenburg, North Carolina | 920 | 1,012 | 1,034 | 114 | 22 | 12.4% | 2.19% | 4.9% | 0.84% |
| 15 | Gwinnett, Georgia | 805 | 878 | 896 | 90 | 18 | 11.2% | 2.06% | 3.6% | 0.69% |
| 16 | Harris, Texas | 4,093 | 4,448 | 4,538 | 445 | 90 | 10.9% | 2.03% | 2.0% | 0.38% |
| 17 | Bexar, Texas | 1,715 | 1,860 | 1,898 | 183 | 37 | 10.7% | 2.01% | 4.4% | 0.82% |
| 18 | Brevard, Florida | 543 | 557 | 568 | 25 | 11 | 4.5% | 2.01% | 4.5% | 1.97% |
| 19 | Volusia, Florida | 495 | 508 | 518 | 23 | 10 | 4.7% | 2.00% | 5.3% | 2.14% |
| 20 | Washington, Oregon | 530 | 563 | 574 | 44 | 11 | 8.4% | 1.96% | 2.3% | 0.80% |
| 21 | Maricopa, Arizona | 3,817 | 4,090 | 4,168 | 351 | 78 | 9.2% | 1.91% | 3.9% | 0.92% |
| 22 | Washington, District of Columbia | 602 | 660 | 672 | 70 | 12 | 11.7% | 1.88% | 4.3% | 0.57% |
| 23 | Tarrant, Texas | 1,810 | 1,946 | 1,982 | 173 | 36 | 9.6% | 1.86% | 3.0% | 0.61% |
| 24 | Arapahoe, Colorado | 572 | 620 | 631 | 59 | 11 | 10.3% | 1.85% | 4.0% | 0.72% |
| 25 | El Paso, Colorado | 622 | 663 | 674 | 52 | 12 | 8.4% | 1.75% | 2.2% | 0.55% |
| 26 | Palm Beach, Florida | 1,320 | 1,399 | 1,423 | 103 | 24 | 7.8% | 1.74% | 4.2% | 1.00% |
| 27 | Snohomish, Washington | 713 | 759 | 773 | 59 | 13 | 8.3% | 1.72% | 3.0% | 0.67% |
| 28 | King, Washington | 1,931 | 2,082 | 2,117 | 186 | 35 | 9.6% | 1.67% | 2.4% | 0.29% |
| 29 | Multnomah, Oregon | 735 | 778 | 790 | 55 | 12 | 7.5% | 1.60% | 2.8% | 0.68% |
| 30 | Alameda, California | 1,510 | 1,613 | 1,638 | 128 | 25 | 8.5% | 1.57% | 1.2% | 0.22% |
| 31 | Pierce, Washington | 795 | 831 | 844 | 49 | 13 | 6.1% | 1.54% | 1.1% | 0.58% |
| 32 | San Joaquin, California | 685 | 715 | 726 | 41 | 11 | 6.0% | 1.54% | 0.6% | 0.52% |
| 33 | Duval, Florida | 864 | 899 | 913 | 49 | 14 | 5.6% | 1.52% | 0.5% | 0.47% |
| 34 | DeKalb, Georgia | 692 | 724 | 735 | 43 | 11 | 6.2% | 1.47% | -2.5% | -0.10% |
| 35 | Davidson, Tennessee | 627 | 669 | 679 | 52 | 10 | 8.3% | 1.46% | 2.0% | 0.30% |
| 36 | San Francisco, California | 805 | 853 | 865 | 60 | 12 | 7.4% | 1.44% | 0.6% | 0.20% |
| 37 | Broward, Florida | 1,748 | 1,870 | 1,896 | 148 | 27 | 8.5% | 1.43% | 1.7% | 0.11% |
| 38 | Franklin, Ohio | 1,164 | 1,234 | 1,252 | 88 | 18 | 7.6% | 1.43% | 1.0% | 0.17% |
| 39 | Fulton, Georgia | 921 | 996 | 1,011 | 90 | 14 | 9.8% | 1.41% | 3.4% | 0.28% |
| 40 | Cobb, Georgia | 688 | 731 | 741 | 53 | 10 | 7.7% | 1.41% | 1.4% | 0.24% |
| 41 | Riverside, California | 2,190 | 2,328 | 2,361 | 171 | 33 | 7.8% | 1.40% | 3.0% | 0.51% |
| 42 | Tulsa, Oklahoma | 603 | 630 | 639 | 36 | 9 | 5.9% | 1.40% | 1.5% | 0.53% |
| 43 | Contra Costa, California | 1,049 | 1,112 | 1,127 | 78 | 15 | 7.4% | 1.35% | 2.8% | 0.49% |
| 44 | Sacramento, California | 1,419 | 1,481 | 1,501 | 83 | 20 | 5.8% | 1.34% | 0.4% | 0.28% |
| 45 | Dallas, Texas | 2,368 | 2,520 | 2,553 | 186 | 34 | 7.8% | 1.34% | 0.0% | -0.10% |
| 46 | Salt Lake, Utah | 1,030 | 1,093 | 1,107 | 78 | 14 | 7.5% | 1.32% | -0.1% | -0.09% |
| 47 | Oklahoma, Oklahoma | 719 | 767 | 777 | 58 | 10 | 8.1% | 1.31% | 2.5% | 0.23% |
| 48 | Dane, Wisconsin | 488 | 517 | 524 | 36 | 7 | 7.3% | 1.30% | 1.9% | 0.25% |
| 49 | Hidalgo, Texas | 775 | 832 | 842 | 68 | 11 | 8.7% | 1.29% | -1.1% | -0.52% |
| 50 | Pinellas, Florida | 917 | 938 | 950 | 33 | 12 | 3.6% | 1.25% | 3.7% | 1.18% |
| 51 | Stanislaus, California | 514 | 532 | 538 | 24 | 6 | 4.7% | 1.21% | -0.7% | 0.12% |
| 52 | Santa Clara, California | 1,782 | 1,896 | 1,918 | 136 | 22 | 7.7% | 1.16% | -1.5% | -0.53% |
| 53 | Jefferson, Colorado | 535 | 559 | 566 | 31 | 6 | 5.8% | 1.16% | 3.4% | 0.69% |
| 54 | Douglas, Nebraska | 517 | 544 | 550 | 33 | 6 | 6.4% | 1.12% | 0.2% | -0.07% |
| 55 | Suffolk, Massachusetts | 722 | 770 | 778 | 56 | 8 | 7.8% | 1.08% | -2.1% | -0.75% |
| 56 | Johnson, Kansas | 544 | 574 | 580 | 36 | 6 | 6.6% | 1.08% | 1.6% | 0.12% |
| 57 | San Diego, California | 3,095 | 3,266 | 3,300 | 204 | 34 | 6.6% | 1.04% | -0.2% | -0.29% |
| 58 | Fresno, California | 930 | 965 | 975 | 44 | 10 | 4.8% | 1.02% | -1.7% | -0.21% |
| 59 | Kent, Michigan | 603 | 630 | 636 | 34 | 6 | 5.6% | 0.97% | 0.6% | 0.02% |
| 60 | Bronx, New York | 1,385 | 1,442 | 1,455 | 70 | 14 | 5.1% | 0.95% | -6.0% | -1.10% |
| 61 | Montgomery, Maryland | 972 | 1,030 | 1,040 | 68 | 10 | 7.0% | 0.94% | -2.2% | -0.80% |
| 62 | Kern, California | 840 | 874 | 882 | 43 | 8 | 5.1% | 0.91% | -1.5% | -0.31% |
| 63 | Hennepin, Minnesota | 1,152 | 1,212 | 1,223 | 71 | 11 | 6.1% | 0.91% | -0.1% | -0.29% |
| 64 | Miami-Dade, Florida | 2,498 | 2,669 | 2,693 | 195 | 24 | 7.8% | 0.91% | -3.3% | -1.23% |
| 65 | Guilford, North Carolina | 488 | 513 | 518 | 29 | 5 | 6.0% | 0.90% | 1.9% | 0.15% |
| 66 | San Mateo, California | 718 | 758 | 765 | 47 | 7 | 6.5% | 0.90% | 0.2% | -0.21% |
| 67 | Ramsey, Minnesota | 509 | 534 | 538 | 29 | 4 | 5.8% | 0.84% | -1.5% | -0.60% |
| 68 | San Bernardino, California | 2,035 | 2,110 | 2,128 | 93 | 18 | 4.6% | 0.84% | -1.1% | -0.23% |
| 69 | Middlesex, Massachusetts | 1,503 | 1,573 | 1,585 | 82 | 13 | 5.5% | 0.80% | -0.8% | -0.42% |
| 70 | Hudson, New Jersey | 634 | 670 | 675 | 41 | 5 | 6.4% | 0.80% | -6.6% | -1.65% |
| 71 | Orange, California | 3,010 | 3,145 | 3,170 | 160 | 25 | 5.3% | 0.79% | -0.4% | -0.32% |
| 72 | Essex, Massachusetts | 743 | 770 | 776 | 33 | 6 | 4.4% | 0.72% | 0.1% | -0.18% |
| 73 | Queens, New York | 2,231 | 2,322 | 2,339 | 109 | 17 | 4.9% | 0.72% | -5.1% | -1.09% |
| 74 | Anne Arundel, Maryland | 538 | 560 | 564 | 27 | 4 | 4.9% | 0.70% | 1.0% | -0.04% |
| 75 | Prince George's, Maryland | 864 | 903 | 910 | 46 | 6 | 5.3% | 0.68% | -2.4% | -0.72% |
| 76 | Honolulu, Hawaii | 953 | 992 | 999 | 46 | 7 | 4.8% | 0.67% | -2.4% | -0.75% |
| 77 | Plymouth, Massachusetts | 495 | 507 | 510 | 15 | 3 | 3.1% | 0.66% | 0.7% | 0.14% |
| 78 | Kane, Illinois | 515 | 528 | 531 | 16 | 3 | 3.0% | 0.63% | -1.8% | -0.23% |
| 79 | New Castle, Delaware | 538 | 553 | 557 | 18 | 3 | 3.4% | 0.62% | -0.6% | -0.18% |
| 80 | Kings, New York | 2,505 | 2,621 | 2,637 | 132 | 16 | 5.3% | 0.61% | -5.0% | -1.25% |
| 81 | Bergen, New Jersey | 905 | 933 | 939 | 33 | 6 | 3.7% | 0.61% | -0.8% | -0.28% |
| 82 | Los Angeles, California | 9,819 | 10,109 | 10,170 | 352 | 61 | 3.6% | 0.60% | -2.7% | -0.60% |
| 83 | Jackson, Missouri | 674 | 684 | 688 | 13 | 4 | 2.0% | 0.58% | -1.4% | -0.06% |
| 84 | Pima, Arizona | 980 | 1,004 | 1,010 | 30 | 6 | 3.0% | 0.58% | 0.1% | 0.02% |
| 85 | Lancaster, Pennsylvania | 519 | 534 | 537 | 17 | 3 | 3.3% | 0.56% | -0.6% | -0.28% |
| 86 | Ventura, California | 823 | 846 | 851 | 27 | 4 | 3.3% | 0.52% | -1.3% | -0.34% |
| 87 | Chester, Pennsylvania | 499 | 513 | 516 | 17 | 3 | 3.4% | 0.52% | 0.1% | -0.16% |
| 88 | Union, New Jersey | 536 | 553 | 556 | 19 | 3 | 3.6% | 0.49% | -3.0% | -0.70% |
| 89 | Worcester, Massachusetts | 799 | 815 | 819 | 20 | 4 | 2.6% | 0.49% | -1.1% | -0.27% |
| 90 | Norfolk, Massachusetts | 671 | 693 | 696 | 25 | 3 | 3.8% | 0.48% | 0.0% | -0.29% |
| 91 | Marion, Indiana | 903 | 935 | 939 | 36 | 4 | 3.9% | 0.48% | -1.6% | -0.55% |
| 92 | Ocean, New Jersey | 577 | 586 | 589 | 12 | 3 | 2.1% | 0.48% | 0.6% | 0.07% |
| 93 | New York, New York | 1,586 | 1,637 | 1,645 | 59 | 8 | 3.7% | 0.46% | -4.4% | -0.99% |
| 94 | Sedgwick, Kansas | 498 | 509 | 512 | 13 | 2 | 2.7% | 0.45% | -2.3% | -0.48% |
| 95 | Middlesex, New Jersey | 810 | 837 | 841 | 31 | 4 | 3.8% | 0.43% | -3.8% | -1.02% |
| 96 | Baltimore, Maryland | 805 | 828 | 831 | 26 | 3 | 3.3% | 0.40% | -0.4% | -0.31% |
| 97 | Westchester, New York | 949 | 973 | 976 | 27 | 4 | 2.9% | 0.40% | -1.9% | -0.46% |
| 98 | Jefferson, Kentucky | 741 | 761 | 764 | 23 | 3 | 3.0% | 0.39% | -0.3% | -0.27% |
| 99 | Bristol, Massachusetts | 548 | 555 | 557 | 8 | 2 | 1.5% | 0.39% | 0.0% | 0.04% |
| 100 | Philadelphia, Pennsylvania | 1,526 | 1,562 | 1,567 | 41 | 6 | 2.7% | 0.38% | -3.1% | -0.68% |
| 101 | Macomb, Michigan | 841 | 862 | 865 | 24 | 3 | 2.8% | 0.37% | 0.6% | -0.12% |
| 102 | Montgomery, Pennsylvania | 800 | 817 | 819 | 19 | 3 | 2.4% | 0.33% | -0.2% | -0.24% |
| 103 | Essex, New Jersey | 784 | 795 | 797 | 13 | 2 | 1.7% | 0.31% | -4.9% | -0.89% |
| 104 | Fairfax, Virginia | 1,082 | 1,139 | 1,142 | 61 | 3 | 5.6% | 0.28% | -4.3% | -1.47% |
| 105 | Will, Illinois | 678 | 686 | 687 | 10 | 2 | 1.4% | 0.24% | -2.4% | -0.47% |
| 106 | Fairfield, Connecticut | 917 | 946 | 948 | 31 | 2 | 3.4% | 0.24% | -1.9% | -0.74% |
| 107 | Providence, Rhode Island | 627 | 632 | 633 | 7 | 1 | 1.1% | 0.23% | -3.4% | -0.67% |
| 108 | Nassau, New York | 1,340 | 1,359 | 1,361 | 22 | 3 | 1.6% | 0.20% | -1.2% | -0.33% |
| 109 | Passaic, New Jersey | 502 | 510 | 511 | 9 | 1 | 1.9% | 0.20% | -5.6% | -1.20% |
| 110 | Oakland, Michigan | 1,202 | 1,240 | 1,242 | 40 | 2 | 3.3% | 0.19% | -0.3% | -0.53% |
| 111 | Delaware, Pennsylvania | 559 | 563 | 564 | 5 | 1 | 0.9% | 0.17% | -1.8% | -0.43% |
| 112 | Hamilton, Ohio | 802 | 806 | 808 | 5 | 1 | 0.7% | 0.16% | -2.4% | -0.40% |
| 113 | Bernalillo, New Mexico | 663 | 676 | 677 | 14 | 1 | 2.1% | 0.15% | -1.2% | -0.47% |
| 114 | Bucks, Pennsylvania | 625 | 627 | 627 | 2 | 1 | 0.3% | 0.12% | -0.8% | -0.14% |
| 115 | St. Louis, Missouri | 999 | 1,002 | 1,003 | 4 | 1 | 0.4% | 0.12% | -1.8% | -0.35% |
| 116 | El Paso, Texas | 801 | 836 | 836 | 35 | 0 | 4.4% | 0.01% | -3.3% | -1.44% |
| 117 | Jefferson, Alabama | 658 | 660 | 660 | 2 | (0) | 0.3% | 0.00% | -1.6% | -0.33% |
| 118 | DuPage, Illinois | 917 | 934 | 934 | 17 | (0) | 1.8% | 0.00% | -2.5% | -0.80% |
| 119 | Camden, New Jersey | 514 | 511 | 511 | (3) | (0) | -0.5% | -0.01% | -4.0% | -0.68% |
| 120 | Milwaukee, Wisconsin | 948 | 958 | 958 | 10 | (0) | 1.1% | -0.02% | -3.4% | -0.86% |
| 121 | Lake, Illinois | 703 | 704 | 704 | 1 | (0) | 0.1% | -0.03% | -4.1% | -0.80% |
| 122 | Shelby, Tennessee | 928 | 938 | 938 | 10 | (0) | 1.1% | -0.04% | -3.2% | -0.83% |
| 123 | Monmouth, New Jersey | 630 | 629 | 629 | (2) | (0) | -0.3% | -0.05% | -2.0% | -0.37% |
| 124 | Montgomery, Ohio | 535 | 533 | 532 | (3) | (0) | -0.5% | -0.05% | -2.4% | -0.45% |
| 125 | Suffolk, New York | 1,493 | 1,502 | 1,502 | 8 | (1) | 0.6% | -0.05% | -2.5% | -0.63% |
| 126 | Erie, New York | 919 | 923 | 923 | 4 | (1) | 0.4% | -0.07% | -1.4% | -0.47% |
| 127 | Monroe, New York | 744 | 750 | 750 | 5 | (1) | 0.7% | -0.10% | -2.6% | -0.80% |
| 128 | Hartford, Connecticut | 894 | 897 | 896 | 2 | (1) | 0.2% | -0.11% | -3.4% | -0.81% |
| 129 | Summit, Ohio | 542 | 543 | 542 | 0 | (1) | 0.0% | -0.12% | -1.4% | -0.41% |
| 130 | Allegheny, Pennsylvania | 1,223 | 1,233 | 1,230 | 7 | (2) | 0.6% | -0.20% | -0.4% | -0.46% |
| 131 | Cook, Illinois | 5,195 | 5,249 | 5,238 | 43 | (10) | 0.8% | -0.20% | -4.0% | -1.06% |
| 132 | New Haven, Connecticut | 862 | 861 | 859 | (3) | (2) | -0.3% | -0.21% | -3.4% | -0.84% |
| 133 | Baltimore city, Maryland | 621 | 624 | 622 | 1 | (2) | 0.1% | -0.30% | -3.8% | -0.92% |
| 134 | Cuyahoga, Ohio | 1,280 | 1,261 | 1,256 | (24) | (5) | -1.9% | -0.37% | -3.7% | -0.76% |
| 135 | Wayne, Michigan | 1,821 | 1,766 | 1,759 | (61) | (7) | -3.4% | -0.38% | -6.2% | -0.87% |
| In 000s | ||||||||||
| Data from Census Bureau | ||||||||||
Wendell Cox is principal of Demographia, an international pubilc policy and demographics firm. He is a Senior Fellow of the Center for Opportunity Urbanism (US), Senior Fellow for Housing Affordability and Municipal Policy for the Frontier Centre for Public Policy (Canada), and a member of the Board of Advisors of the Center for Demographics and Policy at Chapman University (California). He is co-author of the "Demographia International Housing Affordability Survey" and author of "Demographia World Urban Areas" and "War on the Dream: How Anti-Sprawl Policy Threatens the Quality of Life." He was appointed to three terms on the Los Angeles County Transportation Commission, where he served with the leading city and county leadership as the only non-elected member. He served as a visiting professor at the Conservatoire National des Arts et Metiers, a national university in Paris.
Photograph: Lee County, Florida (Cape Coral-Fort Myers), Top domestic migration gainer (by author)


